. 2024 Mar;25(3):1156-1175.
doi: 10.1038/s44319-024-00069-x. Epub 2024 Feb 8.

ARL5b inhibits human rhinovirus 16 propagation and impairs macrophage-mediated bacterial clearance

Affiliations

ARL5b inhibits human rhinovirus 16 propagation and impairs macrophage-mediated bacterial clearance

Suzanne Faure-Dupuy et al. EMBO Rep. 2024 Mar.

Abstract

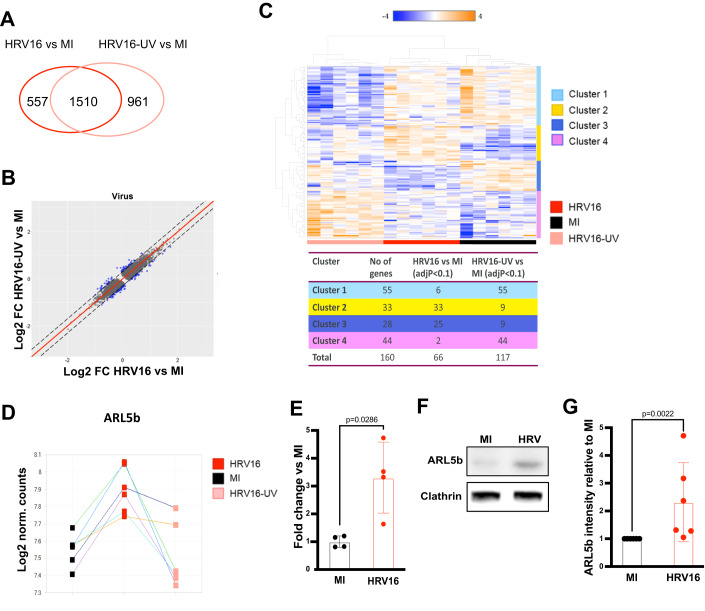
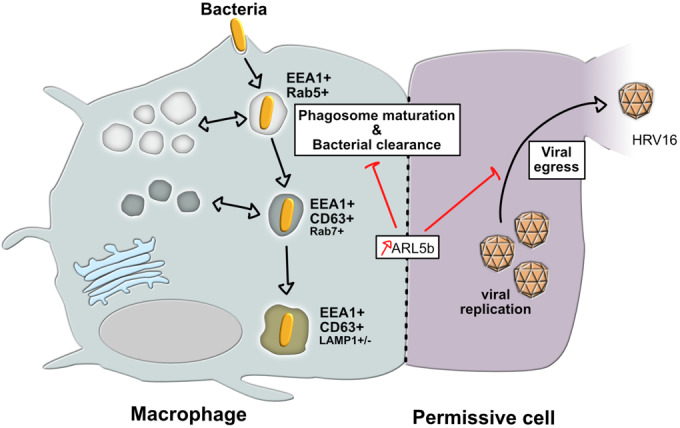
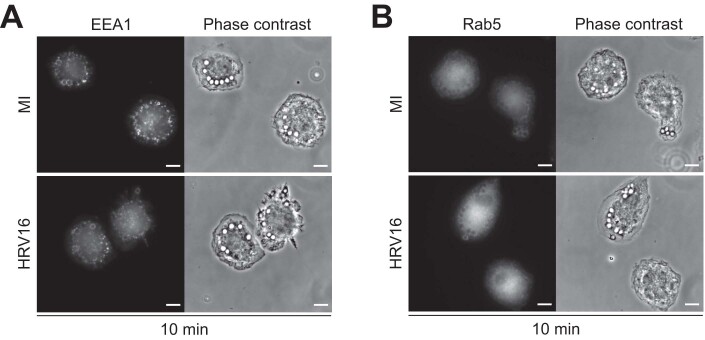
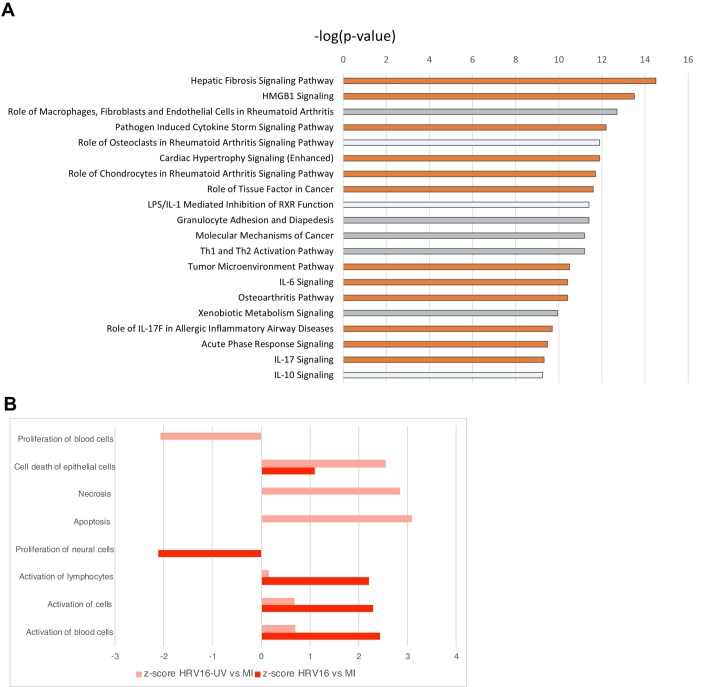
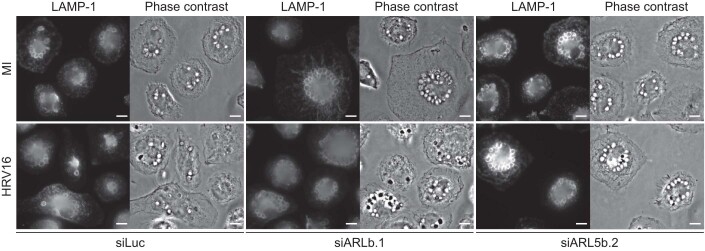
Human rhinovirus is the most frequently isolated virus during severe exacerbations of chronic respiratory diseases, like chronic obstructive pulmonary disease. In this disease, alveolar macrophages display significantly diminished phagocytic functions that could be associated with bacterial superinfections. However, how human rhinovirus affects the functions of macrophages is largely unknown. Macrophages treated with HRV16 demonstrate deficient bacteria-killing activity, impaired phagolysosome biogenesis, and altered intracellular compartments. Using RNA sequencing, we identify the small GTPase ARL5b to be upregulated by the virus in primary human macrophages. Importantly, depletion of ARL5b rescues bacterial clearance and localization of endosomal markers in macrophages upon HRV16 exposure. In permissive cells, depletion of ARL5b increases the secretion of HRV16 virions. Thus, we identify ARL5b as a novel regulator of intracellular trafficking dynamics and phagolysosomal biogenesis in macrophages and as a restriction factor of HRV16 in permissive cells.

Keywords: Bacteria; Endosomes; Macrophages; Phagosome Maturation; Restriction Factor.


Conflict of interest statement

LO, EI, KT, GM, DC, and NK work or worked for AstraZeneca which develops treatments and vaccines against pathogens. The remaining authors declare no competing interests.

Figures

Figure 1
Figure 1. HRV16 impairs bacterial clearance and phagolysosome activity by macrophages.
(AE) hMDMs were challenged with HRV16, HRV16UV, or MI. After O/N rest, cells were exposed to bacteria to perform a gentamicin protection assay and assess bacterial survival at the indicated time points. (A) Schematic representation of the experiment. (BE) Bacteria were either infected with (B) NTHi, (C) Moraxella catarrhalis, (D) Staphylococcus aureus, or (E) Pseudomonas aeruginosa, and bacteria survival was determined. (F) Schematic representation of bead assay to measure ROS production and protease activity within phagosomes by flow cytometry. (G, H) hMDMs were challenged with HRV16, HRV16UV or MI and then exposed to IgG-opsonized beads to measure (G) ROS or (H) protease production in mature phagolysosomes. Data information: (BE, G, H) Points represent the mean of three biological replicates of independent experiments +/− SEM. Two-way ANOVA with Dunnett’s post test statistical analysis was performed. Source data are available online for this figure.
Figure 2
Figure 2. HRV16 impairs phagosome maturation in macrophages.
(AJ) hMDMs were challenged with HRV16 or MI and then exposed to IgG-opsonized sheep red blood cells for the indicated time and stained with either (A, B) EEA1, (C, D) Rab5, (E, F) CD63, (G, H) Rab7 or (I, J) LAMP1. (A, C, E, G, I) Representative images of (A) EEA1, (C) Rab5, (E) CD63, (G) Rab7, (I) LAMP1 staining at the indicated time points in MI (upper row) and HRV16-treated cells (lower row). (B, D, F, H, J) Percentage of (B) EEA1, (D) Rab5, (F) CD63, (H) Rab7, or (J) LAMP1-positive phagosomes at the indicated times. Data information: Bars graph represents the mean of at least four biological replicates of independent experiments +/− SD. Unpaired student t test statistical analysis was performed for each time point. Scale bar represents 10 μm. Source data are available online for this figure.
Figure 3
Figure 3. HRV16 impairs endosomal markers localization and expression, as well as the Golgi apparatus morphology in macrophages.
(AC) hMDMs were challenged with HRV16 or MI and were then stained for EEA1. (A) Representative image of EEA1 staining in MI (left) or HRV16-treated cells (right) with (lower row) or without DAPI (upper row). (B) Quantification of the intensity of EEA1 staining per cell in 60 randomly chosen cells. (C) Quantification of the total number of EEA1-positive endosomes per cell in 60 randomly chosen cells. (D, E) hMDMs were challenged with HRV16, HRV16UV or MI and total protein was lysed for western blot. (D) Representative western blot with anti-EEA1 and anti-Tubulin as a loading control. (E) Quantification of EEA1 protein normalized to tubulin and presented as ratio to the MI control, n = 9. (FH) hMDMs were challenged with HRV16 or MI and were then stained for CD63. (F) Representative image of CD63 staining in MI (left) or HRV16-treated cells (right), with (lower row) or without DAPI (upper row). (G) Quantification of the intensity of CD63 staining per cell in 60 randomly chosen cells. (H) Quantification of the total number of CD63-positive endosomes per cell in 60 randomly chosen cells. (I) hMDMs were challenged with HRV16 or MI and then surface localized CD63 was analyzed by flow cytometry, n = 8. (J) Conventional EM micrographs of ultrathin sections of hMDMs treated or not with HRV16 (bottom or top panels, respectively). Arrows point to early endosomes with no obvious morphological alterations. Arrowheads point to Golgi apparatus/TGN with perturbed morphology in HRV16-treated cells (bottom panels) compared to control (top panels). (K, L) hMDMs were challenged with HRV16 or MI. Cells were stained for (K) GM130 or (L) TGN46 by immunofluorescence. Data show the quantification of the average intensity per cell of at least 30 randomly chosen cells. Data information: (A, F) Scale bar represents 15 μm. (J) Scale bars represent 1 μm. (B, C, E, GI, K, L) Bar graphs represent the mean of at least three biological replicates of independent experiments +/− SD. Paired student t test statistical analysis was performed. Source data are available online for this figure.
Figure 4
Figure 4. HRV16 increases ARL5b expression in macrophages.
(AD) hMDMs were challenged with HRV16, HRV16UV, or MI and characterized by RNA sequencing, n = 6. (A) Venn diagram of the results. The dark red circle represents the genes significantly regulated in the HRV16 vs MI analysis, and the light red circle represents the genes significantly deregulated in the HRV16UV vs MI analysis (FDR < 0.05). (B) By comparing the fold changes induced by HRV16 and HRV16UV, respectively (FDR < 0.1), a set of genes could be identified where the two responses differ to a larger extent. If the two responses are equal, they will fall on the diagonal line (red). The further off the diagonal, the more different the responses. Hundred and sixty genes fall outside of the +/− 2 SD cut-off (dotted blue lines). (C) Hierarchical clustering of the 160 genes with the most deviating responses to HRV16 and HRV16UV revealed four different clusters. (D) ARL5b is upregulated by the live HRV16 virus (FC: 1.3, FDR: 0.0091) but not by the inactivated virus (HRV16UV) (FC: −1.0, FDR: 0.97). Colored lines indicate paired samples by donor. (EG) hMDMs were challenged with HRV16 or MI. (E) ARL5b was analyzed by RT-qPCR. (F, G) ARL5b expression was analyzed by western blot. (F) Representative western blot with anti-ARL5b and anti-Clathrin as a loading control. (G) Quantification of ARL5b expression by ImageJ. Data information: (E) Bar graph represents the mean fold change +/− SD of HRV16 vs MI normalized to 18 S rRNA housekeeping gene of four independent experiments. Mann–Whitney U test was performed. (G) The bar graph represents the mean +/− SD of six biological replicates of independent experiments. Unpaired student t test statistical analysis was performed. Source data are available online for this figure.
Figure 5
Figure 5. ARL5b depletion rescues the HRV16-induced modifications in macrophages.
(AG) hMDMs were transfected with siRNA against luciferase (siLuc, control) or ARL5b (siARL5b.1 and siARL5b.2) and then challenged with HRV16 or MI. (A, B) Cells were lysed to analyze the protein content by western blot. (A) Representative western blot with anti-ARL5b and anti-GAPDH as a loading control. (B) Quantification of the ARL5b band intensity relative to GAPDH and normalized to the control MI siLuc condition. (C, D) Cells were stained to detect EEA1. (C) Representative images of EEA1. (D) Quantification of the intensity of EEA1 staining in 60 random cells. (E) CD63 surface staining was analyzed by flow cytometry. (F) After O/N rest, cells were exposed to bacteria (NTHi) to perform a gentamicin protection assay and assess bacterial survival. (G) Cells were exposed to IgG-opsonized sheep red blood cells for 60 min and stained with LAMP1. Graphs represent the percentage of LAMP1-positive phagosomes. Data information: (C) Scale bar represents 15 μm. (B, DF) Graphs represent the mean +/- SEM of at least three biological replicates of independent experiments. (B) One sample t test, (D, E) One-way ANOVA with Bonferonni post test or (F) two-way ANOVA with Dunnett’s post test statistical analysis were performed. (G) Bar graphs represent the mean of four biological replicates of independent experiments +/− SD. One-way ANOVA statistical analysis was performed for each time point. Source data are available online for this figure.
Figure 6
Figure 6. ARL5b inhibits HRV16 virion secretion in permissive cells.
(A) Schematic representation of the experiments presented in (BG). (BD) HeLa Ohio were transfected with a plasmid expressing a WT ARL5b coupled to mCherry (pARL5b WT) or expressing an inactive mutant of ARL5b coupled to GFP (pARL5b T30N) as well as corresponding control plasmids expressing similar fluorescent proteins (pCtrl WT and pCtrl T30N, respectively). Twenty-four hours post transfection, cells were infected with HRV16 or MI. Supernatants were collected after 8 h and cells were lysed for RNA analysis. (B, C) mRNA were extracted and (B) ARL5b and (C) HRV mRNAs were analyzed by RT-qPCR. (D) TCID50 was determined on the collected supernatants. (EG) HeLa Ohio were transfected with siRNA against luciferase (siLuc, control) or ARL5b (siARL5b.1 and siARL5b.2). 24 h post transfection, cells were infected with HRV16 or mock-infected. Supernatants were collected after 8 h, and cells were lysed. (E, F) mRNA were extracted and (E) ARL5b and (F) HRV mRNAs were analyzed by RT-qPCR. (G) TCID50 was determined on the collected supernatants. (H, I) HeLa Ohio infected with HRV16 or MI. Cells were lysed at the indicated time points. mRNA were extracted and (H) ARL5b and (I) HRV mRNAs were analyzed by RT-qPCR. (J, K) BEAS-2B were infected with HRV16 or MI. Cells were lysed at the indicated time points. mRNA were extracted and (J) HRV and (K) ARL5b mRNAs were analyzed by RT-qPCR. Data information: (BK) Bar graphs represent the mean +/− SD of at least three biological replicates of independent experiments performed in triplicates. (B, E) Two-way ANOVA, (D, G) one-way ANOVA, or (H, K) student t test statistical analysis were performed. Source data are available online for this figure.
Figure 7
Figure 7. Graphical abstract.
Summary of the results obtained in this study. Exposure to HRV upregulates ARL5b expression in macrophages, which leads to impairment of the intracellular trafficking and defect in phagosome maturation. This translates into stalled EEA1+ CD63+ LAMP1+/− phagosomes and a defective bacteria clearance. Moreover, ARL5b upregulation in permissive cells inhibits viral egress.
Figure EV1
Figure EV1. HRV16 does not impair EEA1 or Rab5 recruitment to phagosomes after 10 min.
(A, B) hMDMs were challenged with HRV16 or MI and then exposed to IgG-opsonized sheep red blood cells for 10 min and either stained for (A) EEA1 or (B) Rab5. Representative images of (A) EEA1 or (B) Rab5 staining for MI (upper row) and HRV16-treated cells (lower row) are shown. Data information: (A, B) Scale bar represents 10 µm.
Figure EV2
Figure EV2. Transcriptomic analysis of HRV16-treated macrophages.
hMDMs were challenged with HRV16, HRV16UV or MI and characterized by RNA sequencing, n = 6. Data were analyzed using Ingenuity Pathway Analysis. (A) Most dysregulated pathways in HRV16-treated cells compared to MI. Orange bars indicate a predicted significantly activated pathway with a z-score >2. White bars indicate a predicted non-significantly activated pathway with a −2>z-score >2. Gray bars indicate that the pathway does not have a directionality that allow activation/inhibition to be predicted. (B) Dysregulated pathways in the HRV16-treated or HRV16UV-treated cells compared to MI as determined from the 160 genes showing a larger variation than the normal spread when comparing the fold changes induced by HRV16 or HRV16UV. Data information: P values and z-scores were evaluated with Ingenuity Pathway Analysis. Right-tailed Fisher’s exact test statistical analysis was performed.
Figure EV3
Figure EV3. ARL5b depletion restores the recruitment of LAMP-1 to phagosomes in HRV16-treated macrophages.
hMDMs were transfected with siRNA against luciferase (siLuc, control) or ARL5b (siARL5b.1 and siARL5b.2) and challenged with HRV16 or MI. Cells were exposed to IgG-opsonized sheep red blood cells for 60 min and LAMP-1 was stained. Representative images of LAMP-1 staining for MI (upper row) and HRV16-treated cells (lower row) for each siRNA are shown. Data information: Scale bar represents 10 µm.

References

    1. Arruda E, Boyle TR, Winther B, Pevear DC, Gwaltney JM, Jr., Hayden FG. Localization of human rhinovirus replication in the upper respiratory tract by in situ hybridization. J Infect Dis. 1995;171:1329–1333. doi: 10.1093/infdis/171.5.1329. - DOI - PubMed
    1. Bellinghausen C, Rohde GGU, Savelkoul PHM, Wouters EFM, Stassen FRM. Viral-bacterial interactions in the respiratory tract. J Gen Virol. 2016;97:3089–3102. doi: 10.1099/jgv.0.000627. - DOI - PubMed
    1. Bennett JA, Prince LR, Parker LC, Stokes CA, de Bruin HG, van den Berge M, Heijink IH, Whyte MK, Sabroe I. Pellino-1 selectively regulates epithelial cell responses to rhinovirus. J Virol. 2012;86:6595–6604. doi: 10.1128/JVI.06755-11. - DOI - PMC - PubMed
    1. Bishop-Hurley SL, Schmidt FJ, Erwin AL, Smith AL. Peptides selected for binding to a virulent strain of Haemophilus influenzae by phage display are bactericidal. Antimicrob Agents Chemother. 2005;49:2972–2978. doi: 10.1128/AAC.49.7.2972-2978.2005. - DOI - PMC - PubMed
    1. Blakeway LV, Power PM, Jen FE, Worboys SR, Boitano M, Clark TA, Korlach J, Bakaletz LO, Jennings MP, Peak IR, et al. ModM DNA methyltransferase methylome analysis reveals a potential role for Moraxella catarrhalis phasevarions in otitis media. FASEB J. 2014;28:5197–5207. doi: 10.1096/fj.14-256578. - DOI - PubMed