. 2024 Mar;25(3):1436-1452.
doi: 10.1038/s44319-024-00060-6. Epub 2024 Feb 8.

Xanthomonas immunity proteins protect against the cis-toxic effects of their cognate T4SS effectors

Affiliations

Xanthomonas immunity proteins protect against the cis-toxic effects of their cognate T4SS effectors

Gabriel U Oka et al. EMBO Rep. 2024 Mar.

Abstract

Many bacteria kill rival species by translocating toxic effectors into target cells. Effectors are often encoded along with cognate immunity proteins that could (i) protect against "friendly-fire" (trans-intoxication) from neighboring sister cells and/or (ii) protect against internal cis-intoxication (suicide). Here, we distinguish between these two mechanisms in the case of the bactericidal Xanthomonas citri Type IV Secretion System (X-T4SS). We use a set of X. citri mutants lacking multiple effector/immunity protein (X-Tfe/X-Tfi) pairs to show that X-Tfis are not absolutely required to protect against trans-intoxication by wild-type cells. Our investigation then focused on the in vivo function of the lysozyme-like effector X-TfeXAC2609 and its cognate immunity protein X-TfiXAC2610. In the absence of X-TfiXAC2610, we observe X-TfeXAC2609-dependent and X-T4SS-independent accumulation of damage in the X. citri cell envelope, cell death, and inhibition of biofilm formation. While immunity proteins in other systems have been shown to protect against attacks by sister cells (trans-intoxication), this is an example of an antibacterial secretion system in which the immunity proteins are dedicated to protecting cells against cis-intoxication.

Keywords: cis-intoxication; Bacterial Competition; Biofilm; Immunity Protein; Type IV Secretion System.


Conflict of interest statement

The authors declare no competing interests.

Figures
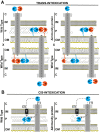
Figure 1
Figure 1. Schematic model of trans- and cis-intoxication mechanisms.
(A) Trans-intoxication. In this mechanism, intoxication is due to contact- and T4SS-dependent transfer of X-Tfes (effectors) from one cell to another. Left: Genetically identical cells with equivalent repertoires of X-Tfes and cognate X-Tfis (immunity proteins) would be protected. In the scheme shown here, two wild-type cells that produce two different effector-cognate immunity protein pairs (orange and blue; e: effectors and i: immunity proteins) are immune against the toxic effects of the X-T4SS-mediated trans-intoxication due to the protective role of cognate immunity proteins. Right: Encounters between cells with non-equivalent repertoires would lead to killing. In the scheme shown here, a wild-type cell that produces two different effector-cognate immunity protein pairs (blue and orange) is in contact with a mutant cell that produces only one effector-immunity protein pair (blue). The hypothesis is that the two cells transfer effectors into each other’s periplasm and since the prey cell lacks the immunity protein that inhibits the orange effector, its cell wall is susceptible to degradation. (B) Cis-intoxication. In this mechanism, instead of being transported outside of the cell by the X-T4SS, an effector is translocated into the periplasm. Translocation could be T4SS-dependent (1) or T4SS-independent (2). Left: A wild-type cell carrying a complete set of cognate immunity proteins is protected against self-intoxication. Right: A bacterial strain lacking the immunity protein (ΔImmunity protein), may be susceptible to the cumulative activity of an effector that leaks into the periplasm. C cytoplasm, IM inner membrane, OM outer membrane, P periplasm.
Figure 2
Figure 2. X-T4SS-related immunity proteins are not required to confer protection against trans-intoxication mediated by the X-T4SS.
(A) Bacterial competition of X. citri against E. coli MG1655 cells expressing β-galactosidase. E. coli killing was monitored by detecting the degradation of chlorophenol red-β-D-galactopyranoside (CPRG) by measuring absorbance at 572 nm at 10 min intervals. Data points present the means +/− SD of three experiments (biological replicates). (B) X. citri cell viability ratio (X.citri(gentR)/X.citri(kanR) after co-culture in Luria-Bertani (LB) agar after 40 h. X. citri strains used: wild-type (WT), ΔvirB7 (ΔVirB7), ∆X-TfeXAC2609∆X-TfiXAC2610 and Δ8Δ2609-GFP. In each co-culture experiment, the WT strain carried the pBBR(MCS5)GFP plasmid conferring resistance to gentamicin (gentR) and the genetically modified strain carried the pBBR(MCS2)RFP vector that confers resistance to kanamycin (kanR). Colony-forming units per mL (CFU/mL) of each strain was assessed through serial dilution assays on LB-agar plates carrying the appropriate antibiotics. Mean (vertical bars) +/− SD (horizontal bars); n = 5 (biological replicates) with each replicate represented by a single data point (blue dot). Analysis of variance (Anova) P value = 0.66, thus at 0.05 level, the values are not significantly different. (C) Colony viability assay. X. citri wild-type strain (WT, ∆X-TfiXAC2610 strain and ∆X-TfiXAC2610 + X-TfiXAC2610 strain (∆X-TfiXAC2610C) were grown on LB-agar plates. After 48 h, 72 h, and 96 h at 30 °C, the colonies were resuspended in 2xTY media, and cellular viability (CFU/mL) was assessed through serial dilution assays on LB-agar plates. Mean (horizontal bars) +/− SD (vertical bars); n = 4 (biological replicates). Each replicate is represented by a single data point (blue dot). *Unpaired t test P values of the data at 72 h are <0.0001 for WT vs ∆X-TfiXAC2610 and <0.01 for ∆X-TfiXAC2610C vs ∆X-TfiXAC2610. **Unpaired t test P values of the data at 96 h are 0.056 for WT vs ∆X-TfiXAC2610 and <0.0001 for ∆X-TfiXAC2610C vs ∆X-TfiXAC2610. Source data are available online for this figure.
Figure 3
Figure 3. Quantitative analysis of X. citri cells exhibiting propidium iodide permeability shown in Movies EV1–5.
Micrographs show the last time point of one of the two experiments shown in each Movie (parts A of Movies EV1–5). The first three columns show merged, bright-field and propidium iodide fluorescence images. Scale bar 10 µm. The final column presents the fraction % of cells that exhibit propidium iodide fluorescence (red, auto-lysed) and those that did not exhibit propidium iodide fluorescence (gray, non-lysed). Further details regarding this quantitative analysis are presented in Appendix Table S1. Source data are available online for this figure.
Figure 4
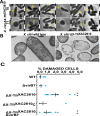
Figure 4. X-TfiXAC2610 is important for maintaining X. citri cell envelope integrity.
(A) X. citri ΔX-TfiXAC2610 strain time-lapse microscopy shows spontaneous spheroplasts forming events. Arrows at T0 point to cells that will turn into spheroplasts at T1. See Movie EV6 for more examples. Scale bar 2 µm. (B) Transmission electron microscopy (TEM) micrographs of X. citri WT and ΔX-TfiXAC2610 strains after 12 h of growth in liquid 2xTY medium. Scale bars 500 nm. (C) Percentage of damaged cells observed in TEM micrographs. More examples of damaged cells are shown in Appendix Figs. S3 and S4. Total number of micrographs analyzed (n, technical replicates) for each X. citri strain: wild-type (WT, n = 15), ∆VirB7 (n = 5), ∆X-TfiXAC2610 (n = 10), ∆X-TfiXAC2610∆VirB7 (n = 10), ∆X-TfiXAC2610 complemented with X-TfiXAC2610 (∆X-TfiXAC2610c, n = 8). The percentage of damaged cells observed in each micrograph is represented by blue dots. Mean (vertical bars) +/− SEM (horizontal bars) are shown. ** denotes statistically significant differences in mean values when compared to the WT strain. Two sample t test unpaired P values for ∆X-TfiXAC2610 and ∆X-TfiXAC2610∆VirB7 are 2.10 × 10−5 and 3.41 × 10−3, respectively. Further details regarding quantitative and statistical analysis are given in Appendix Table S2. Source data are available online for this figure.
Figure 5
Figure 5. The hydrolytic activity of X-TfeXAC2609 inhibits X. citri biofilm formation in the absence of X-TfiXAC2610.
(A) X. citri wild-type and derived mutants carrying a plasmid for the endogenous expression of GFP were grown on 2xTY medium for 5 days at 30 °C in chambered microscope slides. X. citri wild-type (WT) strain, ∆VirB7 strain, ∆X-TfiXAC2610 strain, ∆X-TfiXAC2610∆VirB7 strain, ∆X-TfeXAC2609∆X-TfiXAC2610 strain containing the empty vectors pBRA (Φ) and complemented strains (∆X-TfiXAC2610 + X-TfiXAC2610, ∆X-TfiXAC2610∆VirB7 + X-TfiXAC2610, ∆X-TfeXAC2609∆X-TfiXAC2610 + X-TfeXAC2609, ∆X-TfeXAC2609∆X-TfiXAC2610 + X-TfeXAC2609NT, ∆X-TfeXAC2609∆X-TfiXAC2610 ∆X-TfeXAC2609NT E48A) are indicated above each fluorescence microscopy image. Images were taken with a fluorescence microscope at ×100 magnification. Scale bars, 5 µm. (B) Biofilm formation assay in 24-well plates. Plates containing start cultures of X. citri were grown in 2xTY medium for 24 h at 30 °C at 200 rpm and then maintained at room temperature (22 °C) without shaking for 7 days. X. citri strains with knockouts in the genes for ∆X-TfiXA2610, one of the X-T4SS components structural components (VirB4 to VirB10 and VirD4) and the double knockouts were used and are indicated above each well. Source data are available online for this figure.
Figure 6
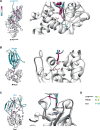
Figure 6. Co-evolutionary and structural analysis of the X-TfeXAC2609-X-TfiXAC2610 complex by AlphaFold2.
(A) Ribbon representation of the X-TfeXAC2609(1–194)-X-TfiXAC2610(54–267) complex predicted by AlphaFold2 (Mirdita et al, ; Varadi et al, ; Jumper et al, 2021). X-TfeXAC2609(1–194) is shown in gray and X-TfiXAC2610(54–267) is shown in yellow. The X-TfiXAC2610(54–267) Alphafold2 model is superposed with the previously determined X-ray crystal structure of X-TfiXAC2610 (residues 59–267, cyan; PDB code: 4QTQ) with a bound Ca2+ ion (sphere). Root-mean-square deviation (RMSD) of five Alphafold2 models is 0.22 Å, the Predicted Aligned Error (PAE) for the residues and the Predicted Local Distance Difference Test (lDDT) scores (Appendix Fig. S8) also indicate that the models are internally consistent. (B) Cartoon (left) and surface (right) representations of X-TfiXAC2610 colored according to degree of conservation (lowest, cyan; highest, purple). (C) Magnification of the protein–protein interface of the model shown in (A) that highlights the interaction between the conserved Y170 of X-TfiXAC2610 and E48 of X-TfeXAC2609 (both residues shown as sticks). (D) Peptidoglycan hydrolysis assay. M. luteus cell wall suspensions were treated with buffer (triangle) or with purified X-TfeXAC2609(1–308) (square), X-TfeXAC2609(1–308) -X-TfiXAC2610(His-55–267) (star), X-TfeXAC2609(1–308)-X-TfiXAC2610(His-55–267) Y170A and absorbance was monitored at 650 nm. Data points show the mean of n = 3 technical replicates +/− SD performed using a single batch of each of the purified proteins. Source data are available online for this figure.
Figure EV1
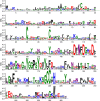
Figure EV1. Sequence conservation profile of the multiple alignment of X-TfiXAC2610 homologs.
The sequences of 429 X-TfiXAC2610 homologs (GenBank code AAM37459/refseq WP_011051709.1) were obtained as described in Material and Methods and are listed in Dataset EV1. The sequence conservation profile was generated using the Weblogo3 server (Crooks et al, 2004). Stacking height indicates sequence conservation at each position while the symbol within the stack indicates the relative frequency of each amino acid in that position. The numbering below the profile corresponds to the amino acid sequence of X-TfiXAC2610. The conserved motif from residues 151–159 corresponds to the Ca2+-binding loop observed in the X-TfiXAC2610 crystal structure (Souza et al, 2015). The conserved tyrosine at position 170 is found within a loop predicted to insert into the active site of the cognate effector as described in the main text.
Figure EV2
Figure EV2. Comparison of the model of the X-TfeXAC2609(1–194)-X-TfiXAC2610(54–267) complex with the crystal structures of the PliI-Ah - i-type lysozyme and Tsi1-Tse1 complexes.
(AC) Left panels: Ribbon representation of the (A) X-TfeXAC2609-X-TfiXAC2610 model generated by Alphafold2. (B) the crystal structure of the periplasmic i-type lysozyme inhibitor from Aeromonas hydrophila (PliI-Ah) in complex with the i-type lysozyme from Meretrix lusoria (MI-iLys) (PDB 4PJ2; (Herreweghe et al, 2015) and (C) the crystal structure of Tsi1-Tse1 complex from (PDB 3VPJ) (Ding et al, 2012). (AC) The inhibitors are colored according to the degree of conservation at each residue position in the corresponding family of homologs (lowest, cyan; highest, purple) and the cognate enzymes are colored in gray. (AC) Right panels: Zoom of the interaction interfaces showing the insertion of the inhibitory loops into the active sites of the enzymes. Stick models highlight the interactions between residues in the inhibitory loops (X-TfiXAC2610 Y170, PliI-Ah S104 and Tsi1 S109) and the enzyme active sites (X-TfeXAC2609 E48, MI-iLys E18, Tse1 H91). (D) Sequences in the inhibitory loops of X-TfiXAC2610, Plil-Ah and Tsi1 that interact directly with the catalytic site of the corresponding toxins. Underlined are X-TfiXAC2610 Y170, PliI-Ah S104 and Tsi1 S109.
Figure EV3
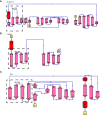
Figure EV3. Protein topology diagrams of X-TfiXAC2610, Pli-Ah and Tsi1.
Diagrams were generated using the PDBsum server (http://www.ebi.ac.uk/thornton-srv/databases/cgi-bin/pdbsum/GetPage.pl?pdbcode=index.html). Secondary-structure elements are indicated as red cylinders (α-helices) and pink arrows (β-strands). The dotted-squares highlight the common β-sheet found in the three immunity proteins containing a loop between the second and third β-strands that inserts into the active site of the cognate enzyme. (A) X-TfiXAC2610 (PDB 4QTQ). (B) Pli-Ah (PDB 4PJ2). (C) Tsi1 (PDB 3VPJ).

Similar articles

References

    1. Alegria MC, Souza DP, Andrade MO, Docena C, Khater L, Ramos CHI, da Silva ACR, Farah CS. Identification of new protein-protein interactions involving the products of the chromosome- and plasmid-encoded type IV secretion loci of the phytopathogen Xanthomonas axonopodis pv. citri. J Bacteriol. 2005;187:2315–2325. doi: 10.1128/JB.187.7.2315-2325.2005. - DOI - PMC - PubMed
    1. Alvarez-Martinez CE, Christie PJ. Biological diversity of prokaryotic type IV secretion systems. Microbiol Mol Biol Rev. 2009;73:775–808. doi: 10.1128/MMBR.00023-09. - DOI - PMC - PubMed
    1. Aoki SK, Pamma R, Hernday AD, Bickham JE, Braaten BA, Low DA. Contact-dependent inhibition of growth in Escherichia coli. Science. 2005;309:1245–1248. doi: 10.1126/science.1115109. - DOI - PubMed
    1. Atmakuri K, Cascales E, Christie PJ. Energetic components VirD4, VirB11 and VirB4 mediate early DNA transfer reactions required for bacterial type IV secretion. Mol Microbiol. 2004;54:1199–1211. doi: 10.1111/j.1365-2958.2004.04345.x. - DOI - PMC - PubMed
    1. Barnes CO, Pielak GJ. In-cell protein NMR and protein leakage. Proteins. 2011;79:347–351. doi: 10.1002/prot.22906. - DOI - PMC - PubMed

MeSH terms