. 2024 Feb 8;15(1):1176.
doi: 10.1038/s41467-024-45274-3.

Virological characteristics of the SARS-CoV-2 Omicron XBB.1.5 variant

Collaborators, Affiliations

Virological characteristics of the SARS-CoV-2 Omicron XBB.1.5 variant

Tomokazu Tamura et al. Nat Commun. .

Abstract

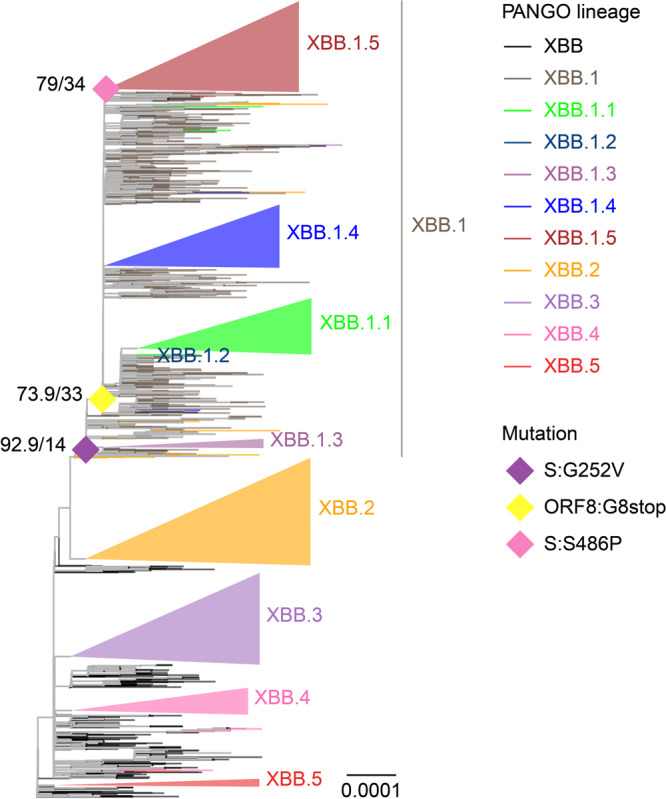
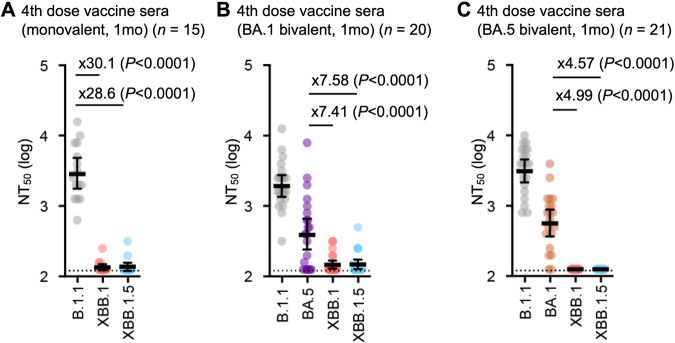
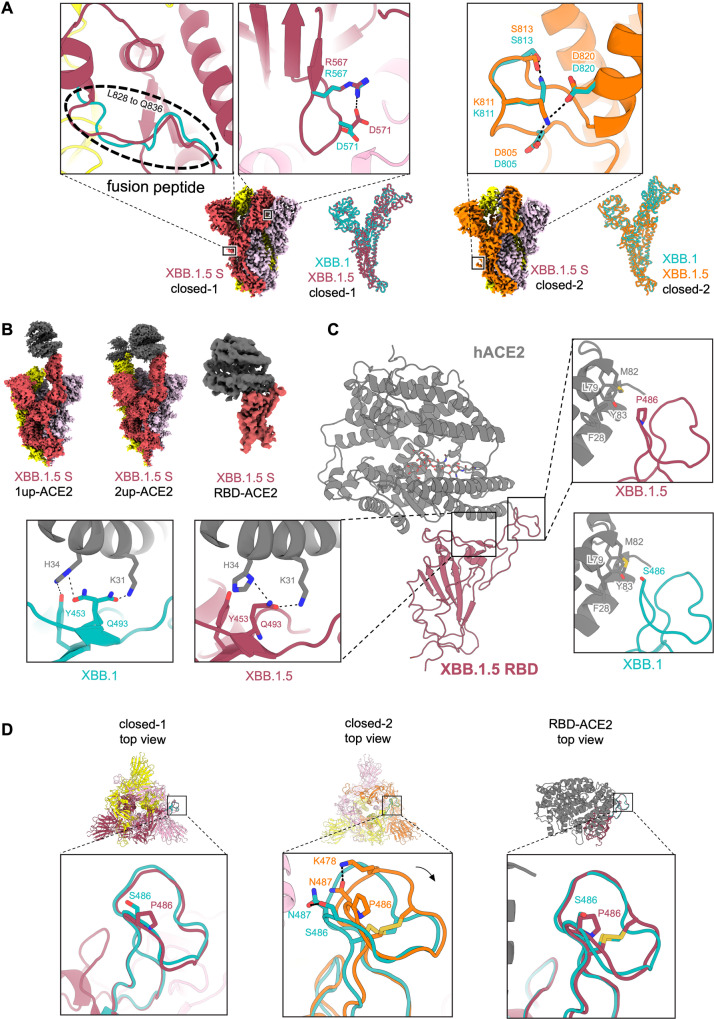
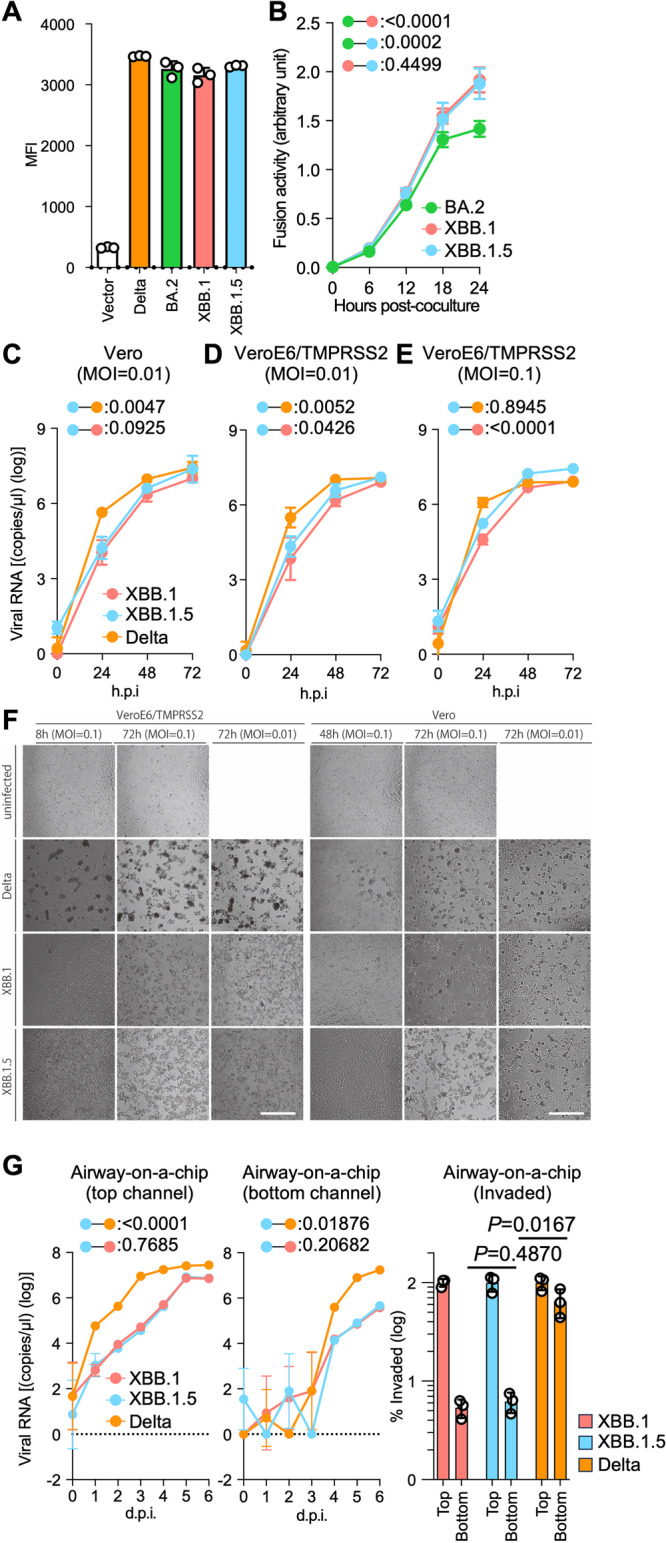
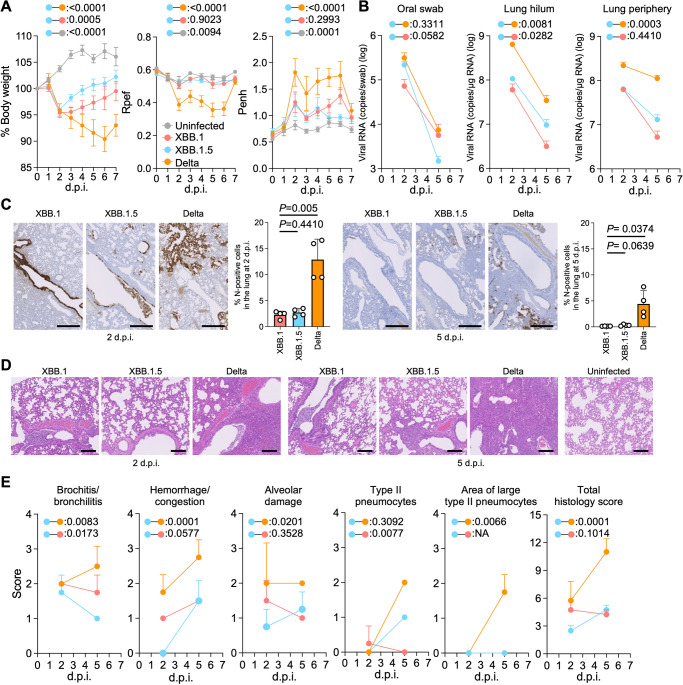
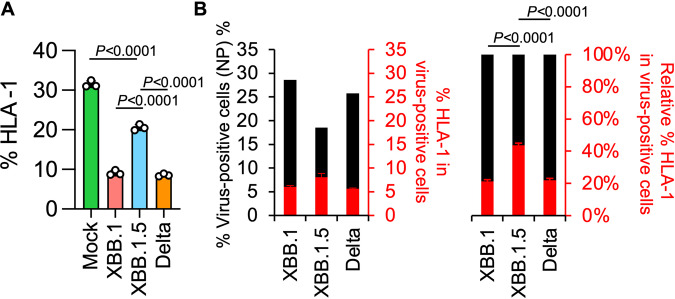
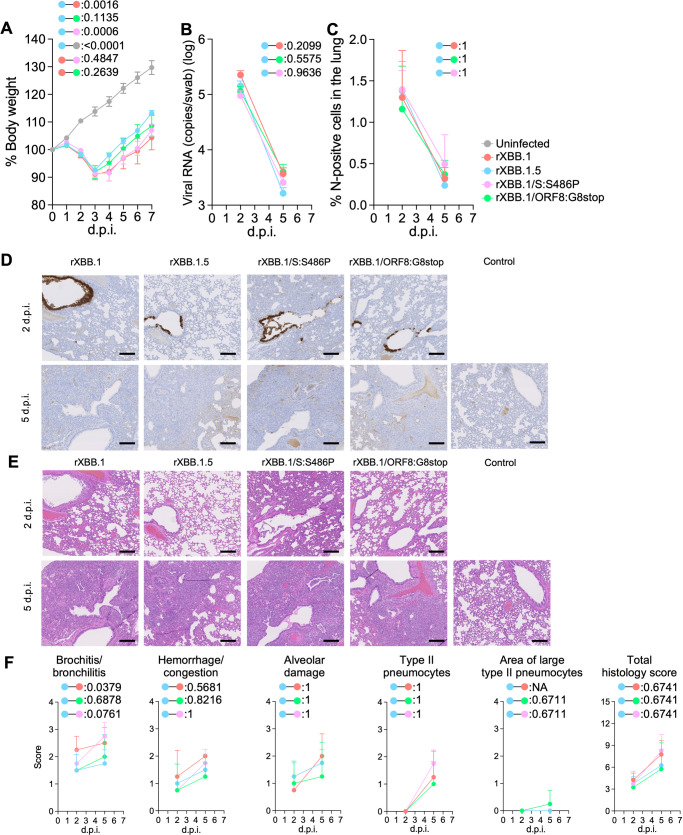
Circulation of SARS-CoV-2 Omicron XBB has resulted in the emergence of XBB.1.5, a new Variant of Interest. Our phylogenetic analysis suggests that XBB.1.5 evolved from XBB.1 by acquiring the S486P spike (S) mutation, subsequent to the acquisition of a nonsense mutation in ORF8. Neutralization assays showed similar abilities of immune escape between XBB.1.5 and XBB.1. We determine the structural basis for the interaction between human ACE2 and the S protein of XBB.1.5, showing similar overall structures between the S proteins of XBB.1 and XBB.1.5. We provide the intrinsic pathogenicity of XBB.1 and XBB.1.5 in hamsters. Importantly, we find that the ORF8 nonsense mutation of XBB.1.5 resulted in impairment of MHC suppression. In vivo experiments using recombinant viruses reveal that the XBB.1.5 mutations are involved with reduced virulence of XBB.1.5. Together, our study identifies the two viral functions defined the difference between XBB.1 and XBB.1.5.


Conflict of interest statement

The authors declare no competing interests.

Figures

Fig. 1
Fig. 1. Evolutionary history of the XBB.1.5 sublineage.
A representative maximum likelihood-based phylogenetic tree of SARS-CoV-2 in the XBB lineage. The XBB.1.4.1, XBB.3.1, and XBB.4.1 sublineages are included in the XBB.1.4, XBB.3, and XBB.4 lineages, respectively. Diamonds represent the occurrence of mutations of interest. Only mutation occurrences at internal nodes with at least 20 and also a half of descendant tips harboring the mutation are shown. Numbers at diamonds represent Shimodaira-Hasegawa-like approximate likelihood ratio test and ultrafast bootstrap supporting values, respectively.
Fig. 2
Fig. 2. Immune evasion of XBB.1.5.
Neutralization assays were performed with pseudoviruses harboring the S proteins of B.1.1, BA.1, BA.5, XBB.1, and XBB.1.5. The following sera were used: (A) fourth-dose vaccine sera collected one month after the fourth-dose monovalent vaccine (15 donors), (B) BA.1 bivalent vaccine (20 donors), and (C) BA.5 bivalent vaccine (21 donors). Assays for each serum sample were performed in triplicate to determine the 50% neutralization titer (NT50). Each dot represents one NT50 value, and the geometric mean and 95% CI are shown. Statistically significant differences were determined by two-sided Wilcoxon signed-rank tests. The P values versus B.1.1 are indicated in the panels. The horizontal dashed line indicates the detection limit (120-fold). Red numbers indicate decreased and increased NT50s. Information on the convalescent donors is summarized in Supplementary data 2.
Fig. 3
Fig. 3. Interaction between XBB.1.5 S and ACE2.
A Cryo-EM maps of XBB.1.5 S protein trimer closed-1 state (left) and closed-2 state (right). Each protomer is colored raspberry, yellow, and light pink (closed-1) or orange, yellow, and light pink (closed-2). In the close-up views, structures of the XBB.1.5 S protein trimer closed-1 state and closed-2 state are shown in the ribbon and stick model, and the corresponding residues in the XBB.1 S closed-1 and closed-2 structures (PDB: 8IOS and 8IOT, respectively) are also shown in cyan. On the right side of the closed-1 and closed-2 cryo-EM maps, the superposition of the main chain structures of the XBB.1 and XBB.1.5 protomers are shown. Dashed lines represent hydrogen bonds. B Cryo-EM maps of the XBB.1.5 S protein (same colors as A) bound to human ACE2 (gray) in the one-up state (left), two-up state (middle), or RBD–ACE2 interface (right). (C) Structure of the RBD–ACE2 complex (same colors as B). In the close-up views, residues involved in the corresponding interaction of the XBB.1.5 RBD–ACE2 complex structure, which is different from the XBB.1 RBD–ACE2 complex structure (PDB, 8IOV; RBD, cyan; ACE2, gray), are shown. The N103-linked glycan of ACE2 is represented by stick models. (D) Structures of the XBB.1.5 S protein trimer closed-1 state (left) and closed-2 state (middle), as well as the monomer RBD–ACE2 (right). In the close-up views, the RBD Y473–P491 loops (same colors as C and D) are shown, and the corresponding residues in the XBB.1 S are also shown as cyan sticks.
Fig. 4
Fig. 4. Virological characteristics of XBB.1.5 in vitro.
SARS-CoV-2 S protein-mediated membrane fusion assay in Calu-3/DSP1-7 cells. Surface S protein expression level in transfected HEK293 cells (A). Fusion activity (arbitrary units) of the BA.2, XBB.1, and XBB.1.5 S proteins are shown (B). Growth kinetics of XBB.1.5. Clinical isolates of Delta, XBB.1, and XBB.1.5 were inoculated into Vero cells (C) and VeroE6/TMPRSS2 cells (D and E). The copy numbers of viral RNA in the culture supernatant (C–E) were routinely quantified by RT-qPCR. (F) The cells were observed under microscopy to judge the CPE appearance. Scale bar: 500 μm. (G) Clinical isolates of XBB.1, XBB.1.5, and Delta were inoculated into an airway-on-a-chip system. The copy numbers of viral RNA in the top (left) and bottom (middle) channels of an airway-on-a-chip were routinely quantified by RT-qPCR. On the right, the percentage of viral RNA load in the bottom channel per top channel at 6 d.p.i. (i.e., % invaded virus from the top channel to the bottom channel) is shown. Assays were performed in triplicate (A, G) or quadruplicate (B–F). The presented data are expressed as the average ± SD (A, B) or SEM (C–G). Statistically significant differences versus XBB.1 across timepoints were determined by multiple regression (B-E and G left) or a two-sided Student’s t test (G right). The FWERs calculated using the Holm method are indicated in the figures. NA, not applicable.
Fig. 5
Fig. 5. Virological characteristics of XBB.1.5 in vivo.
Syrian hamsters were intranasally inoculated with XBB.1, XBB.1.5, and Delta. Six hamsters of the same age were intranasally inoculated with saline (uninfected). Six hamsters per group were used to routinely measure the respective parameters (A). Four hamsters per group were euthanized at 2 and 5 d.p.i. and used for virological and pathological analysis (B–E). A Body weight, Penh, and Rpef values of infected hamsters (n = 6 per infection group). B Left Viral RNA loads in the oral swab (n = 6 per infection group). (Middle and right) Viral RNA loads in the lung hilum (middle) and lung periphery (right) of infected hamsters (n = 4 per infection group). C IHC of the viral N protein in the lungs of infected hamsters at 2 d.p.i. (left) and 5 d.p.i. (right). Representative figures (N-positive cells are shown in brown) and the percentage of N-positive cells in whole lung lobes (n = 4 per infection group) are shown. D H&E staining of the lungs of infected hamsters. Representative figures are shown in (D). Uninfected lung alveolar spaces are also shown. The raw data are shown in Supplementary Fig. 4B and Supplementary Fig. 4C. E Histopathological scoring of lung lesions (n = 4 per infection group). Representative pathological features are reported in our previous studies,,,–. A–C, E Data are presented as the average ± SEM. (C) Each dot indicates the result of an individual hamster. A, B, E Statistically significant differences between XBB.1.5 and other variants across timepoints were determined by multiple regression. B, E The 0 d.p.i. data were excluded from the analyses. The FWERs calculated using the Holm method are indicated in the figures. C The statistically significant differences between XBB.1.5 and other variants were determined by a two-sided Mann–Whitney U test. C and D Each panel shows a representative result from an individual infected hamster. Scale bars, (C) 500 µm, (D) 200 µm.
Fig. 6
Fig. 6. Effects of ORF8 KO on HLA-I expression in human lung organoids.
A Clinical isolates of XBB.1, XBB.1.5, and Delta were inoculated into human iPSC-derived lung organoids. The percentages of HLA-I-positive cells in the lung organoids are shown. B The percentage of HLA-I-positive cells in viral N protein-positive lung organoids is shown. Assays were performed in triplicate. The presented data are expressed as the average ± SD. The statistically significant differences between XBB.1.5 and other variants were determined by a two-sided Student’s t test.
Fig. 7
Fig. 7. Virological characteristics of recombinant viruses bearing the single mutations in S and ORF8 in vivo.
Syrian hamsters were intranasally inoculated with the recombinant viruses rXBB.1, rXBB.1/S:S486P, rXBB.1/ORF8:G8stop, and rXBB.1.5. Six hamsters of the same age were intranasally inoculated with saline (uninfected). Six hamsters per group were used to routinely measure the body weight (A). Four hamsters per group were euthanized at 2 and 5 d.p.i. and used for virological and pathological analysis (B–E). A Body weight of infected hamsters (n = 6 per infection group). B Viral RNA loads in the oral swab (n = 4 per infection group). C Percentage of the viral N-positive cells in the lungs at 2 and 5 d.p.i. of infected hamsters. Representative figures (N-positive cells are shown in brown) are shown in (D). Uninfected lung alveolar space and bronchioles are also shown. E H&E staining of the lungs of infected hamsters. Representative images showing the same area with the viral N staining as in (D). F Histopathological scoring of lung lesions (n = 4 per infection group). Representative pathological features are reported in our previous studies–,–. (AC, and F) Data are presented as the average ± SEM.

References

    1. Kimura I, et al. Virological characteristics of the SARS-CoV-2 Omicron BA.2 subvariants, including BA.4 and BA.5. Cell. 2022;185:3992–4007.e16. doi: 10.1016/j.cell.2022.09.018. - DOI - PMC - PubMed
    1. Saito A, et al. Virological characteristics of the SARS-CoV-2 Omicron BA.2.75 variant. Cell Host. Microbe. 2022;30:1540–1555.e15.. doi: 10.1016/j.chom.2022.10.003. - DOI - PMC - PubMed
    1. Tamura T, et al. Virological characteristics of the SARS-CoV-2 XBB variant derived from recombination of two Omicron subvariants. Nat. Commun. 2023;14:2800. doi: 10.1038/s41467-023-38435-3. - DOI - PMC - PubMed
    1. Ito J, et al. Convergent evolution of SARS-CoV-2 Omicron subvariants leading to the emergence of BQ.1.1 variant. Nat. Commun. 2023;14:2671. doi: 10.1038/s41467-023-38188-z. - DOI - PMC - PubMed
    1. Suzuki R, et al. Attenuated fusogenicity and pathogenicity of SARS-CoV-2 Omicron variant. Nature. 2022;603:700–705. doi: 10.1038/s41586-022-04462-1. - DOI - PMC - PubMed

Substances