. 2024 Mar;34(3):214-231.
doi: 10.1038/s41422-023-00920-1. Epub 2024 Feb 8.

40 Hz light flickering promotes sleep through cortical adenosine signaling

Affiliations

40 Hz light flickering promotes sleep through cortical adenosine signaling

Xuzhao Zhou et al. Cell Res. 2024 Mar.

Abstract

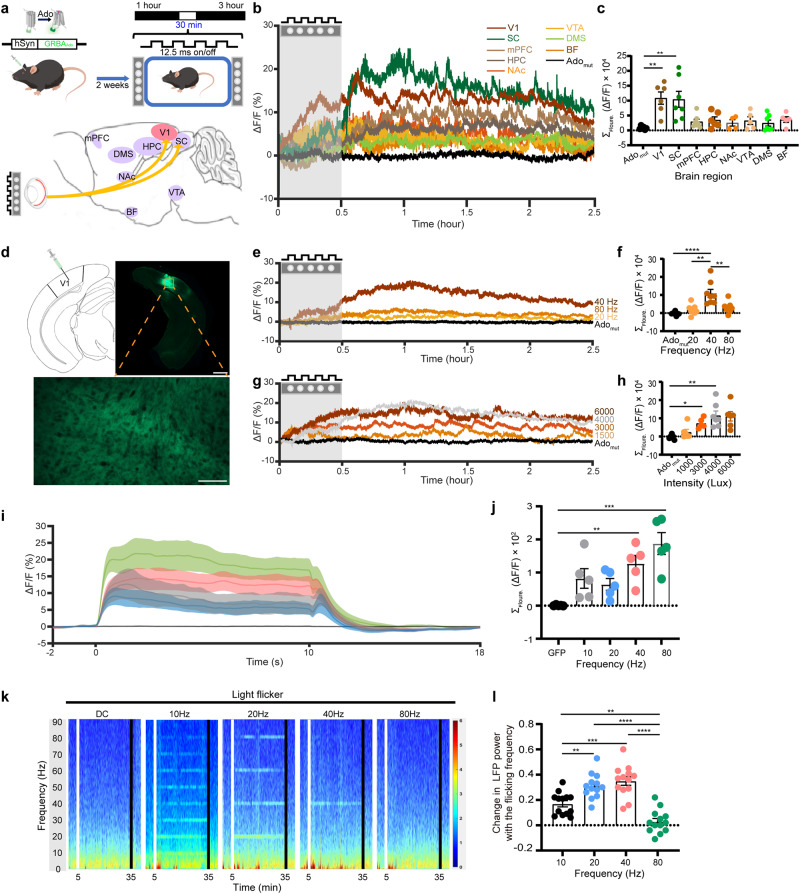
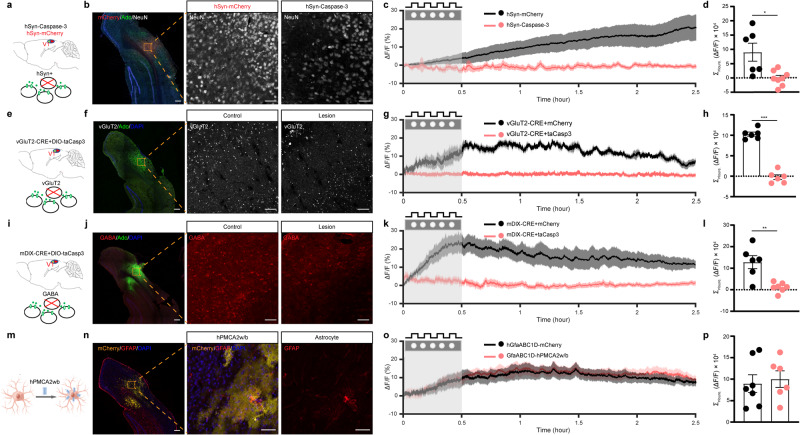
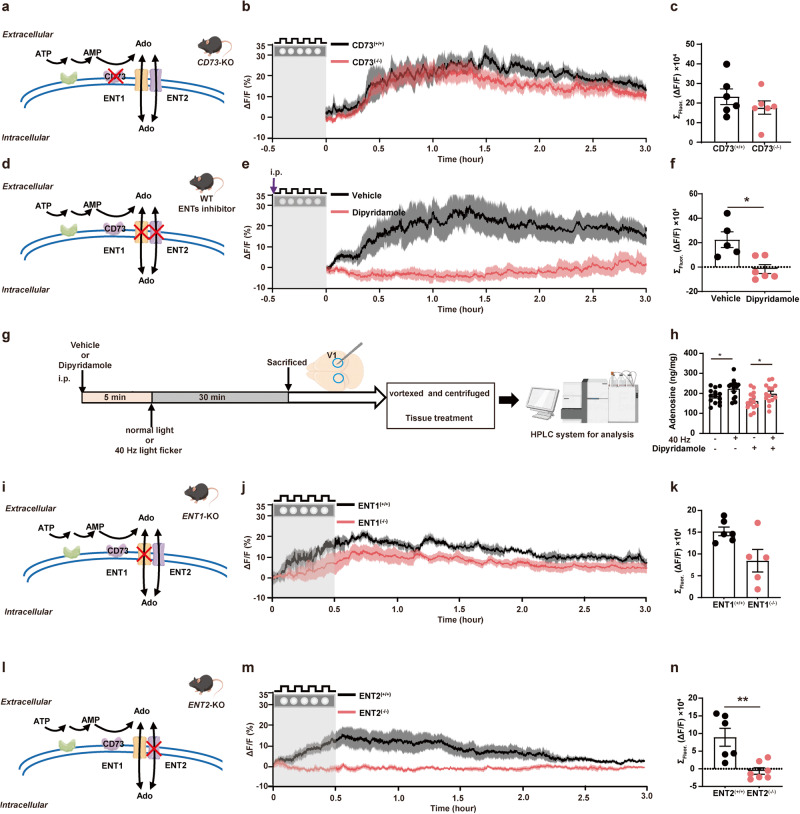
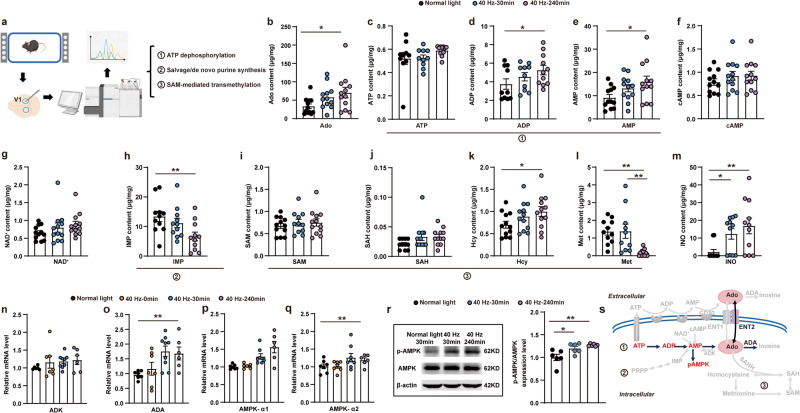
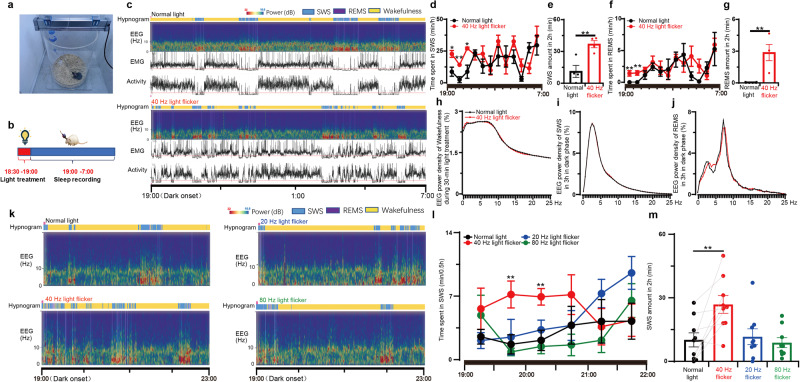
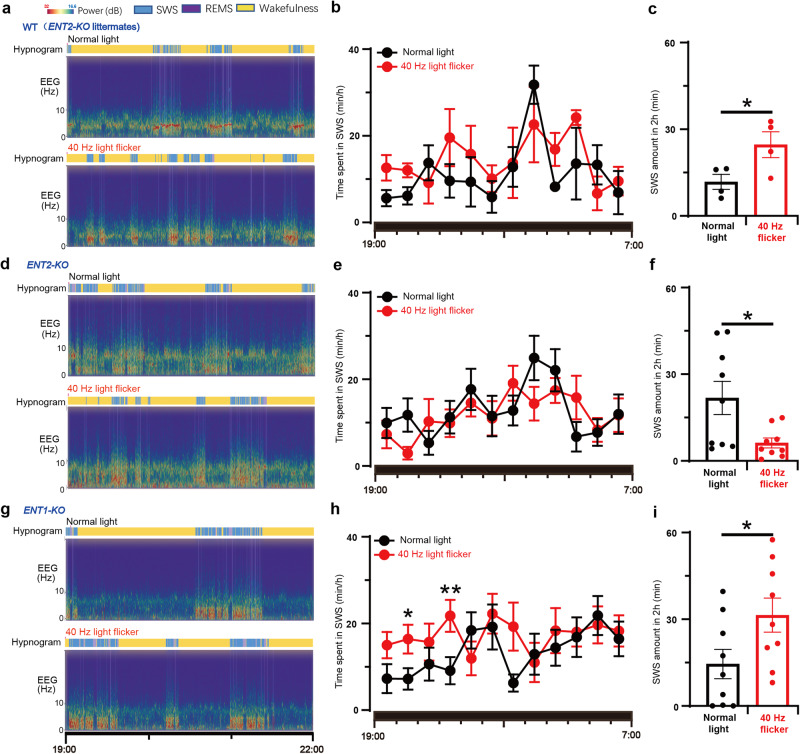
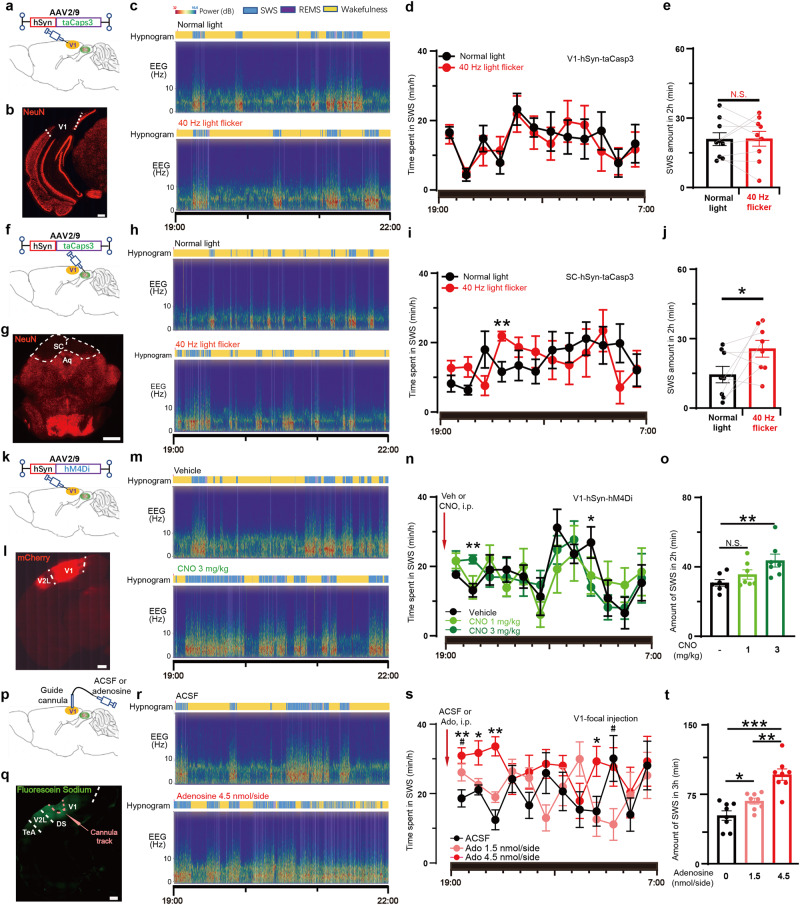
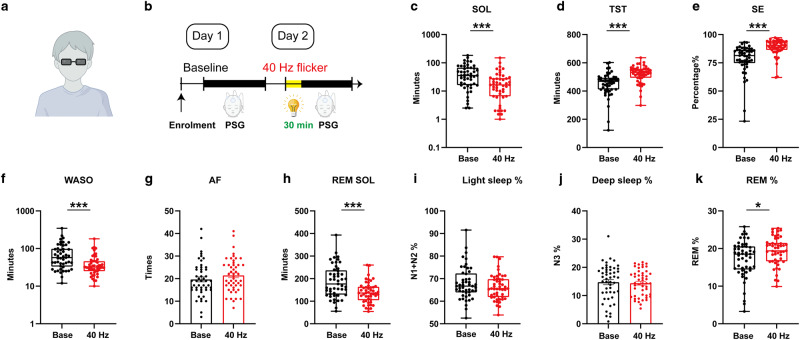
Flickering light stimulation has emerged as a promising non-invasive neuromodulation strategy to alleviate neuropsychiatric disorders. However, the lack of a neurochemical underpinning has hampered its therapeutic development. Here, we demonstrate that light flickering triggered an immediate and sustained increase (up to 3 h after flickering) in extracellular adenosine levels in the primary visual cortex (V1) and other brain regions, as a function of light frequency and intensity, with maximal effects observed at 40 Hz frequency and 4000 lux. We uncovered cortical (glutamatergic and GABAergic) neurons, rather than astrocytes, as the cellular source, the intracellular adenosine generation from AMPK-associated energy metabolism pathways (but not SAM-transmethylation or salvage purine pathways), and adenosine efflux mediated by equilibrative nucleoside transporter-2 (ENT2) as the molecular pathway responsible for extracellular adenosine generation. Importantly, 40 Hz (but not 20 and 80 Hz) light flickering for 30 min enhanced non-rapid eye movement (non-REM) and REM sleep for 2-3 h in mice. This somnogenic effect was abolished by ablation of V1 (but not superior colliculus) neurons and by genetic deletion of the gene encoding ENT2 (but not ENT1), but recaptured by chemogenetic inhibition of V1 neurons and by focal infusion of adenosine into V1 in a dose-dependent manner. Lastly, 40 Hz light flickering for 30 min also promoted sleep in children with insomnia by decreasing sleep onset latency, increasing total sleep time, and reducing waking after sleep onset. Collectively, our findings establish the ENT2-mediated adenosine signaling in V1 as the neurochemical basis for 40 Hz flickering-induced sleep and unravel a novel and non-invasive treatment for insomnia, a condition that affects 20% of the world population.


Conflict of interest statement

The authors declare no competing interests.

Figures

Fig. 1
Fig. 1. 40 Hz light flickering increases extracellular adenosine levels in light frequency- and intensity-dependent manners in the primary visual cortex in correlation with LFP gamma power.
a Schematic diagram depicting the experimental configuration for visual stimulation (upper panel). Schematic diagram depicting fiber photometry recording of extracellular adenosine levels in eight brain regions of mice, including V1, BF, NAc, VTA, SC, mPFC, HPC, and DMS using GRABAdo1.0. (lower left panel). b The effect of 40 Hz light flickering (4000 lux) on extracellular adenosine levels in eight brain regions of mice, including V1, BF, NAc, VTA, SC, mPFC, HPC, and DMS (n = 5–7/group). The vertical line in each plot represents the start and end of the light-flickering period. c Quantification of light flickering-evoked adenosine signals in V1, NAc, BF, VTA, SC, mPFC, HPC, and DMS (n = 5–7/group). d Fluorescence image of V1 showing the expression of hSyn-GRABAdo1.0. Scale bar = 500 μm (the upper right panel); Scale bar = 300 μm (the lower panel). e Light flickering at 20, 40, and 80 Hz induced an immediate (within minutes) and sustained (lasting for up to 2 h) increase in the extracellular adenosine levels in V1 during and after flickering, with 40 Hz flickering yielding the maximum increase (n = 7/group). f Quantification of light flickering-evoked adenosine signals in V1 at 20, 40, and 80 Hz (n = 7/group). g The effect of 40 Hz white light flickering with different intensities (1500–6000 lux) on extracellular adenosine levels in V1 (n = 5/group). h Quantification of light flickering-evoked adenosine signals in V1 at 1500, 3000, 4000 and 6000 lux (n = 5–8/group). i Light flickering at 10, 20, 40, and 80 Hz (50% duty cycle) produced a linear rise in calcium signals of vGluT2+ neurons in V1 when we compared the “On time” (10 s) with the “Off time”. j Quantification of light flicker producing the calcium peak at 10, 20, 40, and 80 Hz (n = 5/group). k Representative time-resolved spectrograms of the primary visual cortex (V1) during 10, 20, 40, and 80 Hz light flickering and DC stimulation. The vertical line in each plot represents the start and end of the light-flickering period. l Quantified and normalized values of power in the flickering frequency during flickering (n = 13/group). The data were analyzed using repeated measure ANOVA test followed by Turkey’s comparisons test. The data are presented as mean ± SEM or upper and lower quartile (IQR) and median (boxplot), ***P < 0.001, **P < 0.01, *P < 0.05.
Fig. 2
Fig. 2. Glutamatergic and GABAergic neurons are the primary cellular source for 40 Hz flickering-induced extracellular adenosine generation in V1.
a Schematic diagram depicting the fiber photometry recording of extracellular adenosine levels after selective ablation of total neurons in V1 using Caspase3. b Fluorescence image of V1 showing the staining of NeuN in V1 carrying AAV2/9-EF1a-flex-taCaspase3 or AAV2/9-EF1a-flex-mCherry. c Ablation of V1 neurons significantly reduced the generation of extracellular adenosine in response to 40 Hz light flickering compared to the control side. d Quantification of 40 Hz light flickering-evoked adenosine signals with Caspase3-ablated neurons in V1 compared to control mice (n = 6–7/group). e Schematic diagram depicting the strategy used to selectively ablate vGluT2+ neurons in the visual cortex using vGluT2-CRE mice coupled with AAV2/9-EF1a-flex-taCaspase3. f Fluorescence image of V1 showing the reduction of vGluT2+ neurons in V1 expressing AAV2/9-EF1a-flex-taCaspase3 compared to the cortex expressing AAV2/9-EF1a-flex-mCherry (lower panel). g Ablation of vGluT2+ neurons in V1 suppressed the generation of extracellular adenosine in response to 40 Hz flickering compared to control mice. h Quantification of 40 Hz light flickering-evoked adenosine signals between ablated and non-ablated vGluT2+ neurons in V1 (n = 6/group). i Schematic diagram depicting the strategy used to selectively ablate GABA neurons in V1 using AAV2/9-mDIX-CRE coupled with AAV2/9-EF1a-flex-taCaspase3. j Fluorescence image of V1 showing the reduction of GAD+ neurons in V1 expressing AAV2/9-EF1a-flex-taCaspase3 compared to V1 expressing AAV2/9-EF1a-flex-mCherry. k Ablation of the GAD+ neurons in V1 suppressed the generation of extracellular adenosine in response to 40 Hz flickering compared to control mice. l Quantification of 40 Hz light flickering-evoked adenosine signals between ablated and non-ablated GAD+ neurons in V1 (n = 6–7/group). m Expression of hPMCA2w/b in V1 partially reduced astrocytic activity. n Immunohistochemical images showing the co-localization of GFAP and hPMCA2w/b in V1 astrocytes. o Inhibition of astrocytic activity in V1 produced a comparable generation of extracellular adenosine in response to 40 Hz flickering compared to the control side. p Partial inhibition of astrocytic activity by hPMCA2w/b expression did not affect extracellular adenosine generation in response to 40 Hz flickering (n = 6–7/group). ***P < 0.001, **P < 0.01, *P < 0.05, Student’s t-test. The data are mean ± SEM. Scale bar = 100 μm in b, f, j, n.
Fig. 3
Fig. 3. Extracellular adenosine generation in response to 40 Hz flickering in the primary visual cortex is mediated by ENT2.
a Schematic drawing depicting the production of Adenosine (Ado) from ATP via CD73 enzymes. b Extracellular adenosine increase (as detected by GRABAdo) caused by 40 Hz light flickering in V1 of WT and CD73-KO mice. c Quantified fluorescence of GRABAdo1.0 ΔF/F0 in response to 40 Hz light flickering in CD73-KO mice (n = 6/group). d Schematic drawing depicting the release of Ado via ENTs and the pharmacological inhibition of ENTs blocking activity. e Pretreatment with dipyridamole (30 min before light flickering) abolished 40 Hz flickering-induced extracellular adenosine generation during light flickering and after stimulation cessation. f Group summary of GRABAdo1.0 ΔF/F0 in response to 40 Hz light flickering application of dipyridamole (n = 5–6/group). g Description of metabolomic screening for dipyridamole administration h Total tissue (intracellular and extracellular) adenosine levels in V1, as assessed by HPLC analysis, after 40 Hz light flickering with or without pretreatment with dipyridamole (n = 14/group). *P < 0.05, comparing the dipyridamole-treated group with the vehicle-treated group. i Schematic drawing depicting the release of Ado via ENTs and blocking ENT1 activity in ENT1-KO mice. j 40 Hz flickering induced a robust and sustained increase of the extracellular adenosine generation in both WT and ENT1-KO mice, with slightly lesser induction in ENT1-KO than WT mice at later time points. k Group summary of GRABAdo1.0 ΔF/F0 in response to 40 Hz light flickering from ENT1-KO mice (n = 5–6/group). l Schematic drawing depicting the release of Ado via ENTs and blocking ENT2 activity by ENT2-KO mice. m 40 Hz flickering-induced extracellular adenosine generation was robust and sustained in WT but largely abolished in ENT2-KO mice. n Group summary of Ado1.0 ΔF/F0 in response to 40 Hz light flickering from ENT2-KO mice (n = 6–7/group). The data are presented as mean ± SEM, **P < 0.01, *P < 0.05, Student’s t-test; WT vs KO; dipyridamole-treated group vs vehicle group.
Fig. 4
Fig. 4. The intracellular pathway of adenosine production in response to 40 Hz flickering primarily involves energy metabolism.
a Description of metabolomic screening of the V1 tissue. bg The effects of 30-min 40 Hz flickering on the intracellular metabolic changes, including major adenosine-generating, adenosine-degrading, and efflux pathways in V1 assessed 30 min after flickering cessation by the targeted UHPLC-MS/MS analysis. Adenosine (Ado, b), ATP (c), ADP (d), AMP (e), cAMP (f), and NAD+ (g). *P < 0.05 for the 40 Hz-treated vs normal light groups at 30 min; **P < 0.01 when comparing 40 Hz vs normal light groups at 240 min. h The effect of 40 Hz light flickering on the level of IMP, a main component in the salvage/de novo pathway, in V1. **P < 0.01 when comparing 40 Hz vs normal light groups at 240 min. il The effect of 40 Hz light flickering on metabolites involved in SAM-mediated transmethylation, including SAM (i), SAH (j), Hcy (k), and Met (l) in V1. *P < 0.05 when comparing 40 Hz with normal light groups at 240 min in (l), **P < 0.01 when comparing 40 Hz group at 30 min or 40 Hz group at 240 min with the groups exposed to normal light (l). mo The effect of 40 Hz light flickering on the adenosine degradation product, inosine (by UHPLC-MS/MS analysis; m) and on mRNA expression of adenosine-degrading enzymes ADK (n) and ADA (o) in V1. *P < 0.05 when comparing the 40 Hz group with the normal light group at 240 min. pr The effects of 40 Hz light flickering on the density and mRNA expression of AMPK-α1 (p) and AMPK-α2 (q) (by qPCR analysis) and on AMPK phosphorylation (by western blot analysis; r) in V1. *P < 0.05, Student’s t-test; comparing the 40 Hz group with the normal light group at 240 min after flickering cessation. s Schematic showing that 40 Hz flickering is mainly associated with the stepwise ATP dephosphorylation for energy metabolism, rather than SAM-mediated transmethylation or S-adenosylhomocysteine hydrolysis, or the salvage/de novo purine synthesis pathways.
Fig. 5
Fig. 5. Light flickering at 40 Hz induces sleep in a frequency-dependent manner.
a Paradigm of construction of light treatment and sleep recording system for mice. b Schedule for light treatments and sleep recordings. c The hypnogram, EEG spectrum, EMG, and locomotor activity in mice exposed to normal light and 40 Hz light flickering, respectively. d, f The time course of SWS and REMS in mice throughout the dark phase after exposure to normal light or 40 Hz light flickering treatment 30 min before the dark phase, respectively (n = 4/group); *P < 0.05; **P < 0.01, mean ± SEM, 40 Hz vs normal light, assessed by two-way ANOVA and Student’s t-test. e, g The amount of SWS and REMS during the initial 2 h after exposure of mice to normal light or 40 Hz light flickering 30 min before the dark phase (n = 4/group); *P < 0.05, 40 Hz vs normal light, assessed by Student’s t-test. h Superimposable power density of the wakefulness EEG spectra in mice during 30 min normal light or 40 Hz light flickering treatments (n = 4/group). i Superimposable power density of the SWS EEG spectra in mice after either normal light or 40 Hz light flickering treatments (n = 4/group). j Superimposable power density of the REMS EEG spectra in mice after either normal light or 40 Hz light flickering treatments (n = 4/group). k Representative hypnograms and EEG spectra of mice after treatments with light flickering at 20, 40, and 80 Hz, respectively. l The time course of SWS during 30 min blocks in the first 3 h after illumination at 20, 40, and 80 Hz frequencies. **P < 0.01 indicating significance at 20, 40, and 80 Hz compared to normal light using Student’s t-test (n = 9/group). m The amount of SWS during the following 2 h after exposure to normal light or 20, 40, and 80 Hz light flickering treatments 30 min before the dark phase (n = 9/group).
Fig. 6
Fig. 6. The sleep-promoting effect of 40 Hz light flickering is mediated by ENT2, but not ENT1, in mice.
a Representative hypnograms and EEG spectra of WT littermates after treatments with normal light and 40 Hz light flickering, respectively. b The time course of SWS during the entire dark phase after light flickering was recorded and analyzed in WT littermates. c The amount of SWS in the first 2 h was compared between WT littermate mice subjected to 40 Hz flickering and normal light, and statistical significance (*P < 0.05) was evaluated using Student’s t-test (n = 4). d Representative hypnograms and EEG spectra of ENT2-KO mice after treatments with normal light and 40 Hz light flickering, respectively. e The time course of SWS during the entire dark phase after light flickering was recorded and analyzed in ENT2-KO mice. f The amount of SWS in the first 2 h was compared between ENT2-KO mice subjected to 40 Hz flickering and normal light, and statistical significance (*P < 0.05) was evaluated using Student’s t-test (n = 9). g Representative hypnograms and EEG spectra of ENT1-KO mice after treatments with normal light and 40 Hz light flickering, respectively. h The time course of SWS during the entire dark phase after light flickering was recorded and analyzed in ENT1-KO mice. i The amount of SWS in the first 2 h was compared between ENT1-KO mice subjected to 40 Hz flickering and normal light, and statistical significance (*P < 0.05; **P < 0.01) was evaluated using Student’s t-test (n = 9). The time course of SWS was analyzed using two-way ANOVA, while the difference in the total sleep amount each hour was analyzed with a paired Student’s t-test. *P < 0.05 was considered significant. Data are presented as mean ± SEM.
Fig. 7
Fig. 7. 40 Hz light flickering promotes sleep via V1 adenosinergic signaling.
a, f Schematic representation of AAV2/9-hSyn-taCaspase3 injection into V1 and SC, respectively. b, g Neural ablations of V1 and SC were visualized by fluorescence staining of NeuN, respectively. Scale bar: 500 μm (b); 1 mm (g). c, h Representative hypnograms and EEG spectra of mice with V1 or SC neural ablation after treatments with normal light and 40 Hz light flickering, respectively. d, i The time course of SWS during the entire dark phase after light treatments was recorded and analyzed in V1- and SC-neuron ablated mice, respectively (**P < 0.01). e, j The amount of SWS in the first 2 h was compared in V1- and SC-neuron ablated mice subjected to 40 Hz flickering and normal light, respectively, and statistical significance (*P < 0.05; **P < 0.01) was evaluated using Student’s t-test (V1 ablated, n = 9; SC ablated, n = 8). k Schematic representation of AAV2/9-hSyn-hM4Di-P2A-mCherry injection into V1. l Spontaneous fluorescence of mCherry indicates AAV expression in V1. Scale bar: 500 μm. m Representative hypnograms and EEG spectra of mice after intraperitoneal injections with the vehicle and CNO 3 mg/kg, respectively. n The time course of SWS during the entire dark phase after vehicle and CNO injections was recorded and analyzed (*P < 0.05; **P < 0.01). o The amount of SWS in the first 2 h was compared in mice injected with vehicle, CNO 1 mg/kg and 3 mg/kg, respectively, and statistical significance (**P < 0.01) was evaluated using one-way ANOVA (n = 7). p Schematic representation of focal injection of adenosine into V1. q Spontaneous fluorescence of fluorescein sodium at 1 h after focal injection into V1 indicates diffusion area of water-soluble substances. Scale bar: 500 μm. r Representative hypnograms and EEG spectra of mice after bilateral focal injections of ACSF and adenosine at 4.5 nmol/side, respectively. s The time course of SWS during the entire dark phase after bilateral focal injections of ACSF and adenosine was recorded and analyzed. t The amount of SWS in the first 3 h was compared mice with bilateral focal injections of ACSF, adenosine at 1.5 nmol/side and 4.5 nmol/side into V1, respectively, and statistical significance (*P < 0.05; **P < 0.01) was evaluated using one-way ANOVA (n = 8).
Fig. 8
Fig. 8. 40 Hz light flickering improves sleep onset and maintenance among children with insomnia.
a Schematic figure for 40 Hz flickering stimulation. b Illustrations of the study design, in which patients were enrolled for two consecutive days: day 1 served as a baseline; day 2 involved 30 min of 40 Hz flickering stimulation before sleep. c 40 Hz flickering significantly reduced SOL (W = –767, P < 0.001). d 40 Hz flickering significantly increased TST (W = 905, P < 0.001). e SE was also improved by 40 Hz flickering (W = 1055, P < 0.001). f WASO was remarkably reduced by 40 Hz flickering stimulation (W = –924, P < 0.001). g AF remained unchanged (t(48) = 1.649, P = 0.106) after 40 Hz flickering stimulation. h REM SOL was also reduced by 40 Hz flickering (t(48) = 4.521, P < 0.001). i, j The percentage of light (i) and deep sleep (j) remained unchanged (W = –322, P = 0.100; t(48) = 0.510, P = 0.612). k An increase in REMS percentage was detected (W = 447, P = 0.025) after 40 Hz flickering stimulation. A paired t-test or Wilcoxon matched-pairs signed rank test was conducted based on the distribution types of the paired difference. N1 + N2, light sleep; N3, deep sleep. *P < 0.05, **P < 0.01, ***P < 0.001; Data are presented as mean ± SEM or median (lower quartiles–upper quartiles).

References

    1. Fernandez DC, et al. Light affects mood and learning through distinct retina-brain pathways. Cell. 2018;175:71–84.e18. doi: 10.1016/j.cell.2018.08.004. - DOI - PMC - PubMed
    1. Huang L, et al. A visual circuit related to Habenula underlies the antidepressive effects of light therapy. Neuron. 2019;102:128–142.e8. doi: 10.1016/j.neuron.2019.01.037. - DOI - PubMed
    1. Videnovic A, et al. Timed light therapy for sleep and daytime sleepiness associated with Parkinson disease: a randomized clinical trial. JAMA Neurol. 2017;74:411–418. doi: 10.1001/jamaneurol.2016.5192. - DOI - PMC - PubMed
    1. Iaccarino HF, et al. Gamma frequency entrainment attenuates amyloid load and modifies microglia. Nature. 2016;540:230–235. doi: 10.1038/nature20587. - DOI - PMC - PubMed
    1. Adaikkan C, et al. Gamma entrainment binds higher-order brain regions and offers neuroprotection. Neuron. 2019;102:929–943.e8. doi: 10.1016/j.neuron.2019.04.011. - DOI - PMC - PubMed

Publication types