. 2024 Mar;16(3):641-663.
doi: 10.1038/s44321-024-00028-y. Epub 2024 Feb 8.

Crosstalk between CD64+MHCII+ macrophages and CD4+ T cells drives joint pathology during chikungunya

Affiliations

Crosstalk between CD64+MHCII+ macrophages and CD4+ T cells drives joint pathology during chikungunya

Fok-Moon Lum et al. EMBO Mol Med. 2024 Mar.

Abstract

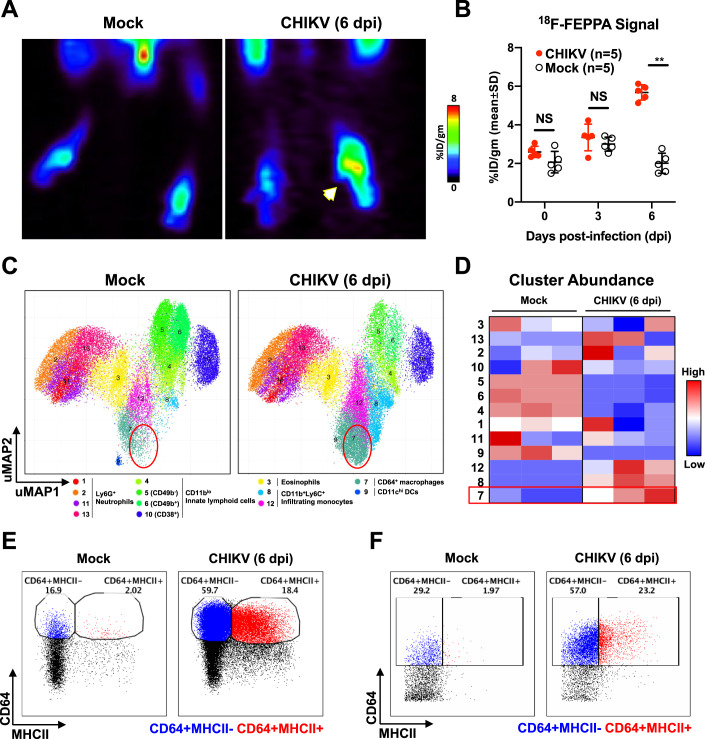
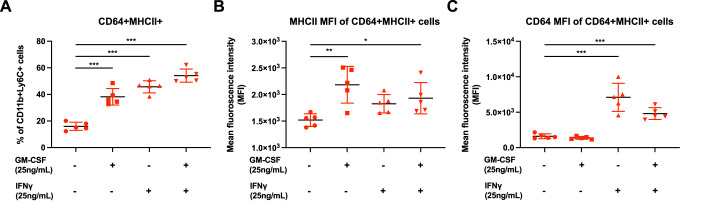
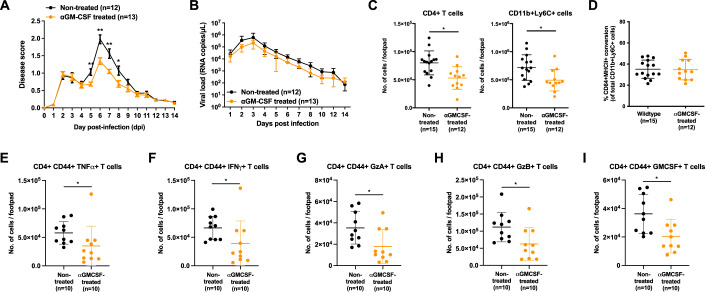
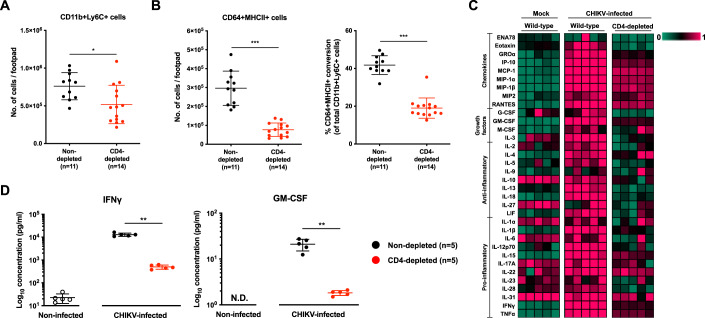
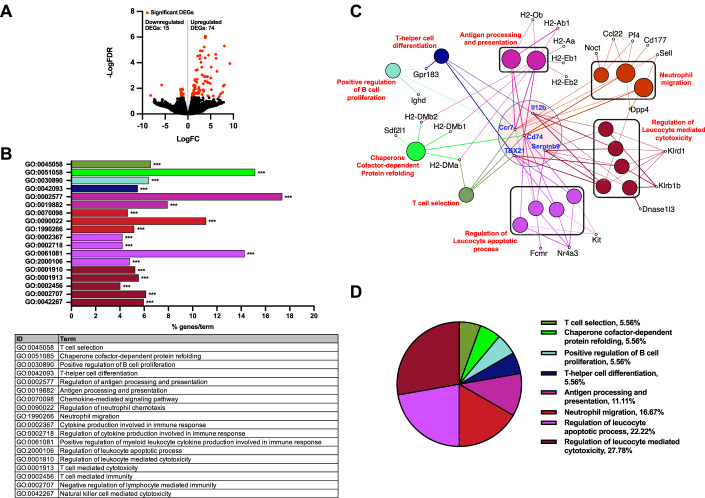
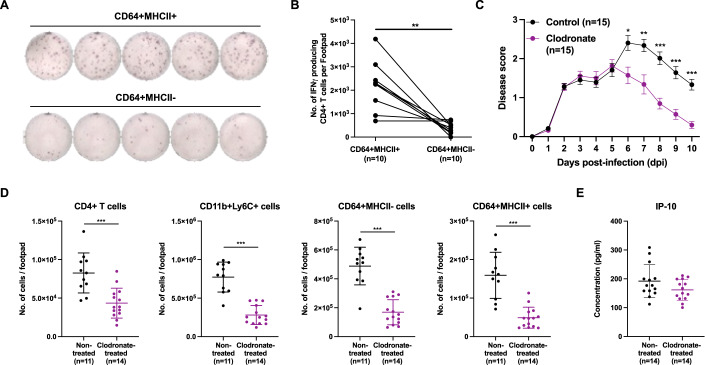
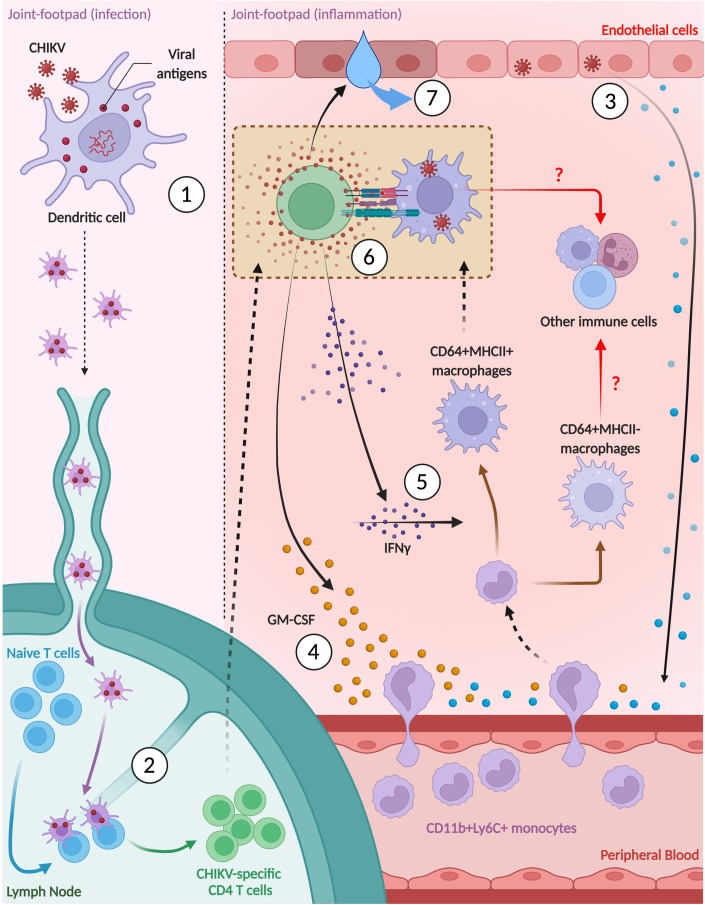
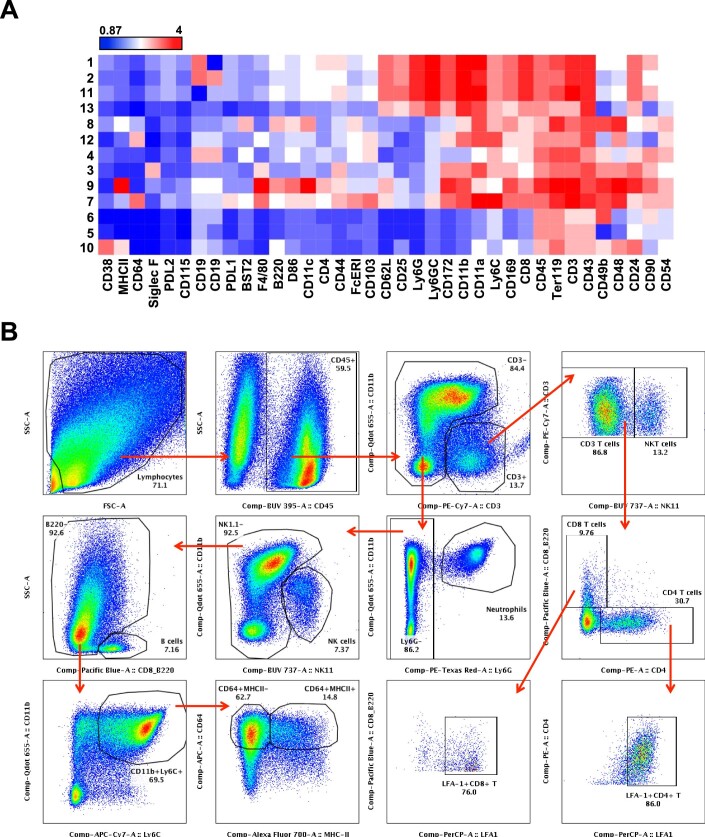
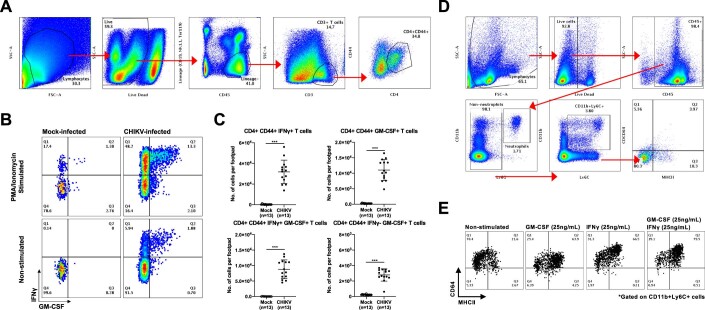
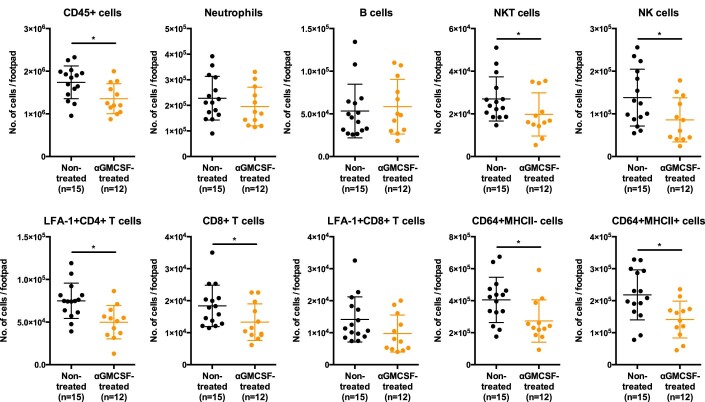
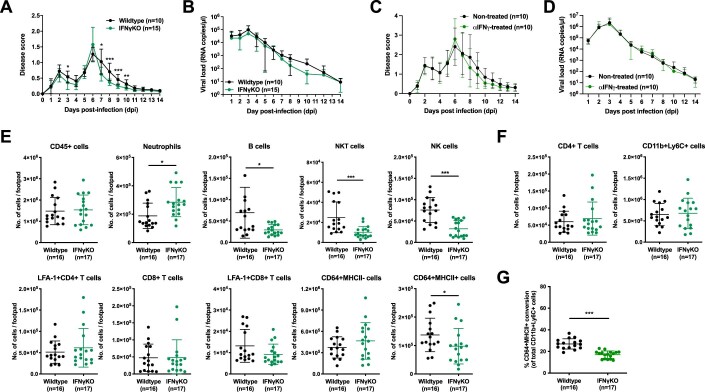
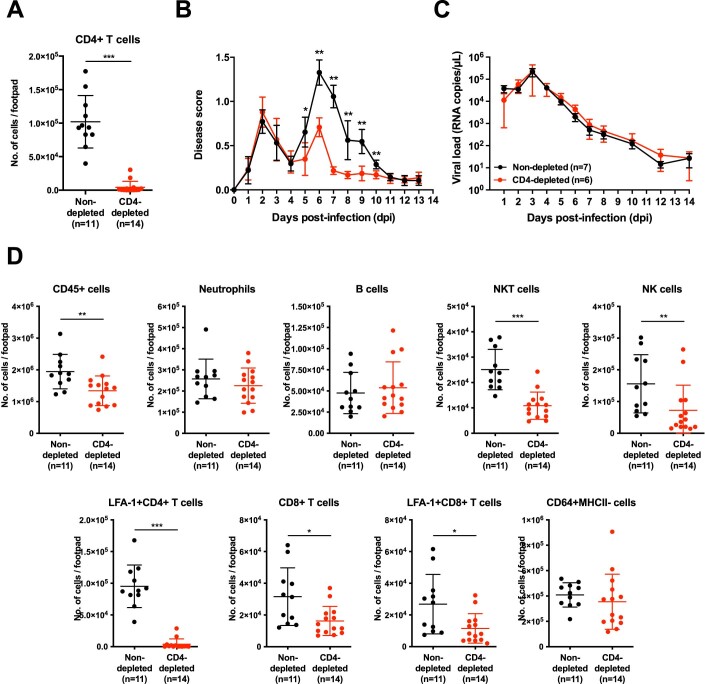
Communications between immune cells are essential to ensure appropriate coordination of their activities. Here, we observed the infiltration of activated macrophages into the joint-footpads of chikungunya virus (CHIKV)-infected animals. Large numbers of CD64+MHCII+ and CD64+MHCII- macrophages were present in the joint-footpad, preceded by the recruitment of their CD11b+Ly6C+ inflammatory monocyte precursors. Recruitment and differentiation of these myeloid subsets were dependent on CD4+ T cells and GM-CSF. Transcriptomic and gene ontology analyses of CD64+MHCII+ and CD64+MHCII- macrophages revealed 89 differentially expressed genes, including genes involved in T cell proliferation and differentiation pathways. Depletion of phagocytes, including CD64+MHCII+ macrophages, from CHIKV-infected mice reduced disease pathology, demonstrating that these cells play a pro-inflammatory role in CHIKV infection. Together, these results highlight the synergistic dynamics of immune cell crosstalk in driving CHIKV immunopathogenesis. This study provides new insights in the disease mechanism and offers opportunities for development of novel anti-CHIKV therapeutics.

Keywords: Chikungunya; GM-CSF; Immune Crosstalk; Immunopathogenesis.


Figures

Figure 1
Figure 1. Upregulation of CD64+ macrophages during CHIKV infection identified by high-dimensional analysis of mass cytometry data.
(A) Representative PET/CT images of mock-infected and CHIKV-infected joints at 6 days post-infection (dpi) following intravenous injection of 18F-FEPPA radioligand to track infiltration of activated macrophages. Amount of [18F]FEPPA uptake was measured in the paw area and represented as a percentage of the administered dose per gram of tissue in the ROI (%ID/gm). White arrow indicates CHIKV-infected joint. (B) Radioactive signal from mock and CHIKV-infected joint-footpads was quantified. Data were from biological replicates and presented as mean ± SD. Statistical analysis was performed using non-parametric Mann–Whitney U test (two-tailed; **P = 0.0079). (C,D) Joint-footpad cells from CHIKV-infected and non-infected animals (n = 3 per group) were harvested at 6 dpi and stained with a panel of antibodies targeting myeloid cell surface markers. Acquisition was performed with CyTOF and data were analyzed with dimension reduction technique Uniform Manifold Approximation and Projection (UMAP). Superimposed PhenoGraphs of UMAP transformed CyTOF data from mock and CHIKV-infected joints. Presence of cluster 7 as enclosed by red circle (C). Cluster ID annotation with heatmap. Cluster IDs are indicated in rows, while groups are indicated in the columns. The color represents the Z-score transformed median number of cells in the clusters, which are grouped in phenotypic proximity based on surface marker similarities. Red rectangle highlights the difference of cluster 7 between CHIKV and mock-infected joints (D). (E,F) Manual gating of CD64+MHCII- (blue) and CD64+MHCII+ (red) macrophages on live CD45+CD11b+Ly6C+Ly6G- monocytes using data obtained from either fluorescence-based flow cytometry (E) or CyTOF (F). Source data are available online for this figure.
Figure 2
Figure 2. Stimulation of peripheral whole blood with GM-CSF and/or IFNγ promotes the differentiation of CD64+MHCII- into CD64+MHCII+ macrophages.
(A) Peripheral whole blood was obtained from non-infected animals (n = 5) and were subjected to GM-CSF and IFNγ stimulation after removal of the red blood cells. Stimulated cells were harvested 24 h later and stained for the identification of monocytes and macrophage subsets. Graphs illustrating the differentiation percentage of CD11b + Ly6C+ cells into CD64+MHCII+ macrophages. Data were from biological replicates and presented as mean ± SD. Data comparisons between the various groups were performed with one-way ANOVA with Dunnett’s post test comparing against the control untreated group. Untreated vs GM-CSF, ***mean diff = −22.19; untreated vs IFNγ, ***mean diff = −29.74; untreated vs GM-CSF + IFNγ, ***mean diff = −38.13. (B,C) Plots showing the mean fluorescence intensity (MFI) of MHCII (B) and CD64 (C) staining on the CD64+MHCII+ macrophages. Data were from biological replicate and presented as mean ± SD. Data comparisons between the various groups were performed with one-way ANOVA with Dunnett’s post test comparing against the control untreated group. For MHCII MFI, untreated vs GM-CSF, **mean diff = −664.2; untreated vs GM-CSF + IFNγ, *mean diff = −411.2. For CD64 MFI, untreated vs IFNγ, ***mean diff = −5490; untreated vs GM-CSF + IFNγ, ***mean diff = −3201. Source data are available online for this figure.
Figure 3
Figure 3. depletion of GM-CSF reduces the severity of CHIKV infection.
(A,B) Wild-type mice were infected with 1 × 10⁶ PFU of CHIKV in the right footpad and subsequently treated with anti-GM-CSF antibodies at 4 dpi. Joint-footpad swelling (A) and viral RNA load (B) were monitored over 14 days. Data were from biological replicates obtained from two independent experiments. All data are presented as mean ± SD. Data comparisons were performed with non-parametric Mann–Whitney U test (two-tailed). For footpad swelling: 5 dpi, **P = 0.0064; 6 dpi, **P = 0.0011; 7 dpi, **P = 0.0068; 8 dpi, *P = 0.0372. (C,D) Immunophenotyping of joint-footpad from anti-GM-CSF treated mice was performed at 6 days post-infection to determine the numbers of infiltrating CD4+ T cells and CD11b+Ly6C+ monocytes (C). Percentage differentiation of CD11b+Ly6C+ monocytes into CD64+MHCII+ macrophages in non-treated or GM-CSF-depleted CHIKV-infected animals is shown (D). Data were from biological replicates obtained from two independent experiments. All data are presented as mean ± SD. Data comparisons were performed with non-parametric Mann–Whitney U test (two-tailed). CD4+ T cells, *P = 0.037; CD11b+Ly6C+, *P = 0.0161. (EI) In a separate set of experiment, CHIKV infection was performed and treated with anti-GM-CSF antibodies at 4 dpi. At 6 dpi, numbers of TNFα- (E), IFNγ- (F), Granzyme A- (G), Granzyme B- (H), and GM-CSF- (I) producing CD4+CD44+ T cells were in the joint-footpad were quantified following stimulation with ionomycin and phorbol myristate acetate (PMA). Data were from biological replicates obtained from two independent experiments. All data are presented as mean ± SD. Data comparisons between the groups were performed with non-parametric Mann–Whitney U test (two-tailed). TNFα-producing, *P = 0.0175; IFNγ-producing, *P = 0.0138, Granzyme A-producing, *P = 0.0176, Granzyme B-producing, *P = 0.0175, GMCSF-producing, *P = 0.0138. Source data are available online for this figure.
Figure 4
Figure 4. CD4+ T cells depletion alters levels of critical immune mediators in the CHIKV-infected joint-footpad.
(A,B) Wild-type animals were infected with 1 × 10⁶ PFU of CHIKV in the right footpad, and anti-CD4 antibodies were given intraperitoneally at -1 and 4 days post-infection (dpi). Immunophenotyping was performed at 6 dpi to determine the numbers of infiltrating CD11b+Ly6C+ monocytes in CD4-depleted joint-footpads (A). Percentage differentiation of CD11b+Ly6C+ monocytes into CD64+MHCII- and CD64+MHCII+ macrophages and absolute counts of CD64+MHCII+ macrophages in CHIKV-infected non-CD4-depleted or CD4-depleted animals (B). Data presented were from biological replicates obtained from two independent experiments and presented as mean ± SD. Data comparisons between the groups were performed with non-parametric Mann–Whitney U test (two-tailed). For CD1b+Ly6C+ (A), *P = 0.0152; For CD64+MHCII+ (B), *P = 0.000000449; for CD64+MHCII+ conversion (B), ***P = 0.000000897. (C,D) Joint lysates were obtained from CHIKV-infected CD4-depleted, infected wild-type (non-CD4-depleted) mice, and mock-infected control mice at peak chikungunya joint pathology (6 dpi). A multiplex microbead-based assay was used to quantify the levels of immune mediators present in these samples. Heatmap showing the levels of the analyzed immune mediators in each group of animals (C). Dot plots showing the absolute quantities of IFNγ and GM-CSF, highlighting the significant differences between the various groups of animals (D). Data were from biological replicates and presented as mean ± SD. Data comparisons between the groups were performed with non-parametric Mann–Whitney U test (two-tailed). IFNγ, **P = 0.0079; GMCSF, **P = 0.0079. Source data are available online for this figure.
Figure 5
Figure 5. RNA-seq analyses of CD64+MHCII+ and CD64+MHCII- macrophages reveal differentially expressed genes that influence multiple immunological aspects.
(A) CD64+MHCII+ and CD64+MHCII- macrophages were sorted from CHIKV-infected joints (n = 5 animals per group) at 6 dpi and processed for RNA-seq. A total of 89 DEGs were identified. (B) Representative gene ontology terms and pathways are depicted, including genes involved in Th1 and Th2 differentiation as well as antigen processing and presentation. Analysis was carried out with a two-sided hypergeometric test, corrected with Bonferroni stepdown. ***P = < 0.001 (refer to Dataset EV1 for exact P values). (C) Gene ontology terms are presented as nodes and clustered together based on the similarity of genes present in each term or pathway. Ccr7, Cd74, Il12b, TBX21, and Serpinb9 are identified as genes highly associated with many of these terms. (D) A functionally grouped network of enriched pathways or terms based on the 89 DEGs were generated by querying the Gene Ontology - biological database with ClueGo. Source data are available online for this figure.
Figure 6
Figure 6. Crosstalk between CD64+MHCII+ macrophages and CD4+ T cells drive CHIKV pathogenesis.
(A,B) CD64+MHCII+ and CD64+MHCII- macrophages were sorted and CHIKV-specific CD4+ T cells were isolated from joint-footpad of CHIKV-infected animals at 6 dpi. CHIKV-specific CD4+ T cells were subsequently restimulated with CHIKV antigen in the presence of either CD64+MHCII+ or CD64+MHCII- macrophages for 18 h. Representative ELISpot images from 5 animals per group are shown (A). Paired line graph showing the numbers of IFNγ-producing CHIKV-specific CD4+ T cells post-re-stimulation (B). Data were from biological replicates obtained from two independent experiments and comparison was performed with non-parametric Wilcoxon matched-pairs signed rank test (two-tailed; **P = 0.0078). (C) Wild-type animals were infected with 1 × 10⁶ PFU of CHIKV in the right footpad. At 5 dpi, animals were given intraperitoneally with either clodronate liposome (1 mg) or empty liposome (control). Joint-footpad swelling of these animals were monitored over a period of 10 days. Data were from biological replicates obtained from two independent experiments and presented as mean ± SD. Data comparison between groups was performed with non-parametric Mann–Whitney U test (two-tailed). 6 dpi, *P = 0.0102; 7 dpi, **P = 0.0051; 8 dpi, ***P = 0.0000551; 9 dpi, ***P = 0.0000535; 10 dpi, ***P = 0.00000135. (D,E) Wild-type animals were infected with 1 × 10⁶ PFU of CHIKV in the right footpad. At 5 dpi, animals were given intraperitoneally with either clodronate liposome (1 mg) or empty liposome (control). Immunophenotyping was performed at 6 dpi for both groups of animals. Graphs show the numbers of CD4+ T cells, CD11b+Ly6C+ precursor cells, CD64+MHCII- and CD64+MHCII+ macrophages present in the joint-footpad (D). Levels of IP-10 present in joint-footpad was quantified at 6 dpi from another set of animals (E). Data were from biological replicates obtained from two independent experiments and presented as mean ± SD. Data comparisons between the groups were performed with non-parametric Mann–Whitney U test (two-tailed). CD4+ T, ***P = 0.0005; CD11b+Ly6C+, ***P = 0.00000538; CD64+MHCII-, ***P = 0.00000538; CD64+MHCII+, ***P = 0.00000853. Source data are available online for this figure.
Figure 7
Figure 7. Crosstalk between CD64+MHCII+ macrophages and CD4+ T cells drive CHIKV pathogenesis.
Following active CHIKV infection, (1) viral antigens are first up taken by residential dendritic cells which then travel to the draining lymph nodes. (2) Here, CD4+ T cells are being primed and activated. (3) Initial release of chemokines by CHIKV-infected non-immune cells (e.g., endothelial and fibroblastic cells) subsequently lead to (4) recruitment of CD4+ T cells and CD11b+Ly6C+ inflammatory monocytes along chemokine gradients. Recruited CD4+ T cells further participate in recruitment of CD11b+Ly6C+ inflammatory monocytes through secretion of GM-CSF. In addition, (5) IFNγ secreted by CD4+ T cells aid in the activation and differentiation of infiltrated CD11b+Ly6C+ inflammatory monocytes into CD64+MHCII+ macrophages. (6) CD64+MHCII+ macrophages reciprocally interact and activate with CD4+ T cells by acting as antigen-presenting cells. (7) Eventually, activated CD4+ T cells cause CHIKV-induced joint-footpad pathology (e.g., edema) through secretion of numerous pathogenic mediators (e.g., TNFα, Granzyme-A or Granzyme-B). Source data are available online for this figure.
Figure EV1
Figure EV1. High-dimensional analysis of mass cytometry data and Immunophenotyping gating strategy.
(A) Cluster ID annotation with heatmap. Cluster IDs are indicated in rows, while surface marker expression levels are indicated by the columns. The color represents the relative mean signal intensity of a surface marker. Blue and red represent low and high intensity, respectively. (B) Cellular infiltrates in the CHIKV-infected joint-footpad at 6 days post-infection (dpi) were determined with flow cytometry. Brieftly, live CD45+ immune cells were gated out before the CD3+ (inclusive of CD4+ and CD8+) T cells, CD3+NK1.1+ NKT cells, CD11b+Ly6G+ neutrophils, NK1.1+ NK cells, CD11b+Ly6C+ monocytes and CD64+ macrophages were identified. Plots shown are representative of a single CHIKV-infected mouse.
Figure EV2
Figure EV2. Intracellular staining reveals presence of IFNγ- and GM-CSF-producing CD4+CD44+ T cells during CHIKV infection.
(A) Joint-footpad cells from non-infected and CHIKV-infected animals were harvested at 6 dpi and were subjected to stimulation with ionomycin and Phorbol Myristate Acetate (PMA) for 4 h. Stimulated cells were subsequently stained for the presence of GM-CSF and IFNγ in CD4+CD44+ memory/effector T cells. Representative electronic gating strategy to isolate CD4+CD44+ T cells from joint-footpad cells. Plots shown are concatenated from CHIKV-infected samples. (B) Representative flow cytometry plot illustrating the gating strategy in the identification of GM-CSF and IFNγ within the CD4+CD44+ T cells. (C) Dotplots showing the numbers of the various identified subsets within the joint-footpads. Data were from biological replicates obtained from two independent experiments. All data are presented as mean ± SD. Data comparisons between the groups were performed with non-parametric Mann–Whitney U test (two-tailed). IFNγ+ T cells, ***P = 0.0000000499; GM-CSF+ T cells, ***P = 0.0000000499; IFNγ+GM-CSF+ T cells, ***P = 0.0000000499; IFNγ-GM-CSF+ T cells, ***P = 0.0000000499. (D) Fresh blood was obtained from non-infected animals. Red blood cells were subsequently lysed and live cells were stained with a commercially available live/dead dye before being stained with a cocktail of antibodies targeting surface markers CD45, CD11b, Ly6G, Ly6C, CD64, and MHCII. Live CD45+ cells were firstly identified, and non-neutrophils were gated next. CD11b+Ly6C+ monocytes were identified from the non-neutrophils and were shown to be low in CD64 and MHCII expression (Q4). Plots shown are representative of a single non-infected mouse. (E) Peripheral whole blood was obtained from non-infected animals and were subjected to GM-CSF and IFNγ stimulation after removal of the red blood cells. Stimulated cells were harvested 24 h later and stained for the identification of monocytes and macrophage subsets. Representative flow cytometry plots showing the gating strategy used to identify CD64+MHCII+ cells among the precursor CD11b+Ly6C+ monocytes.
Figure EV3
Figure EV3. Depletion of GM-CSF alters the numbers of immune cells infiltrating the joint-footpad.
CHIKV infection (1 × 106 PFU) was performed in the right footpad of wild-type animals. Four days post-infection (dpi), anti-GM-CSF antibodies were given intraperitoneally. Subsequently, numbers of infiltrating CD45+ cells, neutrophils, B cells, NKT cells. NK cells, LFA-1+CD4+ T cells, CD8+ T cells, LFA-1+CD4+ T cells, CD11b+Ly6C+ cells, CD64+MHCII- cells and CD64+MHCII+ cells were obtained following immunophenotyping of the joint-footpad at 6 days post-infection (dpi). Data were from biological replicates obtained from two independent experiments. All data are presented as mean ± SD. Data comparisons between the groups were performed with non-parametric Mann–Whitney U test (two-tailed): CD45 + , *P = 0.0139; NKT, *P = 0.0469; NK, *P = 0.0214; LFA-1+CD4+ T, *P = 0.031; CD8+ T, *P = 0.0281; CD64+MHCII-, *P = 0.0186; CD64+MHCI+, *P = 0.0161.
Figure EV4
Figure EV4. Absence of IFNγ alters the conversion of CD64+MHCII+ macrophages in the joint-footpad.
(A,B) IFNγKO animals were infected with 1 × 10⁶ PFU of CHIKV in the right footpad. Joint-footpad swelling (A) and viral RNA load (B) were monitored over 14 days. Data were from biological replicates obtained from two independent experiments and presented as mean ± SD. Comparisons between the groups were performed with non-parametric Mann–Whitney U test (two-tailed). For footpad swelling: 3 dpi, *P = 0.0395; 7 dpi, *P = 0.0216; 8 dpi, ***P = 0.00000214; 9 dpi, ***P = 0.0003; 10 dpi, **P = 0.0051. (C,D) Wild-type animals were infected with 1 × 10⁶ PFU of CHIKV in the right footpad and were treated with anti-IFNγ antibodies at 0-, 2- and 4-days post-infection (dpi). Joint-footpad swelling (C) and viral RNA load (D) were monitored over 14 days. Data were from biological replicates obtained from two independent experiments and presented as mean ± SD. (EG) Immunophenotyping of IFNγKO joint-footpad was performed at 6 dpi to determine the numbers of infiltrating CD45+ cells, neutrophils, B cells, NKT cells. NK cells, LFA-1+CD4+ T cells, CD8+ T cells, LFA-1+CD8+ T cells, CD64+MHCII- cells and CD64+MHCII+ cells (E). Numbers of joint-footpad infiltrating CD4+ T cells and CD11b+Ly6C+ monocytes are depicted (F). Percentage differentiation of CD11b+Ly6C+ monocytes into CD64+MHCII+ macrophages in CHIKV-infected wild type or IFNγKO animals is shown (G). Data were from biological replicates obtained from two independent experiments and presented as mean ± SD. Comparisons between the groups were performed with non-parametric Mann–Whitney U test (two-tailed). For neutrophils, *P = 0.0136; B cells, *P = 0.0136; NKT, ***P = 0.0002; NK, ***P = 0.0001; CD64+MHCII+, *P = 0.0207; for % CD64+MHCII+ conversion (G), ***P = 0.000000105.
Figure EV5
Figure EV5. CD4-depletion reduces CHIKV disease severity.
(A) Wild-type animals were infected with 1 × 10⁶ PFU of CHIKV in the right footpad and anti-CD4 antibodies were given intraperitoneally at -1 and 4 days post-infection (dpi). Immunophenotyping of joint-footpad was performed at 6 dpi to determine the numbers of infiltrating CD4+ T cells. Data were from biological replicates obtained from two independent experiments and presented as mean ± SD. Data comparisons between the groups were performed with non-parametric Mann–Whitney U test (two-tailed). CD4+ T cells, ***P = 0.000000449. (B,C) Joint-footpad swelling (B) and viral RNA load (C) of CHIKV-infected animals with or without administration of anti-CD4 antibodies, over a period of 14 days. Data were from biological replicates obtained from two independent experiments and presented as mean ± SD. Data comparisons between the groups were performed with non-parametric Mann–Whitney U test (two-tailed). For footpad swelling: 5 dpi, *P = 0.0192; 6 dpi, **P = 0.0012; 7 dpi, **P = 0.0012; 8 dpi, **P = 0.0012; 9 dpi, **P = 0.0012; 10 dpi, **P = 0.0023. (D) Numbers of infiltrating CD45+ cells, neutrophils, B cells, NKT cells. NK cells, LFA-1+CD4+ T cells, CD8+ T cells, LFA-1+CD4+ T cells, CD11b+Ly6C+ cells and CD64+MHCII- cells were determined following immunophenotyping of the joint-footpad at 6 dpi (A). Data were from biological replicates obtained from two independent experiments and presented as mean ± SD. Data comparisons between the groups were performed with non-parametric Mann–Whitney U test (two-tailed). CD45+, **P = 0.0042; NKT, ***P = 0.0000306; NK, **P = 0.0075; LFA-1+CD4+ T, ***P = 0.000000449; CD8+, *P = 0.0108; LFA-1+CD8+ T, *P = 0.0179.

References

    1. Achuthan A, Cook AD, Lee MC, Saleh R, Khiew HW, Chang MW, Louis C, Fleetwood AJ, Lacey DC, Christensen AD, et al. Granulocyte macrophage colony-stimulating factor induces CCL17 production via IRF4 to mediate inflammation. J Clin Invest. 2016;126:3453–3466. - PMC - PubMed
    1. Amorim A, De Feo D, Friebel E, Ingelfinger F, Anderfuhren CD, Krishnarajah S, Andreadou M, Welsh CA, Liu Z, Ginhoux F, et al. IFNgamma and GM-CSF control complementary differentiation programs in the monocyte-to-phagocyte transition during neuroinflammation. Nat Immunol. 2022;23:217–228. - PubMed
    1. Bartok B, Firestein GS. Fibroblast-like synoviocytes: key effector cells in rheumatoid arthritis. Immunol Rev. 2010;233:233–255. - PMC - PubMed
    1. Becher B, Schlitzer A, Chen J, Mair F, Sumatoh HR, Teng KW, Low D, Ruedl C, Riccardi-Castagnoli P, Poidinger M, et al. High-dimensional analysis of the murine myeloid cell system. Nat Immunol. 2014;15:1181–1189. - PubMed
    1. Becher B, Tugues S, Greter M. GM-CSF: from growth factor to central mediator of tissue inflammation. Immunity. 2016;45:963–973. - PubMed