. 2024 Feb 8;14(1):2760.
doi: 10.1038/s41598-024-52404-w.

Comparative oncology chemosensitivity assay for personalized medicine using low-coherence digital holography of dynamic light scattering from cancer biopsies

Affiliations

Comparative oncology chemosensitivity assay for personalized medicine using low-coherence digital holography of dynamic light scattering from cancer biopsies

Zhen Hua et al. Sci Rep. .

Abstract

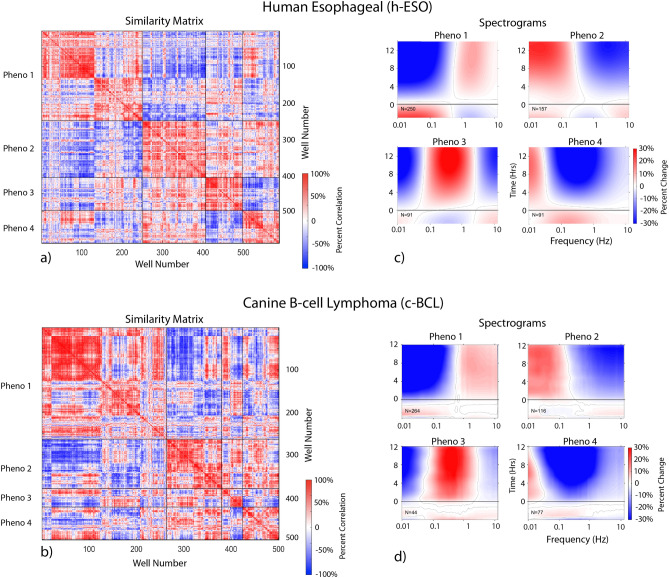
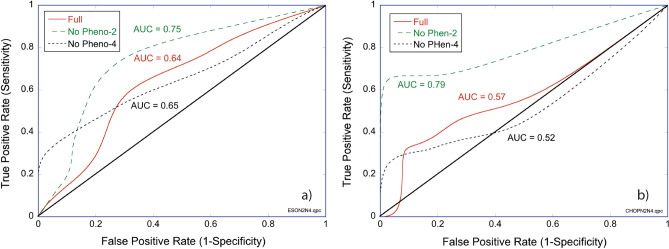
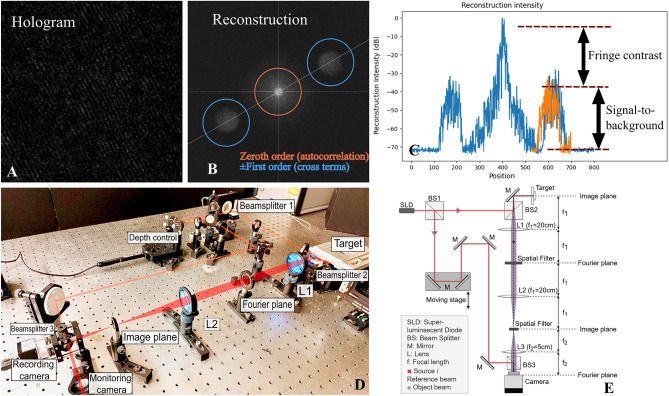
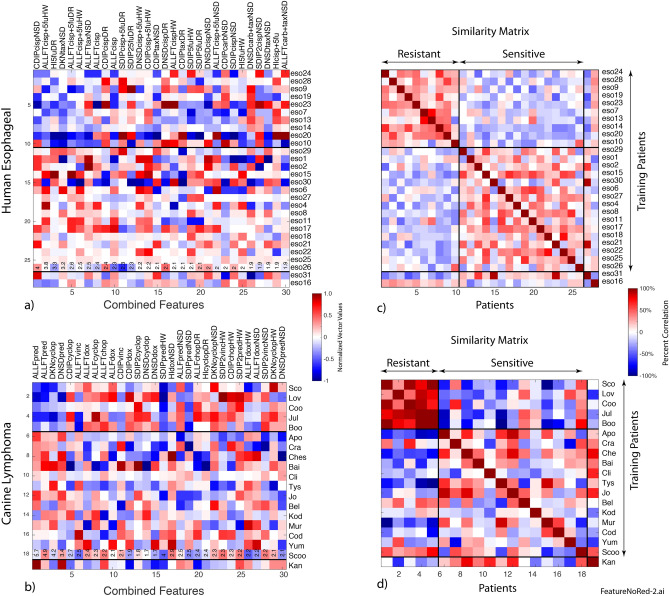
Nearly half of cancer patients who receive standard-of-care treatments fail to respond to their first-line chemotherapy, demonstrating the pressing need for improved methods to select personalized cancer therapies. Low-coherence digital holography has the potential to fill this need by performing dynamic contrast OCT on living cancer biopsies treated ex vivo with anti-cancer therapeutics. Fluctuation spectroscopy of dynamic light scattering under conditions of holographic phase stability captures ultra-low Doppler frequency shifts down to 10 mHz caused by light scattering from intracellular motions. In the comparative preclinical/clinical trials presented here, a two-species (human and canine) and two-cancer (esophageal carcinoma and B-cell lymphoma) analysis of spectral phenotypes identifies a set of drug response characteristics that span species and cancer type. Spatial heterogeneity across a centimeter-scale patient biopsy sample is assessed by measuring multiple millimeter-scale sub-samples. Improved predictive performance is achieved for chemoresistance profiling by identifying red-shifted sub-samples that may indicate impaired metabolism and removing them from the prediction analysis. These results show potential for using biodynamic imaging for personalized selection of cancer therapy.


Conflict of interest statement

David Nolte and John Turek have a financial interest in Animated Dynamics Inc. which is commercializing biodynamic imaging for personalized cancer therapy selection. Zhen Hua, Zhe Li, Dawith Lim, Ali Ajrouch, Ahmad Karkash, Shadia Jalal and Michael Childress declare no potential conflict of interest.

Figures

Figure 1
Figure 1
Well-based drug-responses for the human esophageal cancer and canine lymphoma clinical trial. Similarity matrix (a) and (b) calculated as the correlation between well-based feature vectors from all wells after unsupervised hierarchical clustering by phenotype. Averaged spectrograms D(ω,t) in (c) and (d) of the four phenotypes. In this nomenclature, phenotype-1 is blue shifted, phenotype-2 is redshifted, phenotype-3 is mid-frequency enhanced, and phenotype-4 is mid-frequency suppressed.
Figure 2
Figure 2
ROC curves when using all wells (Full), when excluding redshifted wells (No Pheno-2), and when excluding mid-frequency enhanced wells (No PHeno-4) during double-hold-out cross-validation of patient predictions. Performance improves when the redshifted wells are removed. (a) h-ESO: Full AUC = 0.64, No-Pheno-2 AUC = 0.75, and No-Pheno-4 AUC = 0.65. (b) c-BCL: Full AUC = 0.57, No-Pheno-2 AUC = 0.79, and No-Pheno-4 AUC = 0.52.
Figure 3
Figure 3
Prevalence of biodynamic features and drugs in the patient prediction for h-ESO and c-BCL. (The features are color-coded for ease of reading.) The preconditions NSD, DR and HW are used in bilinear features as well as linear and are hence highly prevalent. The most important feature is ALLFT which measures broad spectral response with linear time dependence.
Figure 4
Figure 4
Biodynamic imaging with digital holography. (A) Raw hologram zoomed in to show fringes. (B) Reconstructed image-domain with phase-conjugate sidebands. (C) Sample reflectance through the zero-order and the sidebands (red curve is in the transverse direction). (D) Optical configuration with a short-coherence light source and a Mach–Zehnder setup and the hologram captured on the Fourier plane. (E) Optical schematic of the layout in (D).
Figure 5
Figure 5
Selected biomarkers (a) and (b) for each patient in each study including linear and bilinear biomarkers. The similarity matrixes (c) and (d) are the inner product of the biomarker vectors. The few patients at the bottom were permanently held out of the training because they displayed strong non-representative phenotypes.

Similar articles

Cited by

References

    1. Maldonado EB, et al. Estimation of US patients with cancer who may respond to cytotoxic chemotherapy. Future Sci. Oa. 2020;6(8):FSO600. doi: 10.2144/fsoa-2020-0024. - DOI - PMC - PubMed
    1. Gerlinger M, et al. Intratumor heterogeneity and branched evolution revealed by multiregion sequencing. N. Engl. J. Med. 2012;366(10):883–892. doi: 10.1056/NEJMoa1113205. - DOI - PMC - PubMed
    1. Cirkel GA, et al. Tumor heterogeneity and personalized cancer medicine: are we being outnumbered? Future Oncol. 2014;10(3):417–428. doi: 10.2217/fon.13.214. - DOI - PubMed
    1. Caie PD, et al. High-content phenotypic profiling of drug response signatures across distinct cancer cells. Mol. Cancer Ther. 2010;9(6):1913–1926. doi: 10.1158/1535-7163.MCT-09-1148. - DOI - PubMed
    1. Seol HS, et al. A patient-derived xenograft mouse model generated from primary cultured cells recapitulates patient tumors phenotypically and genetically. J. Cancer Res. Clin. Oncol. 2013;139(9):1471–1480. doi: 10.1007/s00432-013-1449-6. - DOI - PMC - PubMed