. 2024 Feb 8;14(1):3293.
doi: 10.1038/s41598-024-53068-2.

Identification of Maya ruins covered by jungle using Sentinel-1

Affiliations

Identification of Maya ruins covered by jungle using Sentinel-1

Florent Michenot et al. Sci Rep. .

Abstract

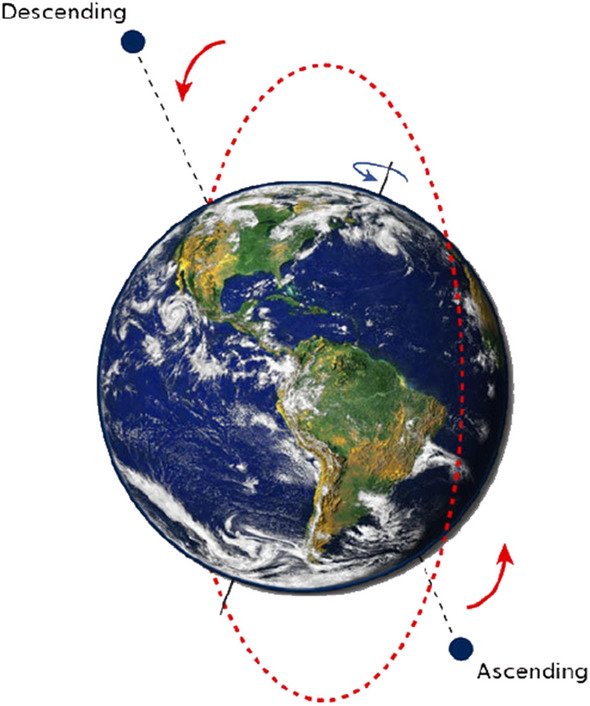
Archaeologists commonly use airborne LIDAR technology to produce 3D models of structures, even when obscured by a forest canopy. However, this technology has a high cost, both from the plane itself and from the processing of the LIDAR point cloud. Furthermore, this technique can only be used over limited regions. This paper proposes a technique that uses SAR satellite imagery to identify man-made structures hidden by a forest canopy. To do so, we exploit the Ascending and Descending passes of Sentinel-1 so that we obtain two images of the candidate site but from different sight directions. Because of cardinal effects, a large enough building will sign differently from the comparatively isotropic forest canopy it is obscured by. Practically, the technique is based on the ratio of backscattered intensity from these two illumination angles and is well adapted for large areas. The advantages and shortcomings are discussed for the specific case of Sentinel-1 SAR images over two Maya archaeological sites in Central America. Our analysis shows that SAR satellite imagery might provide a free, global-scale way of preselecting sites with large or tall structures to complement LIDAR technology.


Conflict of interest statement

The authors declare no competing interests.

Figures

Figure 1
Figure 1
Optical image of the warehouses used to illustrate the technique. The footprint of the picture is identical to the one in the radar images. North is up.
Figure 2
Figure 2
Illustration of Sentinel-1 orbit © SkyGeo. A descending path follows an ascending path, and vice-versa.
Figure 3
Figure 3
Flowchart describing the preprocessing protocol used. The protocol comes from a tutorial by the European Space Agency. It must be applied to each direction separately.
Figure 4
Figure 4
Illustration of the illumination of a man-made structure from the left.
Figure 5
Figure 5
Illustration of the illumination of a man-made structure from the right.
Figure 6
Figure 6
Illustration of a ratio image between both directions. The left and right parts of the building can be distinguished both from each other and from the neighboring environment.
Figure 7
Figure 7
Example of an ascending (illuminated from the West) SAR image: (a) the scattering mechanisms in play over a man-made structure, from the ascending direction (b) an ascending SAR image of some warehouses, with speckle. Image taken by Sentinel-1, preprocessed using SNAP, processed using Python. The axes for the image are in pixels. One pixel is 10 m by 10 m. North is up. The satellite trajectory was indicated in red, some SAR lines of sight were drawn in yellow. Note the brightness of the western sides and the shadows, particularly visible between the two smaller warehouses in the top right corner.
Figure 8
Figure 8
Example of a descending (illuminated from the East) SAR image: (a) the scattering mechanisms in play over a man-made structure, from the descending direction (b) a descending SAR image of some warehouses, with speckle. Image taken by Sentinel-1, preprocessed using SNAP, processed using Python. The axes for the image are in pixels. One pixel is 10 m by 10 m. North is up. The satellite trajectory was indicated in red, some SAR lines of sight were drawn in yellow. Note the brightness of the eastern sides and the shadows, particularly visible between the two smaller warehouses in the top right corner.
Figure 9
Figure 9
Illustration of the technique: (a) the different colored zones, corresponding to the western (red) and eastern (blue) sides of the building, and to both its center and the neighboring ground (green) (b) Example of the processing of the SAR images of the warehouses. Image taken by Sentinel-1, preprocessed using SNAP, processed using Python. The axes for the image are in pixels. One pixel is 10 m by 10 m. North is up. Note the speckle that creates red and blue areas over the ground (that should be uniformly green).
Figure 10
Figure 10
Illustration of the impact of speckle filtering: (a) the ascending SAR image from Figure 7b (b) temporal mean of the ascending SAR time series of the warehouses (c) Ascending over Descending ratio of the temporal averages. Note the uniformly green area for the flat terrain. Images taken by Sentinel-1, preprocessed using SNAP, processed using Python. The axes for the images are in pixels. One pixel is 10 m by 10 m. North is up.
Figure 11
Figure 11
Illustration on a pyramid in open terrain: (a) Optical image of the pyramid of the Sun (b) Ascending over Descending ratio over the same area. Image taken by Sentinel-1, preprocessed using SNAP, processed using Python. North is up.
Figure 12
Figure 12
(a) Picture of a pyramid from the archaeological site of Nakbe, Guatemala. Trees can be seen growing on the structure. (b) AscDes signature of a pyramid in Nakbe covered by trees. Image taken by Sentinel-1, preprocessed using SNAP, processed using Python. The axes for the image are in pixels. One pixel is 10 m by 10 m. North is up.
Figure 13
Figure 13
High Temple (aka Structure N10-43): (a) optical image with overlaid map of the structures (red) (b) AscDes ratio with overlaid map of the structures (white). Image taken by Sentinel-1, preprocessed using SNAP, processed using Python. North is up.
Figure 14
Figure 14
Structures P8-1 (top) and P9-25 (bottom): (a) optical image with overlaid map of the structures (red) (b) AscDes ratio with overlaid map of the structures (white). Image taken by Sentinel-1, preprocessed using SNAP, processed using Python. North is up.
Figure 15
Figure 15
Ratio images (left) and time series histograms (right) over several areas of interest: (a & b) a forest supposed without hidden structures (c & d) N10-43 (e & f) P8-1 (g & h) P9-25. Black rectangles on the ratio images represent the borders of the AoIs. 120 dates were used in the time series. Some statistics are summarized in Table 3 (left). Every AoI has roughly the same number of pixels. Images taken by Sentinel-1, preprocessed using SNAP, processed using Python. The axes for the images are in pixels. One pixel is 10 m by 10 m. North is up.
Figure 16
Figure 16
Comparison between the AscDes ratio image (a) and the standard deviation of the AscDes ratio over the site of Lamanai (b). The window size is the smallest AoI size (i.e., N10-43’s). The lake has been masked out in white. Some known structures are delimited by rectangles. Image taken by Sentinel-1, preprocessed using SNAP, processed using Python. The axes for the images are in pixels. One pixel is 10 m by 10 m. North is up.
Figure 17
Figure 17
Application over three sites identified by LaRocque. From top to bottom: site A, site B and site C. From left to right: optical image, AscDes ratio image over the whole site, zoom on a potential AoI, and histogram for said AoI. Their borders are represented by black rectangles. A body of water near site C has been masked out in white. 60 dates were used for the time series. Some statistics are summarized in Table 3 (right). Images taken by Sentinel-1, preprocessed using SNAP, processed using Python. The axes for the images are in pixels. One pixel is 10 m by 10 m. North is up.

References

    1. Devereux B, Amable G, Crow P, Cliff A. The potential of airborne lidar for detection of archaeological features under woodland canopies. Antiquity. 2005;79:648–660. doi: 10.1017/S0003598X00114589. - DOI
    1. Šprajc I, et al. Ancient Maya water management, agriculture, and society in the area of Chactún, Campeche. Mexico. J. Anthropol. Archaeol. 2021;61:101261. doi: 10.1016/j.jaa.2020.101261. - DOI
    1. Thompson, A. E. Detecting classic Maya settlements with Lidar-derived relief visualizations. Remote Sens.12, 10.3390/rs12172838 (2020).
    1. Bundzel, M. et al. Semantic segmentation of airborne LiDAR data in Maya archaeology. Remote Sens.12, 10.3390/rs12223685 (2020).
    1. Taillade, T., Thirion-Lefevre, L. & Guinvarc’h, R. Detecting ephemeral objects in SAR time-series using frozen background-based change detection. Remote Sens.12, 10.3390/rs12111720 (2020).