. 2024 Feb 8;14(1):3291.
doi: 10.1038/s41598-024-53381-w.

Human archetypal pluripotent stem cells differentiate into trophoblast stem cells via endogenous BMP5/7 induction without transitioning through naive state

Affiliations

Human archetypal pluripotent stem cells differentiate into trophoblast stem cells via endogenous BMP5/7 induction without transitioning through naive state

Ethan Tietze et al. Sci Rep. .

Abstract

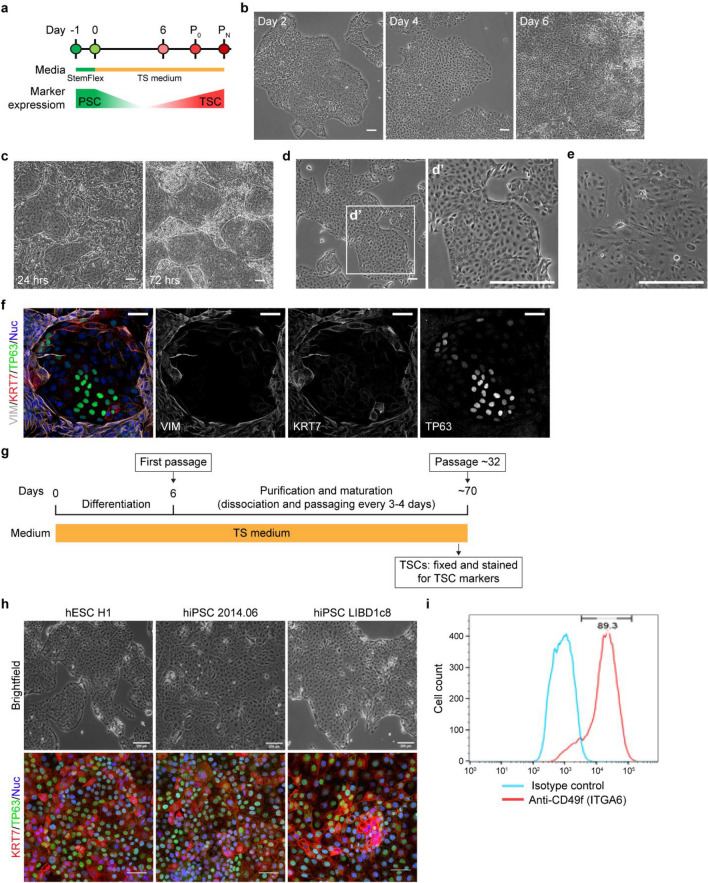
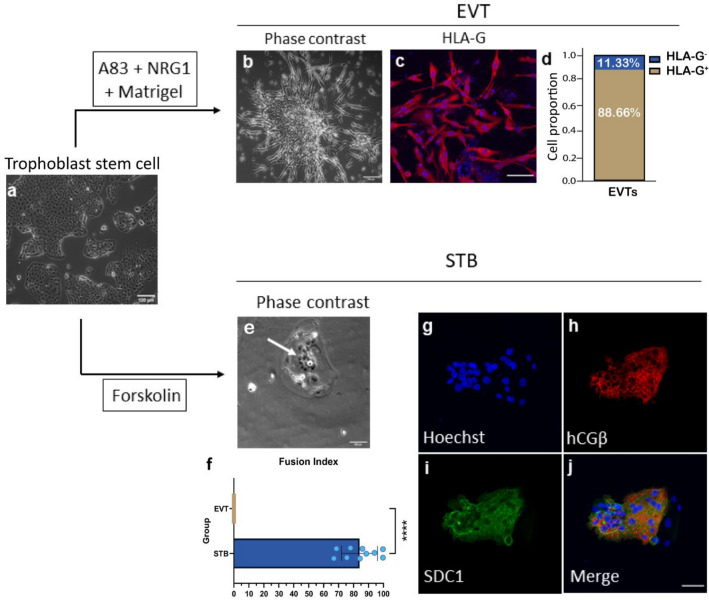
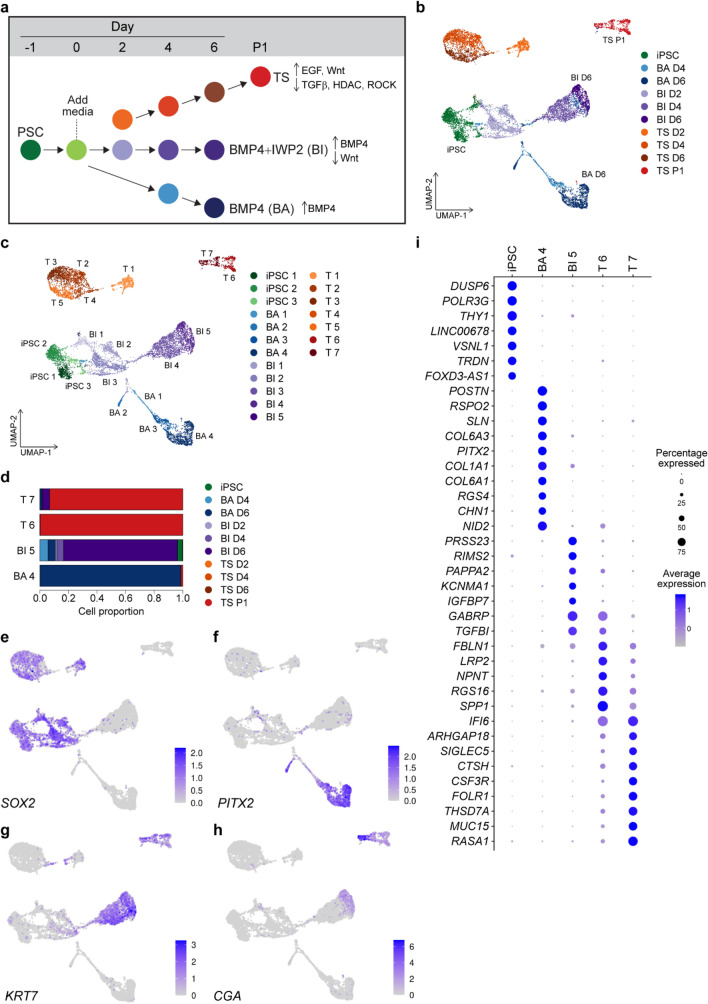
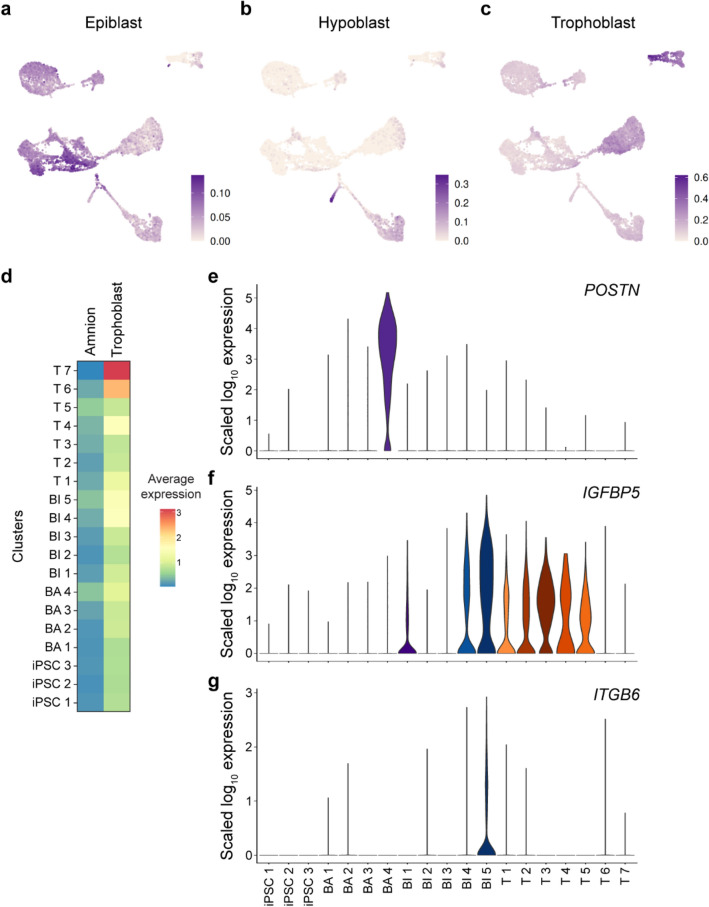
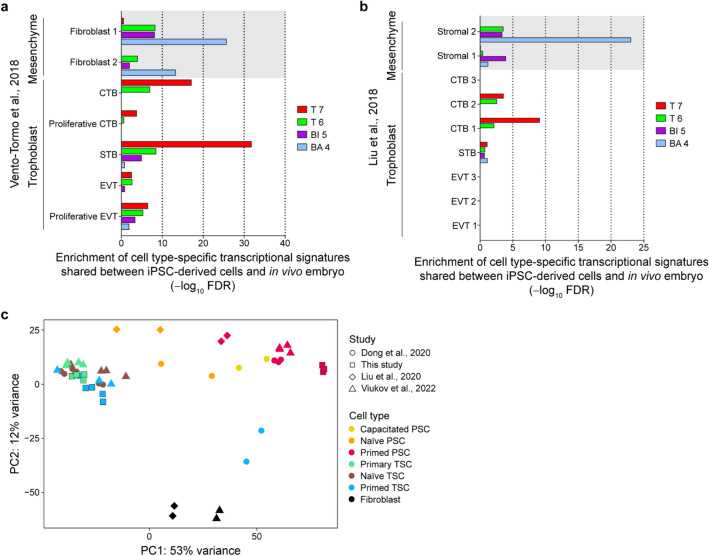
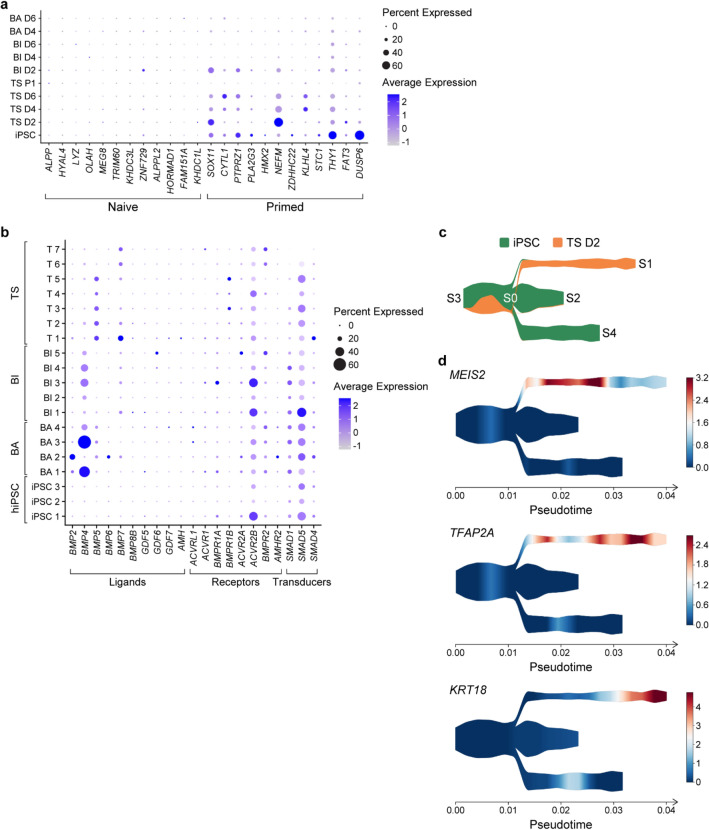
Primary human trophoblast stem cells (TSCs) and TSCs derived from human pluripotent stem cells (hPSCs) can potentially model placental processes in vitro. Yet, the pluripotent states and factors involved in the differentiation of hPSCs to TSCs remain poorly understood. In this study, we demonstrate that the primed pluripotent state can generate TSCs by activating pathways such as Epidermal Growth Factor (EGF) and Wingless-related integration site (WNT), and by suppressing tumor growth factor beta (TGFβ), histone deacetylases (HDAC), and Rho-associated protein kinase (ROCK) signaling pathways, all without the addition of exogenous Bone morphogenetic protein 4 (BMP4)-a condition we refer to as the TS condition. We characterized this process using temporal single-cell RNA sequencing to compare TS conditions with differentiation protocols involving BMP4 activation alone or BMP4 activation in conjunction with WNT inhibition. The TS condition consistently produced a stable, proliferative cell type that closely mimics first-trimester placental cytotrophoblasts, marked by the activation of endogenous retroviral genes and the absence of amnion expression. This was observed across multiple cell lines, including various primed induced pluripotent stem cell (iPSC) and embryonic stem cell (ESC) lines. Primed-derived TSCs can proliferate for over 30 passages and further specify into multinucleated syncytiotrophoblasts and extravillous trophoblast cells. Our research establishes that the differentiation of primed hPSCs to TSC under TS conditions triggers the induction of TMSB4X, BMP5/7, GATA3, and TFAP2A without progressing through a naive state. These findings propose that the primed hPSC state is part of a continuum of potency with the capacity to differentiate into TSCs through multiple routes.


Conflict of interest statement

The authors declare no competing interests.

Figures

Figure 1
Figure 1
Derivation of trophoblast stem cells (TSCs) from human pluripotent stem cells (hPSCs). (a) Schematic overview of TSC derivation from hPSC. (b) Representative brightfield images of differentiating TSCs from hESC H1. Days after addition of TS media are indicated. (c) Images of TSCs derived from hESC H1 at 24- and 72-h following passage 1 (P1) on day 6. (d) Images of mature TSCs derived from hESC H1 after ten passages. Magnified image is shown as d′. (e) Image of primary TSCs (CT29). (f) Representative images of immunofluorescence staining of TSCs after one passage for VIM, KRT7 and TP63. Nuclei were stained with Hoechst 33342 (blue). TSCs were derived from hiPSC (LIBD7c6). (g) Schematic representation of the protocol for TSC derivation from hPSC. (h) Representative bright and immunofluorescent images for TSCs derived from hPSC lines. Nuclei were stained with Hoechst 33342 (blue). (i) Flow cytometry data showing the expression of CD49f/ITGA6 in mature TSCs at passage 30 derived from hESC H1. Scale bars, 100 mm (be,h: brightfield images); 50 mm (f,h: immunofluorescent images).
Figure 2
Figure 2
hPSC-derived TSCs differentiate into syncytiotrophoblasts (STBs) and extravillous cytotorophoblasts (EVTs). (a) Representative image of TSCs derived from hESC H1. (b) Representative image of EVTs differentiated from hESC H1-derived TSCs. (c) Immunofluorescence image of EVTs showing the expression of HLA-G. Nuclei were stained with Hoechst 33342. (d) Proportion of EVTs positive or negative for HLA-G after 6 days of differentiation (n = 300 cells, 12 ROI). (e) Representative image of STBs derived from hESC H1-derived TSCs. (f) Fusion efficiency of STBs and EVTs derived from hESC H1-derived TSCs. Ten ROIs for both STBs and EVTs were analyzed; n = 30–50 nuclei per ROI. Data is presented by mean ± SEM. ****p < 0.0001 (Mann–Whitney test). (g–j) Immunofluorescence images of STBs showing the expression of hCGb (h) and SDC1 (i). Scale bars, 200 mm (a); 100 mm (b,c,e,gj).
Figure 3
Figure 3
Temporal single cell RNA sequencing (scRNA-seq) of hiPSCs differentiation into trophoblast differentiation. (a) Schematic of trophoblast differentiation conditions. hiPSCs were plated and cultivated for 24 h before addition of differentiation media. Cells were collected for scRNA-seq at indicated time points. (b) Uniform Manifold Approximation and Projection (UMAP) embedding of 9821 single cell transcriptomes from three distinct differentiation conditions with groupings based on sample identity (b) or gene expression clusters (c) calculated by k nearest neighbors using the Euclidean distance of the 30 first PCs which identifies 19 clusters. Cells from the BA condition almost exclusively formed four clusters (BA1–BA4) indicated in blue. Cells from the BI condition were found predominantly in a group of five heterogeneous clusters (BI1–BI5) indicated in purple. hiPSCs are indicated in green and cells from TS conditions were found in clusters (T1–T7) indicated in orange. (d) Proportion of the cells at the most mature state in each differentiation condition (T7, T6, BI5 and BA4, presented in c). (eh) UMAP showing the normalized expression of marker genes for iPSCs (SOX2, e), placental stromal cells (PITX2, f), trophoblasts (KRT7, g and CGA, h). (i) Dot plot showing genes upregulated in iPSCs and the most mature cells in each differentiation condition (T7, T6, BI5 and BA4), compared to all other cell clusters presented in (c). Non-parametric Wilcoxon rank sum test (adj.p-value < 0.05; log2FC > 0.25). Average normalized expression levels are indicated.
Figure 4
Figure 4
hiPSC-derived TSCs without activating BMP4 exhibit similar gene expression patterns to trophoblasts from cultured human embryos. (ac) UMAP showing the expression similarity scores for single cells based on gene expression signatures in epiblast (a), hypoblast (b) and trophoblast (c) of human embryo. (d) Mean expression of genes identified in amnion and trophoblast in each cell cluster. The T7 cluster shows the highest average expression of trophoblast genes (p = 3.5e−41, Wilcoxon Rank Sum Test with Holm-middle combined) and the lowest average expression of amnion genes (p = 4.8e−06), compared to all other cell clusters. (eg) Violin plots showing the expression of amnion markers POSTN (e), IGFBP5 (f) and ITGB6 (g) in each cell cluster.
Figure 5
Figure 5
hiPSC-derived TSCs exhibit similarity to human placental cells during the first trimester. (a,b) Gene set enrichment analysis (GSEA) of cells at the most mature state in each differentiation condition (T7, T6, BI5 and BA4) to cell types identified in first trimester placenta,. (c) PCA plot showing the similarity of TSCs derived from hPSCs (primed TSC) in this study to TSCs from human primary tissues (primary TSC),, TSCs derived from naive hPSCs (naive TSC), and primed TSCs in the previous studies.
Figure 6
Figure 6
The process of primed hiPSC specification into TSCs begins with TFAP2A rewiring, without activating programs associated with naive hPSCs. (a) Dot plot showing the expression of marker genes for naive and primed hPSCs in cells derived from each differentiation condition across various time points. (b) Dot plot displaying the expression of genes in BMP signaling in each cell cluster. (c) Developmental trajectory from hiPSCs to cells differentiated in TS condition at day 2 (TS D2). Cell proportion along the smoothed pseudotime is shown. Nodes are labeled with numbers S0–S4. Branches are defined as the cells between 2 nodes. (d) Expression of top ranked genes showing the significant correlation with the pseudotime transition from S0 to S1 (TSC lineage).

Similar articles

Cited by

References

    1. Rossant J. Genetic control of early cell lineages in the mammalian embryo. Annu. Rev. Genet. 2018;52:185–201. doi: 10.1146/annurev-genet-120116-024544. - DOI - PubMed
    1. Al-Haddad BJS, et al. The fetal origins of mental illness. Am. J. Obstet. Gynecol. 2019;221:549–562. doi: 10.1016/j.ajog.2019.06.013. - DOI - PMC - PubMed
    1. Okae H, et al. Derivation of human trophoblast stem cells. Cell Stem Cell. 2018;22:50–63.e6. doi: 10.1016/j.stem.2017.11.004. - DOI - PubMed
    1. Pera MF. Pluripotent cell states and unexpected fates. Stem Cell Rep. 2022;17:1235–1236. doi: 10.1016/j.stemcr.2022.05.011. - DOI - PMC - PubMed
    1. Gafni O, Weinberger L, Mansour A, et al. Derivation of novel human ground state naive pluripotent stem cells. Nature. 2013;504:282–286. doi: 10.1038/nature12745. - DOI - PubMed

Substances