

Changes in alcohol consumption during the COVID-19 pandemic: a longitudinal cohort study using smart-breathalyzer data
- PMID: 38332308
- PMCID: PMC10853549
- DOI: 10.1038/s41598-024-53757-y
Changes in alcohol consumption during the COVID-19 pandemic: a longitudinal cohort study using smart-breathalyzer data
Abstract
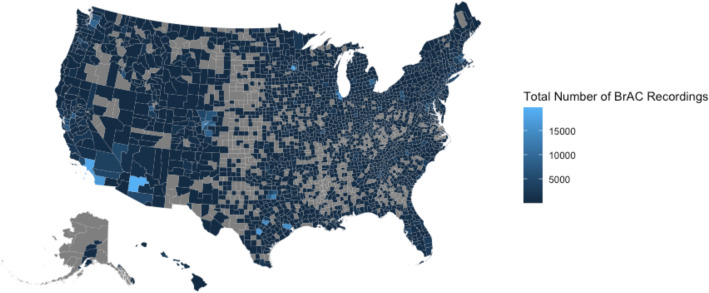
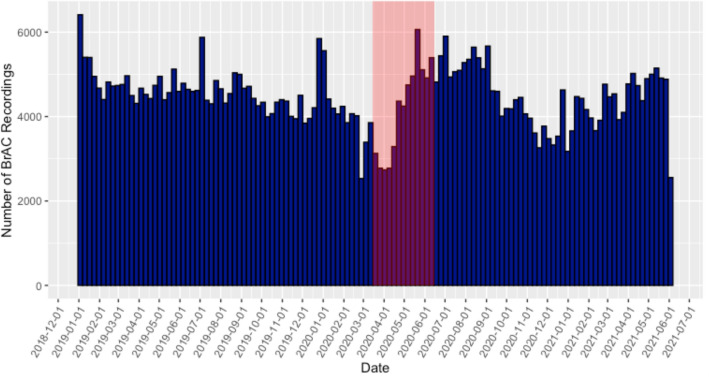
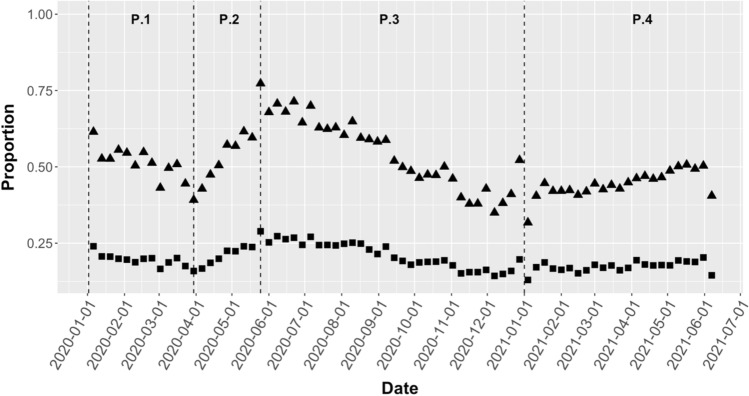
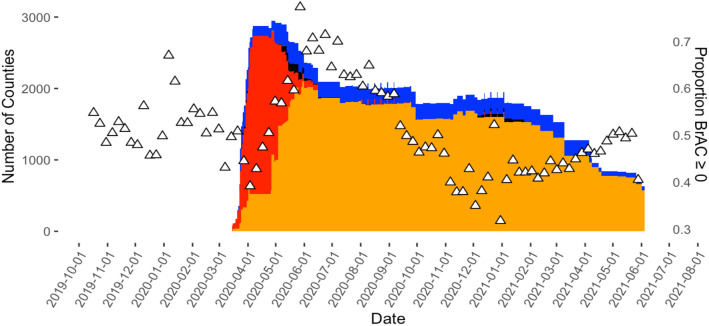
Previous studies relying on alcohol sales, alcohol-related injuries, and surveys have suggested that alcohol consumption increased during the COVID-19 pandemic. We sought to leverage over 1 million Breath Alcohol Concentration (BrAC) measurements from Bluetooth-enabled breathalyzers to conduct an objective and longitudinal assessment of alcohol use during the pandemic. Serial BrAC measurements revealed a decrease in drinking between January 1, 2020 and March 30, 2020, an increase between March 30, 2020 and May 25, 2020, a statistically insignificant decrease between May 25, 2020 and January 1, 2021, and an increase again between January 1, 2021 and June 4, 2021. No statistically significant relationships between shelter-in-place orders and alcohol consumption were detected. These findings demonstrate the complex relationship between the pandemic and alcohol consumption patterns, providing insights that may be relevant to the use of this commonly consumed substance with implications relevant to long-term effects from the patterns observed.
© 2024. The Author(s).
Conflict of interest statement
The authors declare no competing interests. Apart from providing a dataset as described, the company BACtrack had no role in the study.
Figures
Similar articles
-
Driving under the influence of alcohol during the COVID-19 pandemic.Forensic Sci Int. 2021 Dec;329:111076. doi: 10.1016/j.forsciint.2021.111076. Epub 2021 Oct 23. Forensic Sci Int. 2021. PMID: 34736051 Free PMC article.
-
The concerning increasing trend of alcohol beverage sales in the U.S. during the COVID-19 pandemic.Alcohol. 2021 Nov;96:37-42. doi: 10.1016/j.alcohol.2021.06.004. Epub 2021 Jul 8. Alcohol. 2021. PMID: 34245809 Free PMC article.
-
Alcohol consumption and closed borders - how COVID-19 restrictions have impacted alcohol sales and consumption in Europe.BMC Public Health. 2022 Apr 8;22(1):692. doi: 10.1186/s12889-022-13014-1. BMC Public Health. 2022. PMID: 35395783 Free PMC article.
-
Changes in alcohol use during the COVID-19 pandemic in Europe: A meta-analysis of observational studies.Drug Alcohol Rev. 2022 May;41(4):918-931. doi: 10.1111/dar.13446. Epub 2022 Feb 20. Drug Alcohol Rev. 2022. PMID: 35187739 Free PMC article. Review.
-
Chronic alcohol consumption and COVID-19 infection risk: A narrative review.Alcohol Clin Exp Res (Hoboken). 2023 Apr;47(4):629-639. doi: 10.1111/acer.15041. Epub 2023 Feb 27. Alcohol Clin Exp Res (Hoboken). 2023. PMID: 36851826 Review.
Cited by
-
"My drinking was way worse during the pandemic": A qualitative analysis of contextual and individual factors impacting alcohol use during the COVID-19 pandemic.PLoS One. 2025 Apr 2;20(4):e0319977. doi: 10.1371/journal.pone.0319977. eCollection 2025. PLoS One. 2025. PMID: 40173099 Free PMC article.
-
The Association Between Immigration-Related Stress, COVID-19 Impact, and Drinking Motives Among US-Born Latinos During the Pandemic.J Drug Issues. 2024 Sep 8:10.1177/00220426241281272. doi: 10.1177/00220426241281272. Online ahead of print. J Drug Issues. 2024. PMID: 40686569 Free PMC article.
-
Pandemic Recipes-Nutritional Values of Recipes in Legacy Media.Nutrients. 2025 May 28;17(11):1830. doi: 10.3390/nu17111830. Nutrients. 2025. PMID: 40507099 Free PMC article.
-
A qualitative exploration of triggers for alcohol use and access to support during the COVID-19 pandemic among people identifying as problem drinkers in the United Kingdom.Drug Alcohol Rev. 2025 Mar;44(3):858-870. doi: 10.1111/dar.14013. Epub 2025 Feb 11. Drug Alcohol Rev. 2025. PMID: 39935079 Free PMC article.
References
-
- CDC, COVID-19 Community Intervention and at-Risk Task Force, Monitoring and Evaluation Team & CDC, Center for State, Tribal, Local, and Territorial Support, Public Health Law Program. State and territorial COVID-19 orders and proclamations for individuals to stay home. https://data.cdc.gov/Policy-Surveillance/U-S-State-and-Territorial-Stay-... (2021).
-
- World Health Organization. Global status report on alcohol and health 2018. https://www.who.int/publications/i/item/9789241565639 (2018).
