

Prioritizing river basins for nutrient studies
- PMID: 38332337
- PMCID: PMC10853301
- DOI: 10.1007/s10661-023-12266-7
Prioritizing river basins for nutrient studies
Abstract
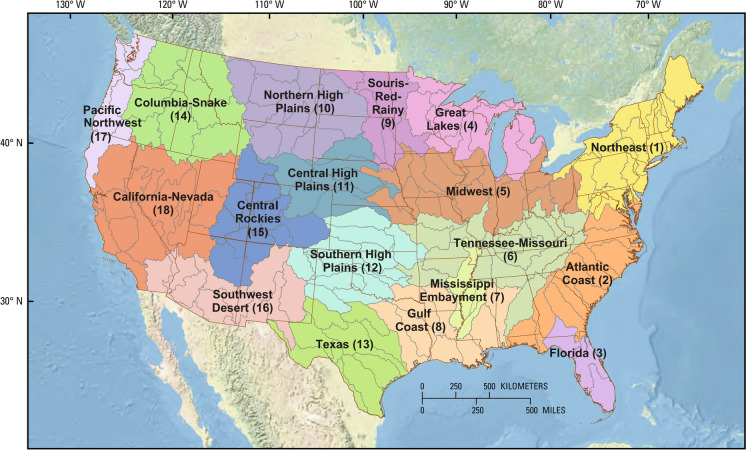
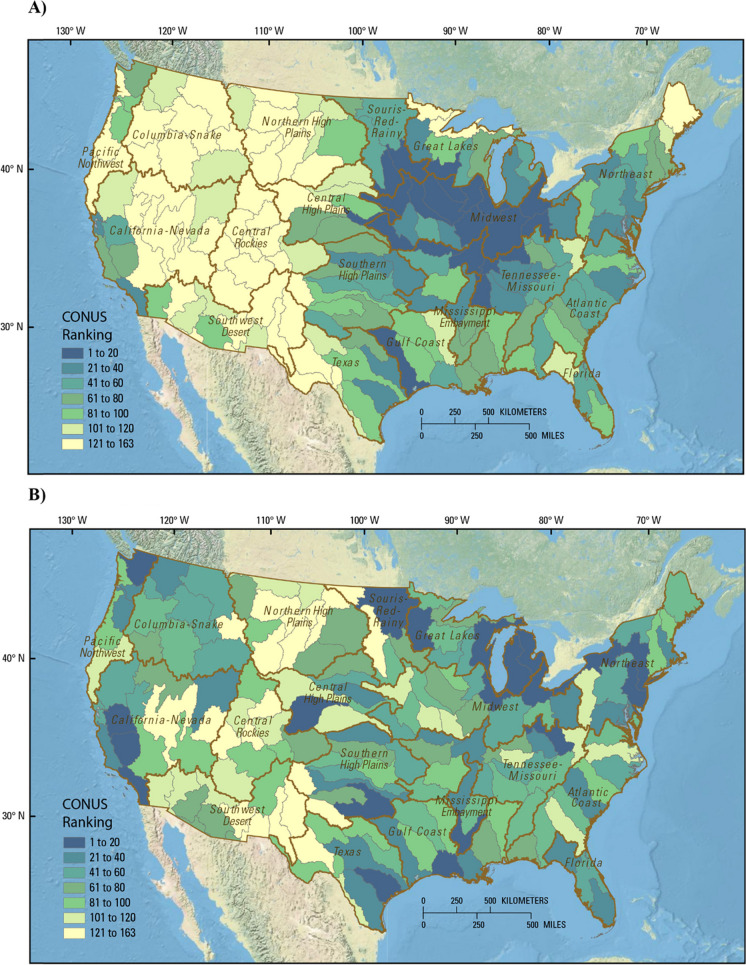
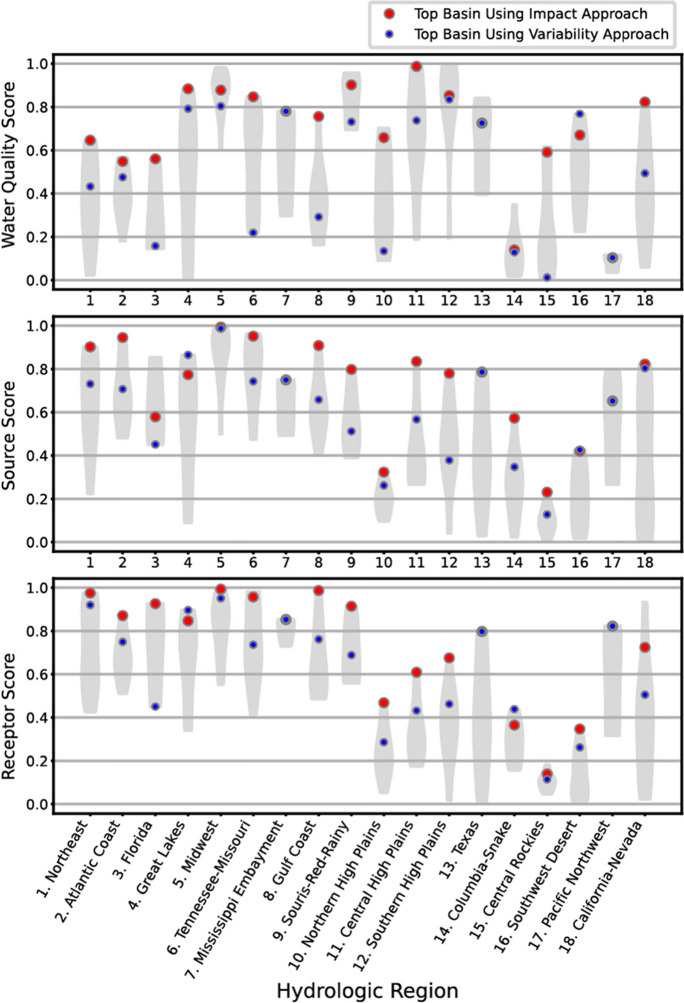
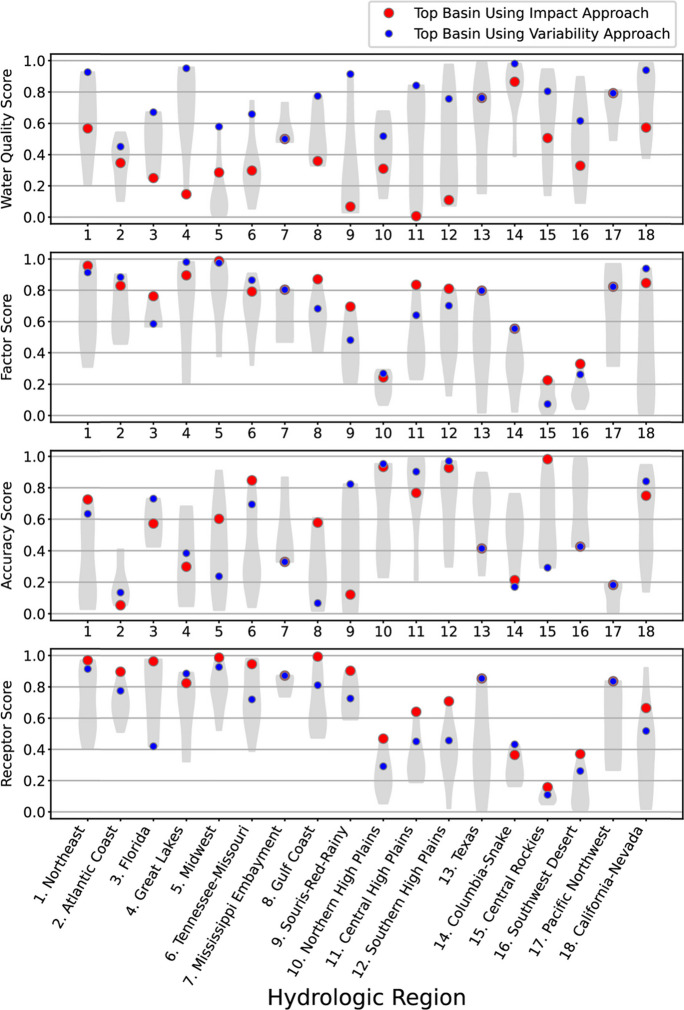
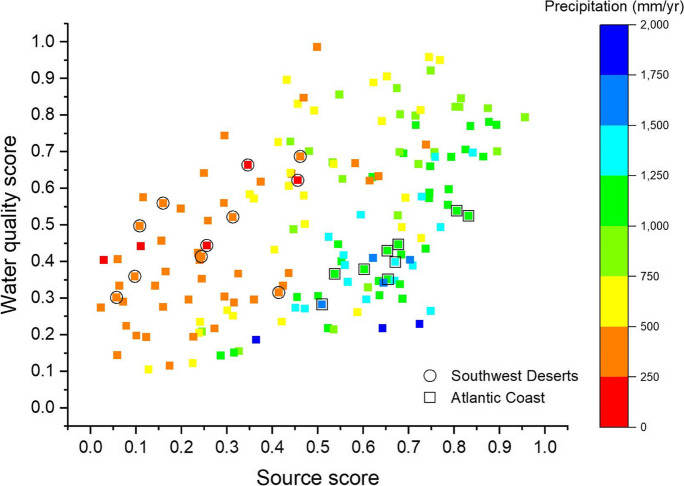
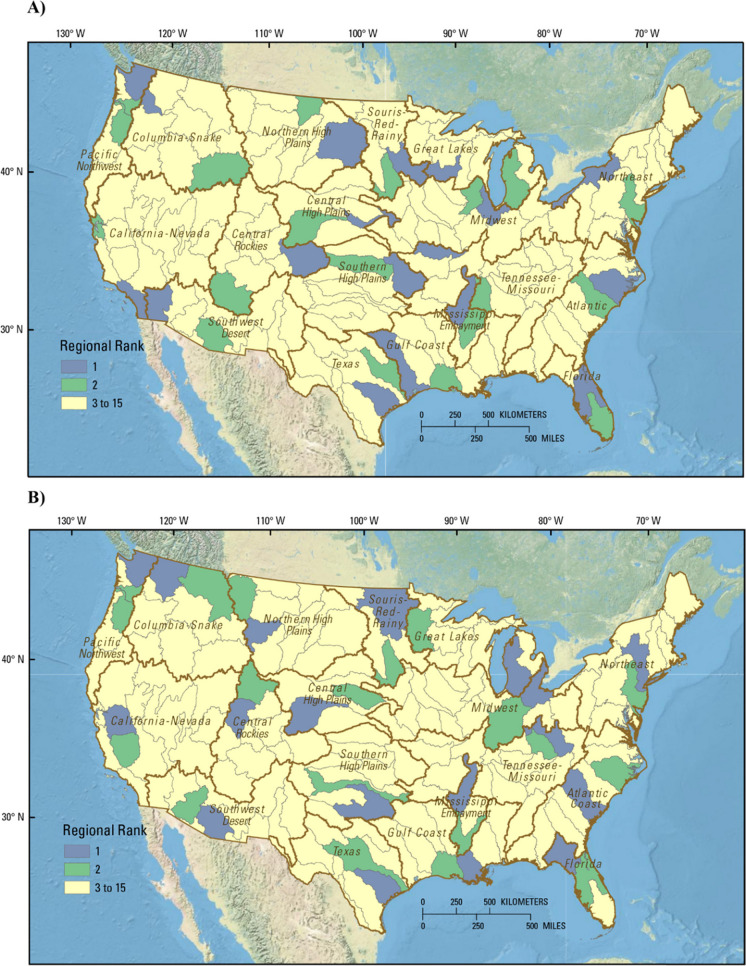
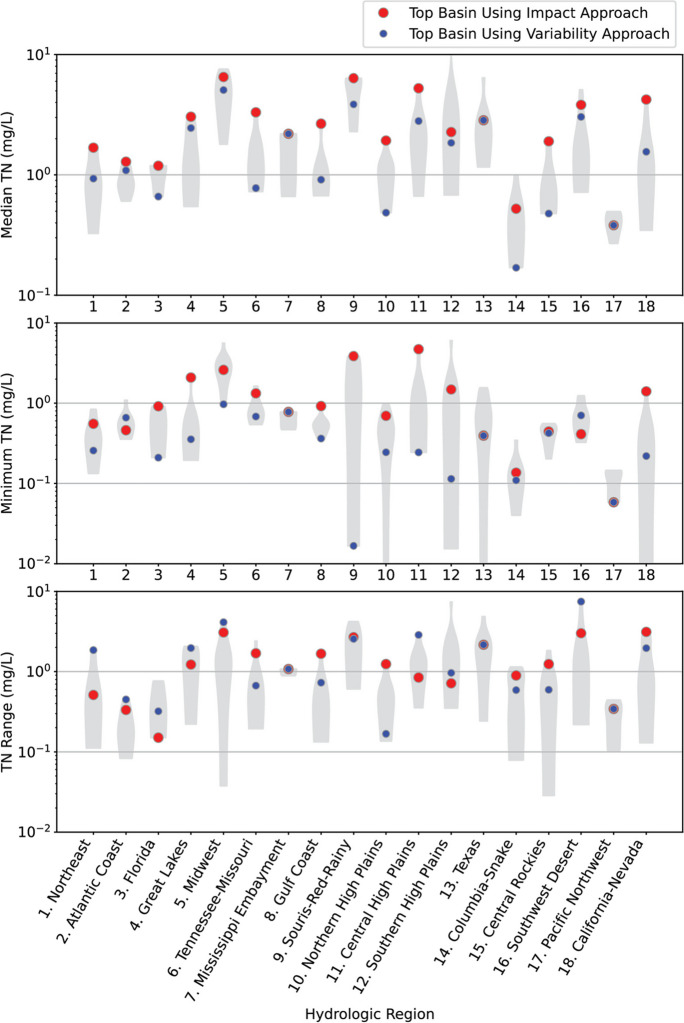
Increases in fluxes of nitrogen (N) and phosphorus (P) in the environment have led to negative impacts affecting drinking water, eutrophication, harmful algal blooms, climate change, and biodiversity loss. Because of the importance, scale, and complexity of these issues, it may be useful to consider methods for prioritizing nutrient research in representative drainage basins within a regional or national context. Two systematic, quantitative approaches were developed to (1) identify basins that geospatial data suggest are most impacted by nutrients and (2) identify basins that have the most variability in factors affecting nutrient sources and transport in order to prioritize basins for studies that seek to understand the key drivers of nutrient impacts. The "impact" approach relied on geospatial variables representing surface-water and groundwater nutrient concentrations, sources of N and P, and potential impacts on receptors (i.e., ecosystems and human health). The "variability" approach relied on geospatial variables representing surface-water nutrient concentrations, factors affecting sources and transport of nutrients, model accuracy, and potential receptor impacts. One hundred and sixty-three drainage basins throughout the contiguous United States were ranked nationally and within 18 hydrologic regions. Nationally, the top-ranked basins from the impact approach were concentrated in the Midwest, while those from the variability approach were dispersed across the nation. Regionally, the top-ranked basin selected by the two approaches differed in 15 of the 18 regions, with top-ranked basins selected by the variability approach having lower minimum concentrations and larger ranges in concentrations than top-ranked basins selected by the impact approach. The highest ranked basins identified using the variability approach may have advantages for exploring how landscape factors affect surface-water quality and how surface-water quality may affect ecosystems. In contrast, the impact approach prioritized basins in terms of human development and nutrient concentrations in both surface water and groundwater, thereby targeting areas where actions to reduce nutrient concentrations could have the largest effect on improving water availability and reducing ecosystem impacts.
Keywords: Basin selection; Federal research; Hydrology; Monitoring design; Nutrients; Water quality.
© 2024. This is a U.S. Government work and not under copyright protection in the US; foreign copyright protection may apply.
Conflict of interest statement
The authors declare no competing interests.
Figures
References
-
- Ator, S. W. (2019) Spatially referenced models of streamflow and nitrogen, phosphorus, and suspended-sediment loads in streams of the northeastern United States. In U.S. Geological Survey Scientific Investigations Report 2019-5118 (p. 57). 10.3133/sir20195118
-
- Beusen AHW, Doelman JC, Van Beek LPH, Van Puijenbroek PJTM, Mogollón JM, Van Grinsven HJM, Stehfest E, Van Vuuren DP, Bouwman AF. Exploring river nitrogen and phosphorus loading and export to global coastal waters in the Shared Socio-economic pathways. Global Environmental Change. 2022;72:102426. doi: 10.1016/j.gloenvcha.2021.102426. - DOI
-
- Boesch DF. Challenges and opportunities for science in reducing nutrient over-enrichment of coastal ecosystems. Estuaries. 2002;25:886–900. doi: 10.1007/BF02804914. - DOI
-
- Bohlke JK. Groundwater recharge and agricultural contamination. Hydrogeology Journal. 2002;10:438–439. doi: 10.1007/s10040-002-0210-z. - DOI
MeSH terms
Substances
LinkOut - more resources
Full Text Sources
