. 2024 Feb;26(2):194-206.
doi: 10.1038/s41556-023-01343-1. Epub 2024 Feb 8.

Mitochondrial DNA replication stress triggers a pro-inflammatory endosomal pathway of nucleoid disposal

Affiliations

Mitochondrial DNA replication stress triggers a pro-inflammatory endosomal pathway of nucleoid disposal

Laura E Newman et al. Nat Cell Biol. 2024 Feb.

Abstract

Mitochondrial DNA (mtDNA) encodes essential subunits of the oxidative phosphorylation system, but is also a major damage-associated molecular pattern (DAMP) that engages innate immune sensors when released into the cytoplasm, outside of cells or into circulation. As a DAMP, mtDNA not only contributes to anti-viral resistance, but also causes pathogenic inflammation in many disease contexts. Cells experiencing mtDNA stress caused by depletion of the mtDNA-packaging protein, transcription factor A, mitochondrial (TFAM) or during herpes simplex virus-1 infection exhibit elongated mitochondria, enlargement of nucleoids (mtDNA-protein complexes) and activation of cGAS-STING innate immune signalling via mtDNA released into the cytoplasm. However, the relationship among aberrant mitochondria and nucleoid dynamics, mtDNA release and cGAS-STING activation remains unclear. Here we show that, under a variety of mtDNA replication stress conditions and during herpes simplex virus-1 infection, enlarged nucleoids that remain bound to TFAM exit mitochondria. Enlarged nucleoids arise from mtDNA experiencing replication stress, which causes nucleoid clustering via a block in mitochondrial fission at a stage when endoplasmic reticulum actin polymerization would normally commence, defining a fission checkpoint that ensures mtDNA has completed replication and is competent for segregation into daughter mitochondria. Chronic engagement of this checkpoint results in enlarged nucleoids trafficking into early and then late endosomes for disposal. Endosomal rupture during transit through this endosomal pathway ultimately causes mtDNA-mediated cGAS-STING activation. Thus, we propose that replication-incompetent nucleoids are selectively eliminated by an adaptive mitochondria-endosomal quality control pathway that is prone to innate immune system activation, which might represent a therapeutic target to prevent mtDNA-mediated inflammation during viral infection and other pathogenic states.


Conflict of interest statement

Competing interests

The authors declare no competing interests.

Figures

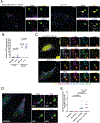
Extended Data Fig. 1 |
Extended Data Fig. 1 |. TFAM-bound nucleoids are present outside of mitochondria in TFAM knock-down and HSV-1 UL12.5-expressing cells.
a) Airyscan imaging of mtDNA FISH using a D-loop probe, followed by immunofluorescence against cGAS, HSP60, and TFAM, in IMR-90 cells transfected TFAM siRNA. Scale bars = 10 μm for larger images, 2 μm for insets. b) Quantification of extramitochondrial nucleoids positive for TFAM. N = 10 cells for both conditions, and data were quantified from one representative experiment of three. siCTRL was compared to siTFAM (p = 0.0017). c) Airyscan imaging of mtDNA FISH (D-loop probe), followed by immunofluorescence against TOM20 in U2OS cells that were transfected with either HSV-1 UL12.5 or GFP (as a negative control). Scale bars = 10 μm, ROI scale bars = 1 μm. d) Quantification of nucleoids present outside of mitochondria. GFP was compared to UL12.5 (p = 0.0005). N = 9 cells for GFP, N = 13 cells for UL12.5, and data were quantified from one experiment of three. e) Airyscan imaging of TFAM and HSP60 immunofluorescence in U2OS cells transfected with cGAS-mCherry along with either pcDNA3.1 or HSV-1 UL12.5. For the cGAS-mCherry channel, image display settings were not held constant between pcDNA3.1 and UL12.5, to allow for visualization of cGAS-mCherry structures and accounting for differences in the level of exogenous expression. Similarly, image display settings of TFAM are not constant between pcDNA3.1 and UL12.5, to account for diminished TFAM levels caused by UL12.5 expression (also causing neighboring untransfected cells to appear saturated in the bottom image shown). Scale bars = 20 μm, inset scale bars = 2 μm. f) Quantification of extramitochondrial nucleoids, using TFAM as a marker for mtDNA and performed similarly to quantification in D. pcDNA3.1 was compared to UL12.5 (p = 0.0068). N = 10 cells for both conditions, and data were quantified from one representative experiment of three. All differences were compared using unpaired, two-tailed student’s t test. For all plots, lines represent mean. Source numerical data are available in source data.
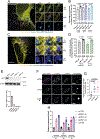
Extended Data Fig. 2 |
Extended Data Fig. 2 |. Characterization of TFAM-deficient U2OS cells derived using CRISPR.
a) Sequencing of U2OS TFAM-deficient clones, confirming insertion and frameshifting in exon 1 (top) relative to unedited U2OS cells (bottom). Similar results were obtained for both clones. b) Western blotting of TFAM and β actin (loading control) in two TFAM-deficient CRISPR clones (TFD-1 and TFD-2) as well as the parental U2OS cells. c) Quantification of B. Dots represent replicates of independent experiments (N = 3). d) mtDNA abundance (relative mtDNA copy number) analyzed by qPCR with D-loop and ND1 primers, normalized to nuclear 18 S. Dots represent replicates (N = 3). All data are reported as mean ± SEM. Source numerical data and unprocessed blots are available in source data.
Extended Data Fig. 3 |
Extended Data Fig. 3 |. Enlarged nucleoids are not released through BAX pores.
a) Airyscan imaging of immunofluorescence against activated BAX alongside TFAM and HSP60 in primary wild type and Tfam+/− MEFs. As a positive control, BAX-mediated mtDNA release was induced by treatment with ABT-737 (10 μM) plus QVD-OPh (20 μM) for 4 hours. Image display settings are held constant for BAX but not for TFAM or HSP60 to account for differences in the expression of each between experimental conditions. b) Quantification of (A). The number of BAX puncta per cell was counted. Wild-type was compared to Tfam+/− (DMSO: p = 0.9037, ABT-737/QVD-OPh: p = 0.0440). N = 11 cells for each condition. Data were quantified from one representative experiment of three. c) Airyscan imaging of TFAM-deficient U2OS cells expressing AIF(1–90)-mCherry (IMM, inner mitochondrial membrane), TOM20-Halo (OMM, outer mitochondrial membrane), and cGAS-GFP, along with immunofluorescence against DNA. ABT-737 and QVD-OPh treatment was used as a positive control for IMM herniation beyond the OMM. Image display settings are not the same between experimental conditions due to differences in exogenous expression as well as intensity of mtDNA puncta. Results were reproducible across three independent experiments. d) Airyscan imaging of mtDNA FISH using a D-loop probe in Bak−/−Bax−/− MEFs stably expressing TFAM shRNA and labeled with Mitotracker Deep Red (MTDR). Results are representative of three independent experiments. e) Quantification of extramitochondrial nucleoids per cell. Wild-type was compared to wild-type shTFAM (p < 0.0001), Bak−/−Bax−/− was compared to Bak−/−Bax−/− shTFAM (p < 0.0001), and wild-type shTFAM was compared to Bak−/−Bax−/− shTFAM (p = 0.1407). N = 21 cells for both wild type and Bak−/−Bax−/− MEFs, N = 23 cells for WT shTFAM, N = 26 cells for Bak−/−Bax−/− shTFAM, and data were quantified from one representative experiment of three. For all panels, scale bars = 10 μm and inset scale bars = 1 μm. For all plots, line represents mean. All differences were compared using unpaired, two-tailed student’s t test. Source numerical data are available in source data.
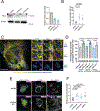
Extended Data Fig. 4 |
Extended Data Fig. 4 |. Enlarged nucleoids are not released through VDAC pores.
a) qRT-PCR of primary Tfam+/−MEFs transfected with control, VDAC1, or VDAC3 siRNAs, normalized to β actin. Dots represent biological replicates of independent experiments (N = 3). b) Western blotting of VDAC1 and β actin (loading control) in primary MEFs transfected with control or VDAC1 siRNAs. c) Quantification of B. Dots represent biological replicates (N = 3). d) qRT-PCR of Vdac3 in primary Tfam+/−MEFs transfected with control or VDAC3 siRNAs, normalized to β actin. qPCR data is shown due to the fact that attempts to blot for VDAC3 failed. Dots represent biological replicates of independent experiments (N = 3). e) U2OS cells expressing HSV-1 UL12.5 and cGAS-Halo were treated with either DMSO or VBIT4 (10 μM) for 24 hrs and imaged for TFAM and HSP60 immunofluorescence using resonance scanning confocal microscopy. The number of extramitochondrial cGAS+ TFAM+ puncta was scored, and DMSO was compared to VBIT4 by unpaired, two-tailed t test (p = 0.6405). N = 50 cells for DMSO and N = 49 cells for VBIT4, and data were quantified from three independent experiments. f) Western blotting against PARP in cells treated with the indicated concentration (100 nM or 500 nM) of the apoptosis inducer ABT-737 along with either DMSO or VBIT4 (10 μM). The reduction of cleaved PARP indicates that the induction of apoptosis is reduced in cells treated with VBIT4, as previously published, demonstrating that the VBIT4 used in panel E is active. β actin was probed as a loading control. Results were reproduced across three independent experiments. For all plots, data are reported as mean ± SEM. Source numerical data and unprocessed blots are available in source data.
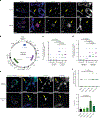
Extended Data Fig. 5 |
Extended Data Fig. 5 |. Enlarged nucleoids traffic through endosomes.
a) A representative tomogram slice (of 27) of a Tfam+/− MEF cell imaged by cellular cryo-electron tomography. Multivesicular bodies are highlighted by dashed pink lines, and mitochondria are highlighted by dashed cyan lines. Scale bar = 100 nm. b) The presence of multivesicular bodies was scored as described under methods. N = 15 tomograms (fields of view) for wild-type MEFs and N = 27 tomograms (fields of view) for Tfam+/−MEFs. Data are reported as mean ± SD. c) Airyscan imaging of mtDNA FISH (D-loop probe), followed by immunofluorescence against RAB7, cGAS, and HSP60 in TFAM-depleted IMR-90 cells. Scale bars = 10 μm and inset scale bars = 1 μm. Results are representative of three independent experiments. d) Airyscan imaging of TFAM and HSP60 immunofluorescence in U2OS cells expressing RAB7A-GFP, cGAS-mCherry, and HSV-1 UL12.5. Scale bars = 10 μm and inset scale bars = 1 μm. Results are representative of three independent experiments. e) Confocal imaging of live U2OS cells transfected with BFP-Fis1 (mitochondrial OMM) and UL12.5 and labeled with Pico Green and Lysotracker Deep Red. f) Same as panel E but treated with bafilomycin A1 (which prevents lysosomal acidification, 200 nM) immediately prior to Lysotracker labeling (15 min.) and additionally for the duration of Lyosotracker labeling and imaging. Scale bars = 10 μm and inset scale bars = 2 μm. For panels E and F, the experiment was performed three times with similar results. g) Quantification of panel C. The number of extramitochondrial nucleoids per cell that were positive for both cGAS and RAB7 was scored for cells transfected with control or TFAM siRNAs. siCTRL was compared to siTFAM (p = 0.0428). N = 10 cells for each condition, and data were quantified from one representative experiment of three. h) Quantification of panel D. The number of TFAM-marked nucleoids per cell that were positive for both cGAS and RAB7 was scored, and pcDNA3.1 was compared to UL12.5 (p = 0.0009). N = 11 cells for both conditions, and data were quantified from one representative experiment of three. i) Quantification of panel E. The number of extramitochondrial Pico Green puncta were scored, and pcDNA3.1 was compared to UL12.5 (p = 0.0009). Lysotracker+ puncta were identified by measuring Lysotracker intensity within these Pico Green puncta. Values above background intensities (measured in bafilomycin-treated cells) were counted as positive, and pcDNA3.1 was compared to UL12.5 (p = 0.043). j) Quantification of panel F. Extramitochondrial Pico Green puncta in bafilomycin-treated cells were scored and pcDNA3.1 was compared to UL12.5 (p = 0.0023) (no Lysotracker+ Pico Green puncta were observed in bafilomycin-treated cells). For panels I and J, N = 20 cells for pcDNA3.1 and N = 19 cells for UL12.5; data were pooled from two independent experiments; and the experiment was repeated a third time with similar results. k) Quantification of mitophagy via ratiometric flow cytometry performed in U2OS cells with stable expression of mCherry-GFP-Fis1. Cells were either transfected with pcDNA3.1, UL12.5 or treated with Bafilomycin-A1 (20 nM) or Deferiprone (DFP 1 mM) 24 hours before flow cytometry analysis. The data are shown as the average ratio of mCherry/GFP ± SEM from biological replicate experiments shown as dots (N of 2–3). pcDNA3.1 was compared to UL12.5 (p = 0.9531). l) Spinning disk imaging of Pico Green (DNA), BFP-Fis1 (mitochondria), and mCherry-RAB5B (early endosomes) in live cells expressing HSV-1 UL12.5. Scale bars = 10 μm and inset scale bars = 2 μm. This experiment was performed three times with similar results. m) Quantification of extramitochondrial Pico Green puncta also positive for mCherry-RAB5B. pcDNA3.1 was compared to UL12.5 (p = 0.0313). N = 31 cells for pcDNA3.1, N = 34 cells for UL12.5, and data were quantified from one representative experiment of three. For all plots, line represents mean, and all graphs represent mean ± SEM. All differences were compared using unpaired, two-tailed student’s t test. Source numerical data are available in source data.
Extended Data Fig. 6 |
Extended Data Fig. 6 |. Segmentation of organelles in cryo-EM tomograms of Tfam+/−MEFs.
A representative tomogram slice (of a total of 27) of a Tfam+/− MEF cell imaged by cellular cryo-electron tomography. Membranes were segmented and colored orange for multivesicular bodies, purple for mitochondria, and teal for ER. Scale bar = 100 nm.
Extended Data Fig. 7 |
Extended Data Fig. 7 |. HSV1 does not trigger re-localization of enlarged nucleoids into autophagosomes.
a) Spinning disk imaging of LC3, TFAM, and HSP60 immunofluorescence in a U2OS cell 8 hours after infection with HSV1-GFP. Larger scale bar = 10 μm and inset scale bars = 1 μm. This experiment was performed three times with similar results. b) The number of non-mitochondrial TFAM puncta that overlapped with LC3 was scored. Mock infected cells were compared to cells infected for 8 hours (p = 0.3135). Number of cells: N = 31 for mock, N = 33 for 4 hr, N = 31 for 6 hr, N = 32 for 8 and 10 hr, and data were pooled from three independent experiments. The same dataset was used to generate both graphs. c) Spinning disk imaging of LC3 immunofluorescence in U2OS cells infected with HSV1-GFP and fixed at the indicated timepoints after infection. Scale bars = 10 μm. This experiment was performed three times with similar results. d) The number of LC3 puncta per cell was scored and compared between mock and infected cells (p = 0.0047 for 4 hr, p < 0.0001 for 6, 8, and 10 hr). e) The mean fluorescence intensity within LC3 puncta was measured (see Methods) and compared between mock and infected cells (p = 0.2544 for 4 hr, p < 0.0001 for 6, 8, and 10 hr). For panels D and E, N = 12 cells per condition, and data were quantified from one representative experiment of three. For all plots, line represents mean, and all graphs represent mean ± SEM. All differences were compared using unpaired, two-tailed student’s t test. Source numerical data are available in source data.
Extended Data Fig. 8 |
Extended Data Fig. 8 |. Nucleoids cluster at mitochondria/ER contacts and are associated with reduced mitochondrial fission.
a) Airyscan imaging of a live TFAM-deficient U2OS cell (TFD-2) labeled with Ii33-mCherry (ER), Pico Green (DNA), and mtBFP (mitochondria). Time-lapse imaging demonstrates that mitochondria/ER forms contacts around enlarged nucleoids. This experiment was performed three times with similar results. b) Overlap between the ER and mitochondria-localized nucleoids was scored (see Methods). Enlarged nucleoids (>300 nm2) were compared to normal-sized nucleoids (<300 nm2) within the same cells using two-tailed, paired t tests (p = 0.0002 for U2OS, p = 0.0227 for TFD-1, p = 0.0180 for TFD-2). Number of cells: N = 14 for U2OS, N = 12 for TFD-1, N = 13 for TFD-2, and data were pooled from three experiments. c) The same experiment in panel A was repeated in cells expressing UL12.5. For panels A and D, scale bars = 10 μm and inset scale bars = 1 μm. This experiment was performed three times with similar results. d) Mitochondria/ER contacts at nucleoids were quantified as in Panel B. Enlarged nucleoids (>300 nm2) were compared to normal-sized nucleoids (<300 nm2) within the same cells using two-tailed, paired t tests (p < 0.0001 for pcDNA3.1, p = 0.0024 for UL12.5). N = 14 cells for pcDNA3.1, N = 13 cells for UL12.5, and data were pooled from three experiments. For panels B and D, data are reported as mean ± SEM. e) Western blotting of DRP1 and β actin (loading control) in primary MEFs transfected with control or DRP1 siRNAs. Quantification is shown on the right, and dots represent biological replicates of independent experiments (N = 3). f) Confocal imaging of primary wild-type MEFs transfected with siRNAs against TFAM or DRP1. Immunofluorescence against DNA and HSP60 is shown. Scale bars = 10 μm and inset scale bars = 2 μm. This experiment was performed three times with similar results. g) Quantification of nucleoids in panel F. The number of nucleoids per cell larger than 0.4 um2 was quantified by thresholding the non-nuclear DNA signal and measuring particle size using ImageJ. siCTRL was compared to siTFAM or siDRP1 using unpaired, two-tailed student’s t test (p < 0.0001). N = 16 cells for siCTRL, N = 14 cells for siTFAM, and N = 11 cells for siDRP1. Data were quantified from one representative experiment of three. Line represents mean. h) qRT-PCR of interferon-stimulated genes (ISGs, normalized to β actin) in primary wild-type MEFs transfected with control, TFAM, or one of three independent DRP1 siRNAs. Three independent, representative experiments performed on different days are combined onto one graph for ease of visualization. Dots represent technical replicates, and data are reported as mean ± standard deviation. Source numerical data and unprocessed blots are available in source data.
Extended Data Fig. 9 |
Extended Data Fig. 9 |. Loss of mtDNA segregation causes the formation of enlarged nucleoids at mitochondria/ER contact sites and elongates mitochondria.
a) Western blotting of TOP3A and β actin (loading control) in U2OS cells transfected with control or TOP3A siRNAs. Quantification of western blot data is shown in the graph (right), dots represent replicates of independent experiments (N = 3). b) The number of nucleoids larger than 300 nm2 was scored (using confocal images shown in Fig. 8a). siCTRL was compared to siTOP3A siRNAs by unpaired, two-tailed t test (p = 0.0037 for siRNA #1, p < 0.0001 for siRNA #2). N = 11 cells per condition, and data were quantified from one representative experiment of three. c) Airyscan imaging of Ii33-mCherry (ER), Pico Green (DNA), and BFP-Fis1 (mitochondria) of live cells depleted of TOP3A by siRNA (#2). Time-lapse imaging demonstrates mitochondria/ER contacts around enlarged nucleoids. Scale bars = 10 μm and inset scale bars = 1 μm. This experiment was performed three times with similar results. d) Overlap between the ER and mitochondria-localized nucleoids was scored (see Methods). Enlarged nucleoids (>300 nm2) were compared to normal-sized nucleoids (<300 nm2) within the same cells using two-tailed, paired t tests (p < 0.0001 for siCTRL, p < 0.001 for siTOP3A #1, p = 0.0033 for siTOP3A #2). N = 15 cells for siCTRL and siTOP3A #1, N = 14 cells for siTOP3A #2, and data were pooled from three experiments. e) Spinning disk imaging of U2OS cells transfected with the indicated siRNAs, followed by immunofluorescence against DNA and HSP60. Scale bars = 20 μm and inset scale bars = 2 μm. This experiment was performed three times with similar results. f) Quantification of F (see Methods). siCTRL was compared to siRNAs against TOP3A and DRP1 using unpaired, two-tailed t test (p < 0.0001 for siTOP3A #1, p = 0.0003 for siTOP3A #2, p < 0.0001 for siDRP1). Number of cells: N = 20 for siCTRL, N = 18 for siTOP3A #1, N = 15 for siTOP3A #2, N = 14 for siDRP1. Data were quantified from one representative experiment of three. For all graphs, data are reported as mean ± SEM. Source numerical data and unprocessed blots are available in source data.
Extended Data Fig. 10 |
Extended Data Fig. 10 |. Model summarizing endosome-mediated disposal of dysfunctional nucleoids.
Following mtDNA replication, a signal is sent from mitochondria to the ER allowing for polymerization of ER-associated actin, which allows newly replicated nucleoids to segregate via mitochondrial fission. If problems arise during mtDNA replication or segregation as a result of mtDNA damage, no signal is sent to the ER, and actin does not associate with the ER. If nucleoids are unable to properly segregate through mitochondrial fission, a fission checkpoint is enacted (to wait for the completion of mtDNA segregation), and nucleoids accumulate at sites of replication. If not rectified, the dysfunctional nucleoids are trafficked to endosomes and are ultimately degraded by trafficking through late endosomes. However, a subset of late endosomes fails to fully mature and ultimately rupture, enabling cGAS to bind to mtDNA and trigger innate immune signalling.
Fig. 1 |
Fig. 1 |. mtDNA stress results in TFAM-bound, extra-mitochondrial nucleoids.
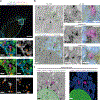
a, Airyscan imaging of mtDNA FISH (D-loop probe), followed by immunofluorescence against cGAS and TOM20 in IMR-90 cells transfected with control or TFAM siRNAs. Scale bars, 10 μm and inset scale bars, 1 μm. b, A schematic showing the regions of human mtDNA complementary to the three FISH probes used: D-loop, probe #4 (ND2–COI) or probe #8 (COII–ND4),. c, Quantification of extra-mitochondrial mtDNA. siCTRL (control) and siTFAM were compared (P = 0.0004 for D-loop, P = 0.0016 for probe #4 and P = 0.0003 for probe #8). For the D-loop probe, N = 10 cells for siCTRL and siTFAM; for probe #4, N = 12 cells for siCTRL and siTFAM; for probe #8, siCTRL N = 12 cells and siTFAM N = 13 cells. Data were quantified from one representative experiment of three. d, Overlap of extra-mitochondrial mtDNA with cGAS. siCTRL and siTFAM were compared (P = 0.005 for D-loop, P = 0.0001 for probe #4 and P = 0.0037 for probe #8). For the D-loop probe, siCTRL N = 10 cells and siTFAM N = 20 cells; for both probe #4 and probe #8, N = 12 cells for siCTRL and siTFAM. Data were quantified from one representative experiment of three. e, Spinning disk imaging of TFAM and HSP60 immunofluorescence in a U2OS cell 8 h after infection with HSV-1–GFP. The image display settings of TFAM are not constant between conditions, to account for diminished TFAM levels caused by HSV-1 infection. Larger scale bar, 10 μm and inset scale bars, 2 μm. f, Quantification of non-mitochondrial TFAM at the indicated timepoints after infection. Mock and infected cells were compared (P = 0.0151 for the number of extra-mitochondrial nucleoids and P = 0.0202 for the percentage of cells with extra-mitochondrial nucleoids). Number of cells: N = 70 for mock, N = 71 for 4 h, N = 74 for 6 h, N = 64 for 8 h and N = 73 for 10 h. Data were pooled from three independent experiments. The same dataset was used to generate both graphs shown in f. The bottom graph shows the percentage of cells with extra-mitochondrial mtDNA, and data are presented as mean ± s.e.m. All differences were compared using an unpaired, two-tailed Student’s t-test. For all images, lines represent the mean. Source numerical data are available in Source data.
Fig. 2 |
Fig. 2 |. Defective nucleoids escape from mitochondria in membrane compartments.
ad, TFAM-deficient U2OS cells (TFD-1) were imaged live using Airyscan microscopy until a cGAS-positive nucleoid was observed to be exiting mitochondria. The cell was fixed on the microscope stage and processed for CLEM (Methods). A total of ten cells were imaged live and fixed (one cell per gridded coverslip), and one cell was selected for full CLEM analysis. a, Airyscan imaging of a TFAM-deficient cell immediately after fixation. One z slice is shown. Arrows highlight a nucleoid leaving mitochondria. Scale bar, 5 μm and inset scale bars, 1 μm. b, Following fixation, the cell was processed for serial section 3D SEM. An overview of the entire cell shows SEM data sections aligned to fluorescence data (z-stack projection). c, One SEM slice, alone (top) or aligned to fluorescence data (bottom image) is shown. The arrowhead indicates mtDNA exiting mitochondria as shown in a. Scale bar, 1 μm. d, Enlargement of ROI from aligned CLEM data (right) and only EM data (left). Scale bar, 200 nm.
Fig. 3 |
Fig. 3 |. HSV-1 UL12.5 triggers membrane trafficking of nucleoids.
ac, CLEM of a U2OS cell expressing HSV-1 UL12.5. Cells were imaged post-fixation, and TFAM–GFP was used as a marker for mtDNA. A total of 12 cells were imaged across two gridded coverslips, and one cell was selected for full CLEM analysis. a, Airyscan imaging of a cell that was selected for CLEM. Arrows highlight three non-mitochondrial TFAM–GFP puncta overlapping with cGAS–mCherry, but not mTurquoise–LC3. Scale bar, 10 μm and inset scale bars, 1 μm. b, The cell from a was imaged by FIB–SEM, and the EM (top) and CLEM (bottom) data are shown. The insets highlight both EM (left) and CLEM (right) data of three TFAM/cGAS puncta (green boxes) identified from a (arrows). Scale bars, 2 μm and inset scale bars, 1 μm. c, Three-dimensional rendering of FIB–SEM data from the cell shown in b. TFAM +, cGAS+ structures (purple) as well as the nucleus (green) were segmented and overlaid onto the FIB–SEM data (top). The bottom image shows segmentation and 3D rendering of TFAM+, cGAS+ structures (purple), mitochondria (Mitos; blue) and the nucleus (green). Scale bars, 2 μm. This experiment was performed once (the observation of nucleoids present in membrane compartments was reproduced in Fig. 2).
Fig. 4 |
Fig. 4 |. HSV-1 infection triggers endosomal trafficking of nucleoids.
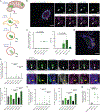
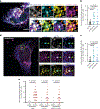
a, Model of endosomal disposal of enlarged nucleoids from mitochondria. b, Spinning disk imaging of RAB7, TFAM and HSP60 immunofluorescence in a U2OS cell 8 h after infection with HSV-1–GFP. Larger scale bar, 10 μm and inset scale bars, 1 μm. c, The number of non-mitochondrial TFAM puncta overlapped with RAB7 was scored. Mock and infected cells were compared (P = 0.0229). Number of cells: N = 39 cells for mock, N = 37 for 4 h, N = 41 for 6 h, N = 32 for 8 h and N = 41 for 10 h. Data were pooled from three independent experiments. The same dataset was used to generate both graphs. d, Spinning disk imaging of mCherry–RAB5B, PicoGreen and TOM20–Halo in live cells 7 h after infection with HSV-1–mCerulean. The brightness of the top ROI DNA signal is saturated for easier visualization. Larger scale bar, 10 μm and inset scale bars, 1 μm. e, The number of extra-mitochondrial PicoGreen puncta was scored. Mock and infected cells were compared (number of nucleoids: P = 0.003 for 6 h and P < 0.0001 for 8 h; percentage of cells: P = 0.0006 for 6 h and P = 0.0003 for 8 h). f, The number of extra-mitochondrial PicoGreen puncta overlapped with RAB5 was scored. Mock and infected cells were compared (number of nucleoids: P = 0.0142 for 6 h and P < 0.0001 for 8 h; percentage of cells: P = 0.0306 for 6 h and P < 0.0001 for 8 h). N (number of cells) for all graphs in e and f: mock 4 h, N = 25; HSV-1 4 h, N = 23; mock 6 h, N = 40; HSV-1 6 h, N = 39; mock 8 h, N = 39; and HSV-1 8 h, N = 40. The experiment was performed three times, and data were pooled from two independent experiments. The same dataset was used to generate all graphs in e and f. g, Mitochondria-localized enlarged nucleoids were identified on the basis of size (>0.36 μm2) and scored for the presence of mCherry–RAB5B. Mock and infected cells were compared (P < 0.0001). N = 15 cells per condition. Data were quantified from one of three representative experiments. All differences were compared using an unpaired, two-tailed Student’s t-test. In all graphs, lines represent the mean, error bars represent s.e.m. Source numerical data are available in Source data.
Fig. 5 |
Fig. 5 |. Rupture of late endosomes leads to access of cGAS to mtDNA that is trafficking through the endosomal pathway.
a, Quantification of extra-mitochondrial TFAM immunofluorescence and colocalization with either RAB7 immunofluorescence or cGAS–Halo, in U2OS cells expressing HSV-1 UL12.5 and either mCherry, mCherry–RAB5A or mCherry–RAB5A[S34N]. mCherry and RAB5[S34N] expressing cells were compared (P = 0.0003 for total extra-mitochondrial nucleoids, P = 0.0001 for RAB7+ nucleoids and P < 0.0001 for cGAS+ nucleoids). N = 35 cells for each condition. The experiment was performed three times, and data were pooled from two independent experiments. b, Spinning disk imaging of TFAM and HSP60 immunofluorescence in a U2OS cell expressing cGAS–Halo and GFP–Gal8. Larger scale bar, 10 μm and inset scale bars, 2 μm. c, Left: extra-mitochondrial TFAM puncta that were positive for cGAS were also scored for the presence of Gal8 (Gal8+). pcDNA3.1 and UL12.5 transfected cells were compared (P < 0.0001). N = 100 cells for pcDNA3.1 and N = 99 cells for UL12.5. Data were pooled from three independent experiments. Right: the percentage of extra-mitochondrial, cGAS-positive nucleoids that were also positive for Gal8 is plotted. N = 25 nucleoids for pcDNA3.1 and N = 126 nucleoids for UL12.5. The same dataset was used to generate both graphs in c. All differences were compared using an unpaired, two-tailed Student’s t-test. For all graphs, data are represented as mean ± s.e.m. Source numerical data are available in Source data.
Fig. 6 |
Fig. 6 |. Enlarged nucleoids are associated with incomplete mtDNA replication.
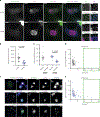
a, Pulse EdU labelling (4 h) of immortalized wild-type MEFs that were previously transfected with control or TFAM siRNAs for 96 h. *EdU incorporation within the nuclei of some cells in the population, shown as an internal positive control. Confocal images of EdU–Alexa488, DNA and HSP60 are shown. Scale bars, 10 μm for larger images and 2 μm for insets. b, Quantification of EdU labelling. A mask of nucleoids was created by thresholding non-nuclear DNA, and EdU fluorescence intensity was measured within the mask. siCTRL and siTFAM were compared using an unpaired, two-tailed Student’s t-test (P < 0.0001). c, The ratio of EdU fluorescence intensity to total DNA intensity within nucleoids was measured, and nucleoids were sorted by size (enlarged are >0.4 μm2). Normal and enlarged nucleoids in siTFAM cells were compared using a paired, two-tailed Student’s t-test (P < 0.0001) (no enlarged nucleoids were observed in siCTRL cells). In b and c, N = 12 cells for siCTRL and N = 14 cells for siTFAM. Data were quantified from one representative experiment of three. d, The ratio of EdU intensity to total DNA intensity is plotted as a function of nucleoid size. The green box highlights area of graph corresponding to enlarged nucleoids. Data from one representative siCTRL cell is shown. e, The same as d, but data for one representative siTFAM cell is shown. f, Airyscan imaging of immunofluorescence against Twinkle, POLG2 or mtSSB alongside DNA in immortalized Tfam+/− MEFs. Mitochondria were labelled using either HSP60 or Mitotracker Deep Red (MTDR). Scale bars, 10 μm for larger images and 1 μm for insets. The results are representative of three independent experiments. Data are represented as mean ± s.e.m. Source numerical data are available in Source data.
Fig. 7 |
Fig. 7 |. A mitochondrial fission checkpoint that ensures mtDNA replication is complete and daughter molecules are competent for segregation.
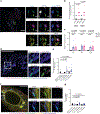
a, Airyscan imaging of mtDNA (D-loop probe), RAB7, cGAS and HSP60 in a DRP1-depleted IMR-90 cell. Scale bars, 10 μm and inset scale bars, 1 μm. b, Quantification of a. P = 0.0012 for cGAS+ nucleoids and P = 0.0080 for RAB7+ nucleoids. N = 10 cells for each condition. c, Reverse transcriptase quantitative PCR of ISGs (normalized to β actin) in primary wild-type MEFs receiving control, TFAM or DRP1 siRNAs. siCTRL and siTFAM or siDRP1 were compared (siTFAM: P = 0.0061 for Ifit1, P = 0.0123 for Ifit3 and P = 0.0012 for Isg15; siDRP1: P = 0.0226 for Ifit1, P = 0.007 for Ifit3 and P = 0.0075 for Isg15). Eight biological replicates are represented as mean ± s.e.m. d, Airyscan imaging of a live TFAM-deficient U2OS cell (TFD-1) expressing a mitochondria-targeted actin nanobody to label mitochondrial actin accumulation (AC-Mito). Scale bars, 10 μm and inset scale bars, 1 μm. e, Quantification of peak mitochondrial actin intensity normalized to mitochondrial fluorescence intensity. Parental U2OS and TFAM-deficient clones were compared (P = 0.0052 for TFD-1 and P = 0.0025 for TFD-2). N = 12 nucleoids for TFD-1 and N = 13 nucleoids for TFD-2, representing the total of enlarged nucleoids that was present across images of five cells. An equivalent number of normal-sized nucleoids was measured in each cell, and a total of 15 normal-sized nucleoids were measured across 5 control cells (Methods). f, Airyscan imaging of a live TFAM-deficient U2OS cell (TFD-1) expressing an ER-targeted actin nanobody to label ER actin accumulation (AC-ER). Scale bar, 10 μm and inset scale bars, 1 μm. g, Quantification of peak ER actin intensity normalized to ER fluorescence intensity. Parental U2OS and TFAM-deficient clones were compared (P = 0.09067 for TFD-1 and P = 0.6431 for TFD-2). For all conditions in g, 15 nucleoids were measured across five cells, except for enlarged nucleoids in U2OS cells (N = 4 nucleoids) and normal nucleoids in TFD-1 cells (N = 13 nucleoids). Data in b, e and g were quantified from one representative experiment of three. All differences were compared using an unpaired, two-tailed Student’s t-test. All plotted lines represent the mean. Source numerical data are available in Source data.
Fig. 8 |
Fig. 8 |. Loss of mtDNA segregation or mtDNA damage triggers endosomal trafficking of nucleoids.
a, Confocal imaging of a live U2OS cell depleted of TOP3A (siRNA #1), labelled with PicoGreen, and expressing TFAM–SNAP, mCherry–RAB5B and BFP–Fis1. Scale bar, 10 μm and inset scale bars, 2 μm. b, The number of extra-mitochondrial nucleoids (non-mitochondrial PicoGreen also positive for TFAM–SNAP) per cell was scored. siCTRL was compared with TOP3A siRNAs #1 (P = 0.0001) or #2 (P = 0.0011). c, The number of extra-mitochondrial nucleoids also positive for mCherry–RAB5B was scored. siCTRL was compared to TOP3A siRNAs #1 (P = 0.0011) or #2 (P = 0.0106). For both b and c, N = 20 cells for all conditions. Data were pooled from three independent experiments. d, Spinning disk imaging of mtDNA FISH (D-loop probe), followed by immunofluorescence against HSP60 and GFP, in U2OS cells that were transfected with cGAS–GFP and then treated with either dimethylsulfoxide (DMSO) or mtDox (10 μM). Scale bars, 20 μm and inset scale bars, 2 μm. e, The number of extra-mitochondrial nucleoids that overlapped with cGAS–GFP and RAB7 was scored. DMSO was compared with mtDox (P < 0.0001). N = 110 cells for DMSO and N = 101 cells for mtDox. Data were pooled from three independent experiments. All differences were compared using an unpaired, two-tailed Student’s t-test, and all plotted lines represent the mean. Source numerical data are available in Source data.

References

    1. Nadalutti CA, Ayala-Peña S & Santos JH Mitochondrial DNA damage as driver of cellular outcomes. Am. J. Physiol. 322, C136–C150 (2022). - PMC - PubMed
    1. Newman LE & Shadel GS Mitochondrial DNA release in innate immune signaling. Annu. Rev. Biochem. 10.1146/annurev-biochem-032620-104401 (2023). - DOI - PMC - PubMed
    1. Wu Z, Sainz AG & Shadel GS Mitochondrial DNA: cellular genotoxic stress sentinel. Trends Biochem. Sci. 46, 812–821 (2021). - PMC - PubMed
    1. Kasashima K, Sumitani M & Endo H Human mitochondrial transcription factor A is required for the segregation of mitochondrial DNA in cultured cells. Exp. Cell Res. 317, 210–220 (2011). - PubMed
    1. Bonawitz ND, Clayton DA & Shadel GS Initiation and beyond: multiple functions of the human mitochondrial transcription machinery. Mol. Cell 24, 813–825 (2006). - PubMed

MeSH terms