

Health-environment efficiency of diets shows nonlinear trends over 1990-2011
- PMID: 38332359
- PMCID: PMC10896724
- DOI: 10.1038/s43016-024-00924-z
Health-environment efficiency of diets shows nonlinear trends over 1990-2011
Abstract
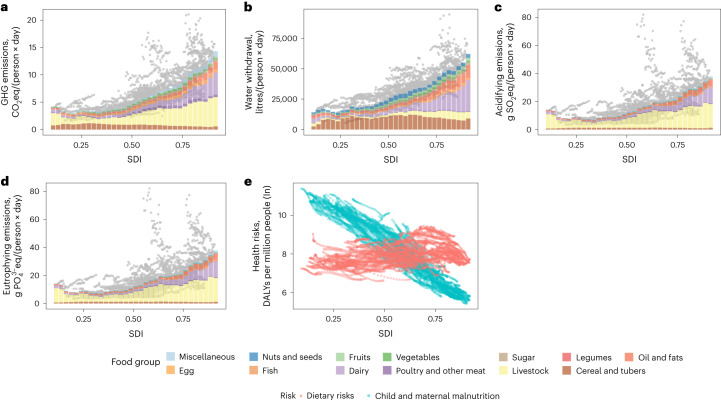
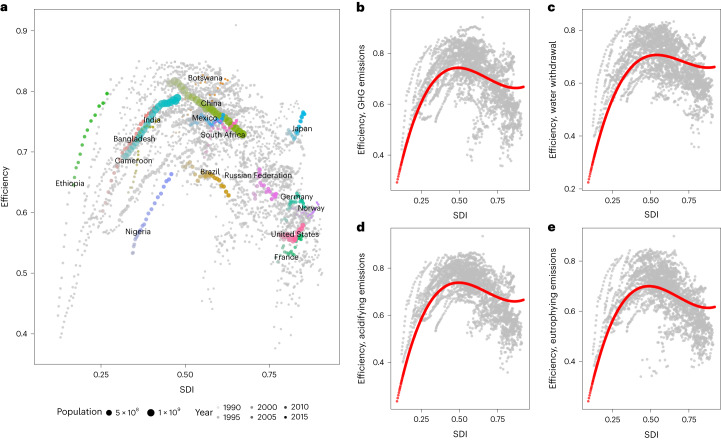
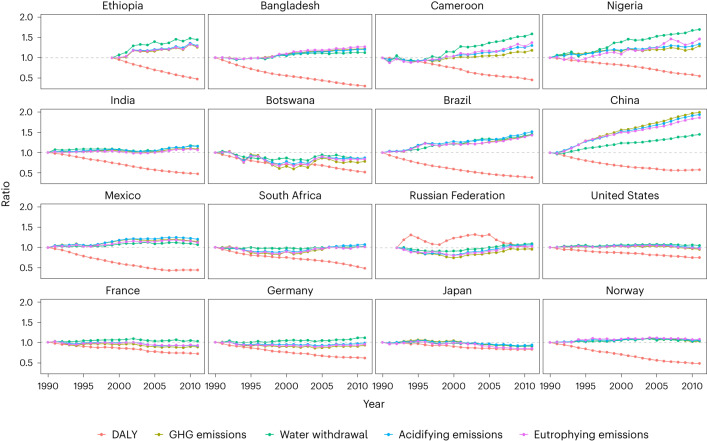
Understanding the impacts of diets on health and the environment, as well as their association with socio-economic development, is key to operationalize and monitor food systems shifts. Here we propose a health-environment efficiency indicator defined as a ratio of health benefits and four key food-related environmental impacts (greenhouse gas emissions, scarcity-weighted water withdrawal, acidifying and eutrophying emissions) to assess how diets have performed in supporting healthy lives in relation to environmental pollution and resource consumption across 195 countries from 1990 to 2011. We find that the health-environment efficiency of each environmental input follows a nonlinear path along the Socio-Demographic Index gradient representing different development levels. Health-environment efficiency first increases thanks to the elimination of child and maternal malnutrition through greater food supply, then decreases driven by additional environmental impacts from a shift to animal products, and finally shows a slow growth in some developed countries again as they shift towards healthier diets.
© 2024. The Author(s).
Conflict of interest statement
The authors declare no competing interests.
Figures
Similar articles
-
The Minderoo-Monaco Commission on Plastics and Human Health.Ann Glob Health. 2023 Mar 21;89(1):23. doi: 10.5334/aogh.4056. eCollection 2023. Ann Glob Health. 2023. PMID: 36969097 Free PMC article. Review.
-
Environmental impacts of dietary shifts in India: A modelling study using nationally-representative data.Environ Int. 2019 May;126:207-215. doi: 10.1016/j.envint.2019.02.004. Epub 2019 Feb 22. Environ Int. 2019. PMID: 30802638 Free PMC article.
-
Environmental impacts of dietary quality improvement in China.J Environ Manage. 2019 Jun 15;240:518-526. doi: 10.1016/j.jenvman.2019.03.106. Epub 2019 Apr 15. J Environ Manage. 2019. PMID: 30999146
-
Dietary environmental impacts of French adults are poorly related to their income levels or food insecurity status.Eur J Nutr. 2023 Sep;62(6):2541-2553. doi: 10.1007/s00394-023-03163-3. Epub 2023 May 16. Eur J Nutr. 2023. PMID: 37193932
-
Improving diet sustainability through evolution of food choices: review of epidemiological studies on the environmental impact of diets.Nutr Rev. 2017 Jan;75(1):2-17. doi: 10.1093/nutrit/nuw043. Nutr Rev. 2017. PMID: 27974596 Free PMC article. Review.
Cited by
-
Dietary therapies interlinking with gut microbes toward human health: Past, present, and future.Imeta. 2024 Aug 10;3(5):e230. doi: 10.1002/imt2.230. eCollection 2024 Oct. Imeta. 2024. PMID: 39429878 Free PMC article.
-
Low back pain trends attributable to high body mass index over the period 1990-2021 and projections up to 2036.Front Nutr. 2025 Jan 21;11:1521567. doi: 10.3389/fnut.2024.1521567. eCollection 2024. Front Nutr. 2025. PMID: 39906897 Free PMC article.
-
Comparative analysis of stroke burden between ages 20-54 and over 55 years: based on the global burden of disease study 2019.BMC Public Health. 2025 Apr 5;25(1):1293. doi: 10.1186/s12889-025-22460-6. BMC Public Health. 2025. PMID: 40188028 Free PMC article.
-
Sustainable HEalthy Diet practices: a cross-sectional analysis of an adult Greek sample.Nutr J. 2025 Feb 26;24(1):32. doi: 10.1186/s12937-025-01096-7. Nutr J. 2025. PMID: 40012074 Free PMC article.
-
Trends in Diet Quality by the Diagnosis of Chronic Diseases in Korea, 2013-2021: A Nationwide Representative Study.J Korean Med Sci. 2025 Jun 30;40(25):e133. doi: 10.3346/jkms.2025.40.e133. J Korean Med Sci. 2025. PMID: 40589359 Free PMC article.
References
-
- Fanzo J. Healthy and sustainable diets and food systems: the key to achieving Sustainable Development Goal 2? Food Ethics. 2019;4:159–174. doi: 10.1007/s41055-019-00052-6. - DOI
-
- The State of Food Insecurity in the World 2015 (FAO, 2015).
MeSH terms
LinkOut - more resources
Full Text Sources
