. 2024 Apr;22(2):107-118.
doi: 10.1007/s12021-024-09652-y. Epub 2024 Feb 9.

Network Representation of fMRI Data Using Visibility Graphs: The Impact of Motion and Test-Retest Reliability

Affiliations

Network Representation of fMRI Data Using Visibility Graphs: The Impact of Motion and Test-Retest Reliability

Govinda R Poudel et al. Neuroinformatics. 2024 Apr.

Abstract

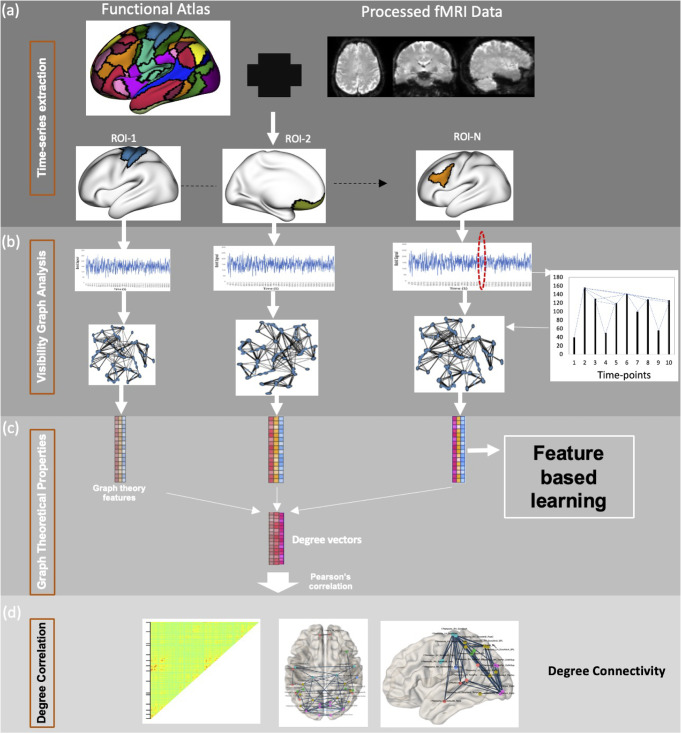
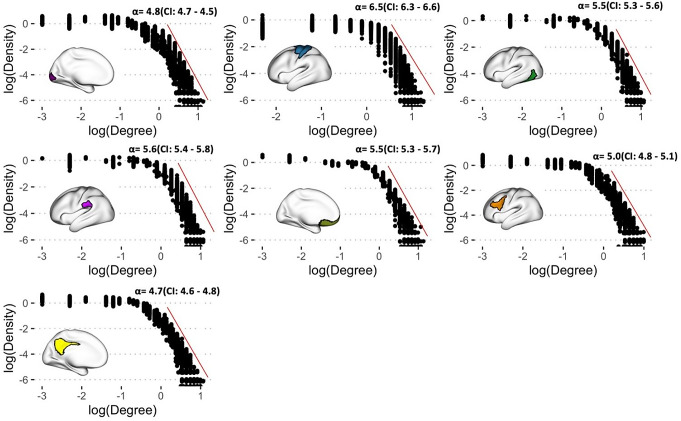
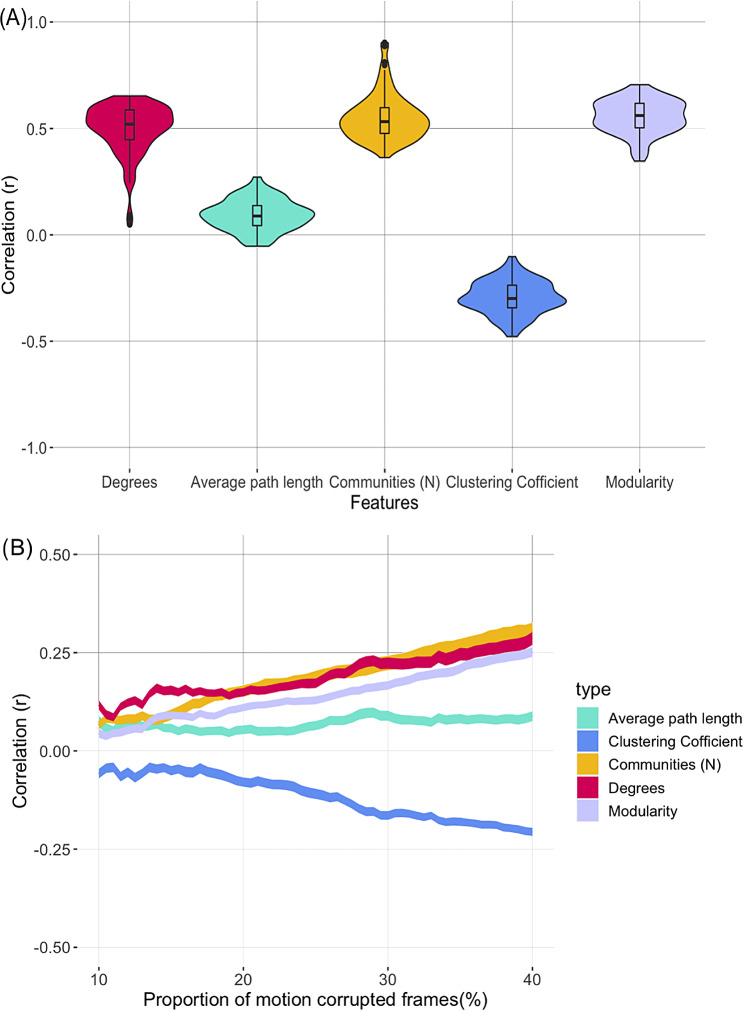
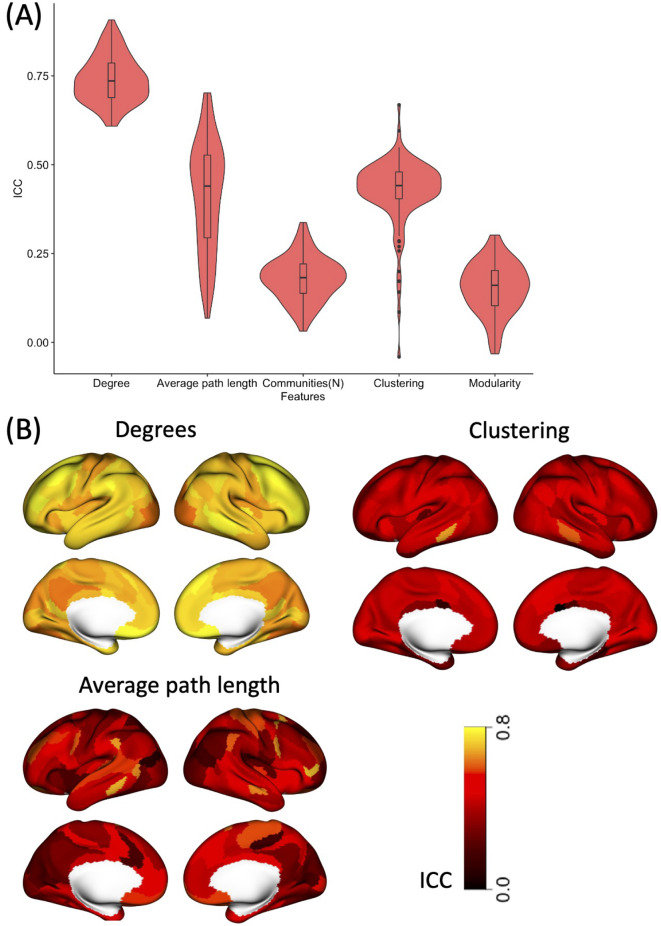
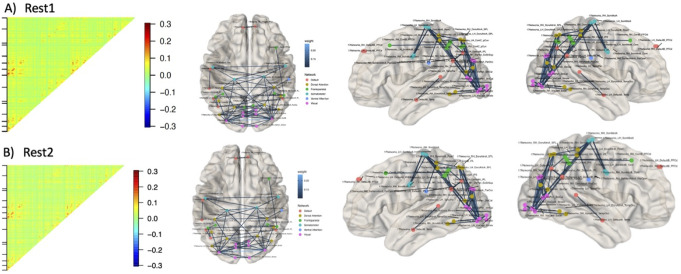
Visibility graphs provide a novel approach for analysing time-series data. Graph theoretical analysis of visibility graphs can provide new features for data mining applications in fMRI. However, visibility graphs features have not been used widely in the field of neuroscience. This is likely due to a lack of understanding of their robustness in the presence of noise (e.g., motion) and their test-retest reliability. In this study, we investigated visibility graph properties of fMRI data in the human connectome project (N = 1010) and tested their sensitivity to motion and test-retest reliability. We also characterised the strength of connectivity obtained using degree synchrony of visibility graphs. We found that strong correlation (r > 0.5) between visibility graph properties, such as the number of communities and average degrees, and motion in the fMRI data. The test-retest reliability (Intraclass correlation coefficient (ICC)) of graph theoretical features was high for the average degrees (0.74, 95% CI = [0.73, 0.75]), and moderate for clustering coefficient (0.43, 95% CI = [0.41, 0.44]) and average path length (0.41, 95% CI = [0.38, 0.44]). Functional connectivity between brain regions was measured by correlating the visibility graph degrees. However, the strength of correlation was found to be moderate to low (r < 0.35). These findings suggest that even small movement in fMRI data can strongly influence robustness and reliability of visibility graph features, thus, requiring robust motion correction strategies prior to data analysis. Further studies are necessary for better understanding of the potential application of visibility graph features in fMRI.

Keywords: Brain network analysis; Resting-state fMRI; Timeseries features; Visibility graph.


Conflict of interest statement

The authors declare no competing interests.

Figures

Fig. 1
Fig. 1
A framework for visibility graph analysis of fMRI data. a fMRI data is parcellated into different brain regions using an atlas b Average time series is extracted from all brain regions. This time-series data can be represented as a temporal landscape such that visibility between each data point can be identified. Visibility between two time points exists (i.e., an edge) if any other time point between them has a corresponding intensity below the line connecting the two time points (i.e., there is a direct line-of-sight between the peaks of time points) c The graphs generated using the visibility criteria has number of nodes equal to number of time points in the data. The graphs can then be processed using standard graph theoretical analysis methods to generate graph features. d The visibility graph degree vectors from each ROI can be correlated to generate a Degree Connectivity network, providing a new measure of functional connectivity
Fig. 2
Fig. 2
Log-log plot of weighted degree distribution of fMRI VG graphs. Each panel shows pooled degree distribution of average fMRI time series obtained from 7 example brain regions belonging to the resting-state networks. Alpha values (and 95% CI) of power laws fit for each region is also provided on the panels. Alpha values of power law fits were obtained for pooled distribution and averaged across participants
Fig. 3
Fig. 3
Association between percentage of motion corrupted data points and VG features across all the participants. A Violin plots showing summary statistics and density of correlation values between percentage of motion corrupted data points and VG features. The lower and upper hinges of boxplots within the violin plots correspond to the first and third quartiles (the 25th and 75th percentiles) of correlation values across the 114 brain regions. The density plots correspond to distributions of correlation values for the 114 brain regions B Changes in correlation between the percentage of fMRI data points associated with frame-wise displacement (FD) greater than 0.2 mm and VG features. Correlations are presented for different levels of motion in the data: from 10–40% of data corrupted by motion
Fig. 4
Fig. 4
Test-retest reliability of VG features. A Violin plots showing summary statistics and density of intraclass correlation (ICC) grouped by VG features. The lower and upper hinges of boxplots within the violin plots correspond to the first and third quartiles (the 25th and 75th percentiles) of correlation values across the 114 brain regions. The density plots correspond to distributions of correlation values for the 114 brain regions B Spatial distribution of ICC values across the brain for degrees, clustering coefficient, and average path length VG features. The colour-bar represents ICC values
Fig. 5
Fig. 5
Functional connectivity maps obtained using degree synchrony measure from A Rest1 and B Rest2 sessions. The maps were highly consistent between session. The connectivity matrix represents upper triangle of the connectivity matrix, showing correlation between 114 cortical brain regions within the Yeo-17 atlas

References

    1. Ahmadlou M, Adeli H. Visibility graph similarity: A new measure of generalized synchronization in coupled dynamic systems. Physica D Nonlinear Phenomena. 2012;241(4):326–332. doi: 10.1016/j.physd.2011.09.008. - DOI
    1. Braun U, Plichta MM, Esslinger C, Sauer C, Haddad L, Grimm O, Meyer-Lindenberg A. Test-retest reliability of resting-state connectivity network characteristics using fMRI and graph theoretical measures. Neuroimage. 2012;59(2):1404–1412. doi: 10.1016/j.neuroimage.2011.08.044. - DOI - PubMed
    1. Donner RV, Donges JF. Visibility graph analysis of geophysical time series: Potentials and possible pitfalls. Acta Geophysica. 2012;60(3):589–623. doi: 10.2478/s11600-012-0032-x. - DOI
    1. Gao ZK, Feng YH, Ma C, Ma K, Cai Q, Initia ADN. Disrupted time-dependent and Functional Connectivity Brain Network in Alzheimer’s Disease: A resting-state fMRI study based on visibility graph. Current Alzheimer Research. 2020;17(1):69–79. doi: 10.2174/1567205017666200213100607. - DOI - PubMed
    1. Glasser MF, Smith SM, Marcus DS, Andersson JLR, Auerbach EJ, Behrens TEJ, Van Essen DC. The human Connectome Project’s neuroimaging approach. Nature Neuroscience. 2016;19(9):1175–1187. doi: 10.1038/nn.4361. - DOI - PMC - PubMed

LinkOut - more resources