

Taste aversion learning during successive negative contrast
- PMID: 38332437
- PMCID: PMC11408539
- DOI: 10.3758/s13420-024-00626-3
Taste aversion learning during successive negative contrast
Abstract
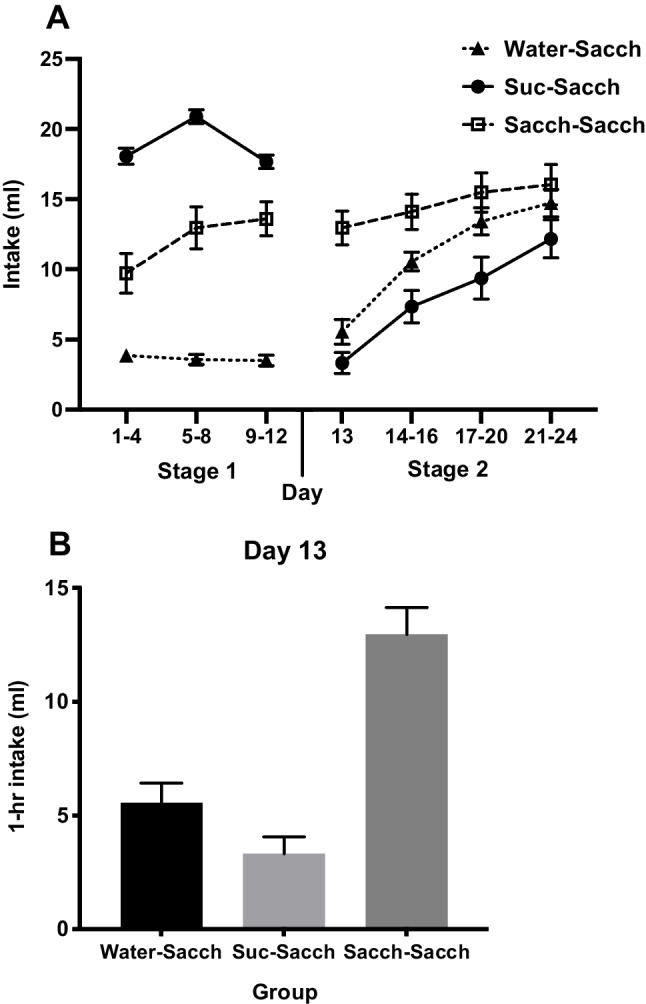
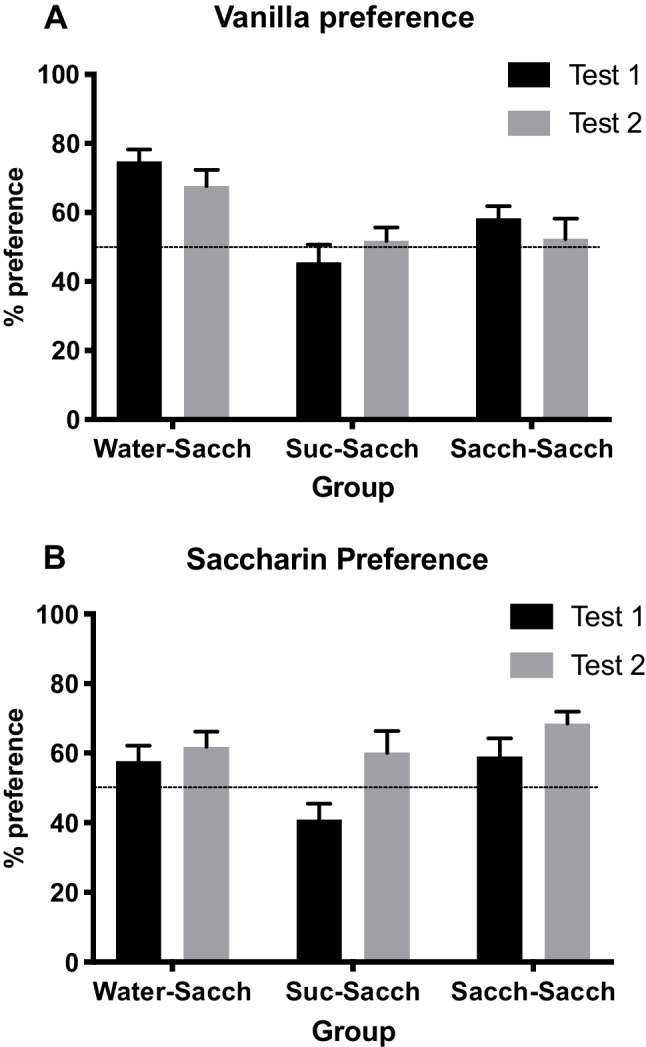
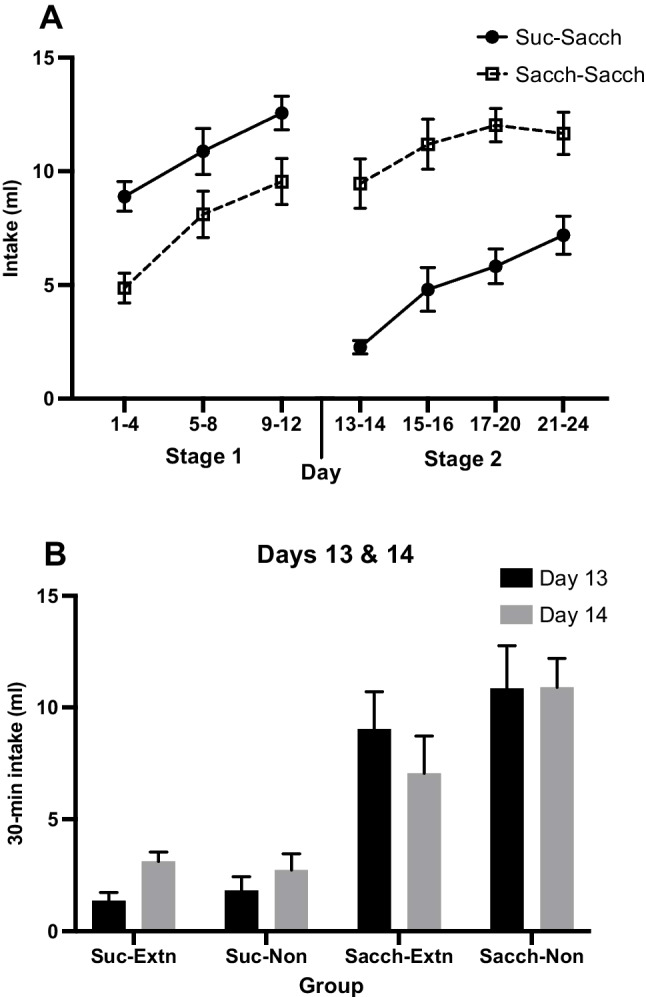
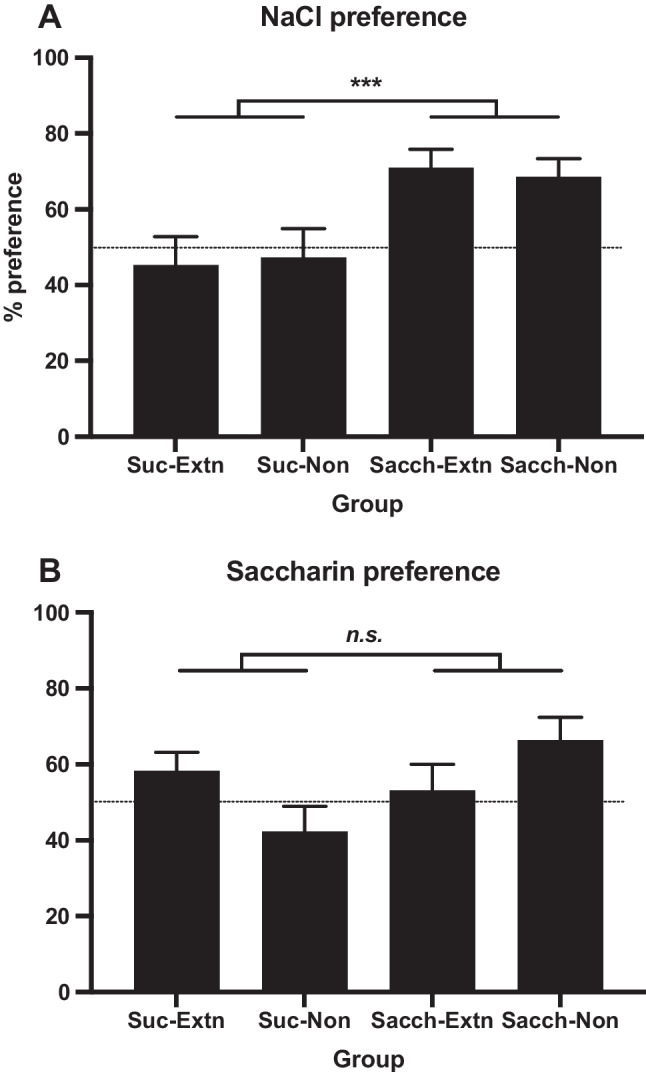
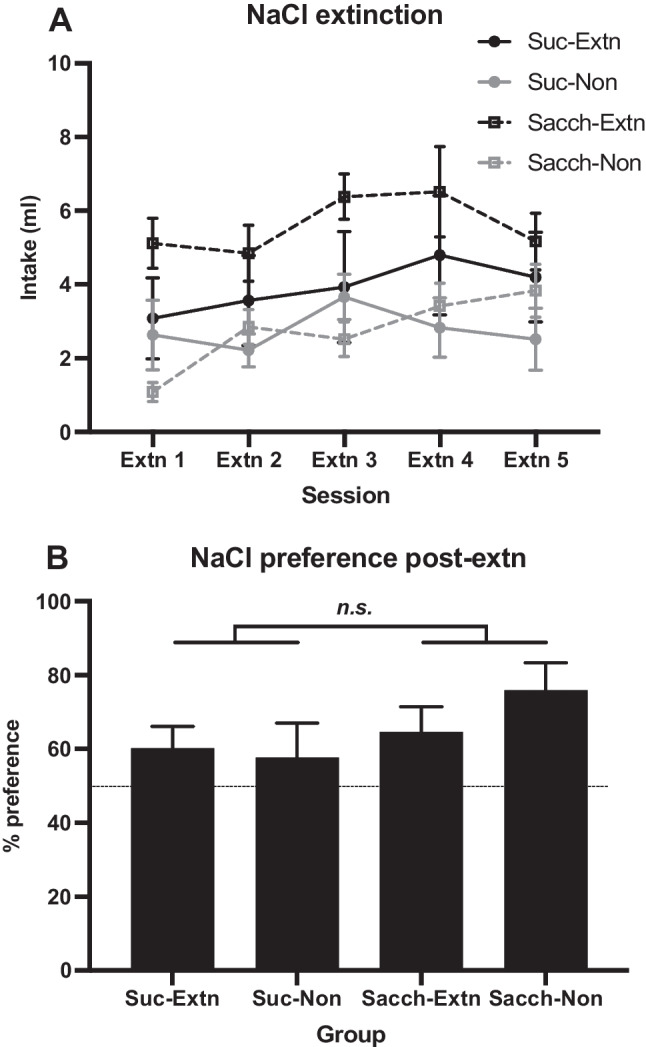
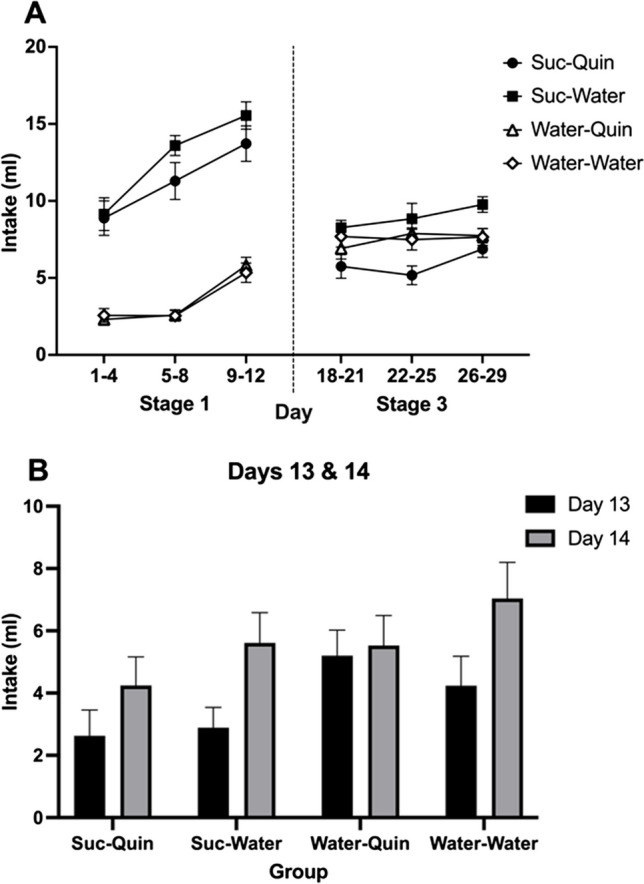
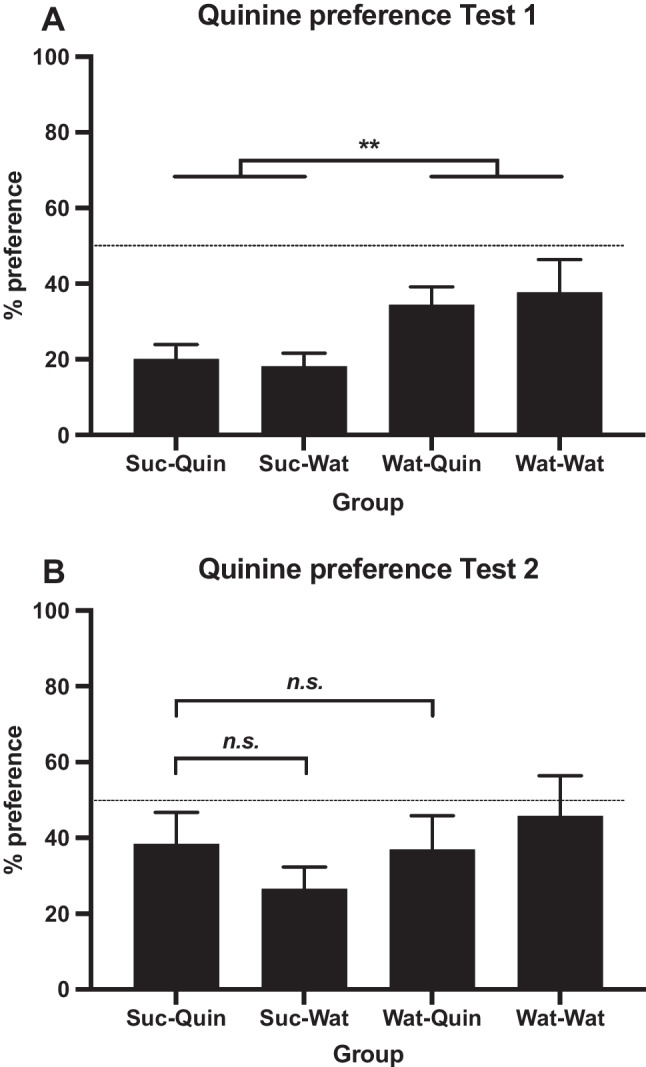
Previous experiments found that acceptance of saccharin by rats was reduced if they had prior experience of sucrose or some other highly palatable solution. This study tested whether such successive negative contrast (SNC) effects involve acquisition of an aversion to the new taste. In three experiments, rats were switched from sucrose exposure in Stage 1 to a less palatable solution containing a new taste in Stage 2. In Experiments 1 and 2, a novel flavor was added to a saccharin solution at the start of Stage 2. In Experiment 1, preference tests revealed a weak aversion to the added vanilla flavor in the Suc-Sacch group, while in Experiment 2 an aversion was found in the Suc-Sacch group to the salty flavor that was used, compared with controls given access either saccharin or water in Stage 1. In Experiment 3, the Suc-Quin group, given quinine solution in Stage 2, displayed a greater aversion to quinine than a Water-Quin control group. These results support the suggestion that taste aversion learning plays a role in the initial suppression of intakes in a qualitative consummatory SNC effect. However, in the light of other evidence, it seems that the unusual persistence of successive negative contrast when rats are switched from sucrose to saccharin is not due to a long-lasting reduction in the value of saccharin.
Keywords: Negative contrast; Rats; Saccharin; Sucrose; Taste aversion.
© 2024. The Author(s).
Figures
References
-
- Boakes, R. A., Rehn, S., Badolato, C., & Rooney, K. B. (2020). Reduced acceptance of saccharin solutions by rats previously consuming more highly palatable solutions. Physiology & Behavior,218, Article 112822. 10.1016/j.physbeh.2020.112822 - PubMed
-
- Crespi, L. P. (1942). Quantitative variation of incentive and performance in the white rat. The American Journal of Psychology,55, 467–517. 10.2307/1417120
-
- Dess, N. K. (1993). Saccharin’s aversive taste in rats: Evidence and implications. Neuroscience & Biobehavioral Reviews,17(4), 359–372. - PubMed
-
- Dess, N. K., Chapman, C. D., & Minor, T. R. (1988). Inescapable shock increases finickiness about drinking quinine-adulterated water in rats. Learning and Motivation,19, 408–424. 10.1016/0023-9690(88)90048-3
-
- Durlach, P. J., & Rescorla, R. A. (1980). Potentiation rather than overshadowing in flavor-aversion learning: An analysis in terms of within-compound associations. Journal of Experimental Psychology: Animal Behavior Processes,6, 175–187. 10.1037/0097-7403.6.2.175 - PubMed
Publication types
MeSH terms
Substances
Grants and funding
LinkOut - more resources
Full Text Sources
