. 2024 Jan 9:14:1319986.
doi: 10.3389/fimmu.2023.1319986. eCollection 2023.

13C-Metabolic flux analysis detected a hyperoxemia-induced reduction of tricarboxylic acid cycle metabolism in granulocytes during two models of porcine acute subdural hematoma and hemorrhagic shock

Affiliations

13C-Metabolic flux analysis detected a hyperoxemia-induced reduction of tricarboxylic acid cycle metabolism in granulocytes during two models of porcine acute subdural hematoma and hemorrhagic shock

Eva-Maria Wolfschmitt et al. Front Immunol. .

Abstract

Introduction: Supplementation with increased inspired oxygen fractions has been suggested to alleviate the harmful effects of tissue hypoxia during hemorrhagic shock (HS) and traumatic brain injury. However, the utility of therapeutic hyperoxia in critical care is disputed to this day as controversial evidence is available regarding its efficacy. Furthermore, in contrast to its hypoxic counterpart, the effect of hyperoxia on the metabolism of circulating immune cells remains ambiguous. Both stimulating and detrimental effects are possible; the former by providing necessary oxygen supply, the latter by generation of excessive amounts of reactive oxygen species (ROS). To uncover the potential impact of increased oxygen fractions on circulating immune cells during intensive care, we have performed a 13C-metabolic flux analysis (MFA) on PBMCs and granulocytes isolated from two long-term, resuscitated models of combined acute subdural hematoma (ASDH) and HS in pigs with and without cardiovascular comorbidity.

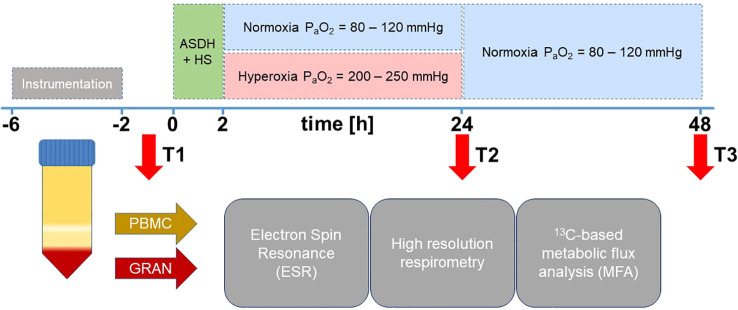
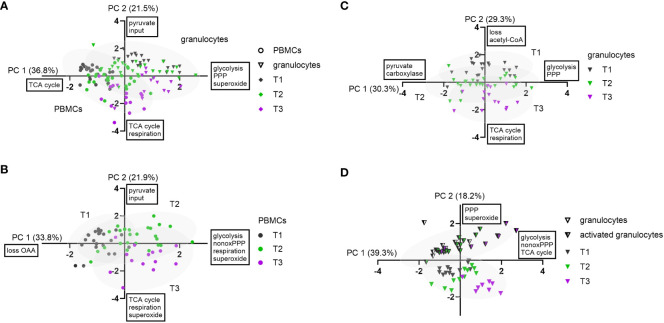
Methods: Swine underwent resuscitation after 2 h of ASDH and HS up to a maximum of 48 h after HS. Animals received normoxemia (PaO2 = 80 - 120 mmHg) or targeted hyperoxemia (PaO2 = 200 - 250 mmHg for 24 h after treatment initiation, thereafter PaO2 as in the control group). Blood was drawn at time points T1 = after instrumentation, T2 = 24 h post ASDH and HS, and T3 = 48 h post ASDH and HS. PBMCs and granulocytes were isolated from whole blood to perform electron spin resonance spectroscopy, high resolution respirometry and 13C-MFA. For the latter, we utilized a parallel tracer approach with 1,2-13C2 glucose, U-13C glucose, and U-13C glutamine, which covered essential pathways of glucose and glutamine metabolism and supplied redundant data for robust Bayesian estimation. Gas chromatography-mass spectrometry further provided multiple fragments of metabolites which yielded additional labeling information. We obtained precise estimations of the fluxes, their joint credibility intervals, and their relations, and characterized common metabolic patterns with principal component analysis (PCA).

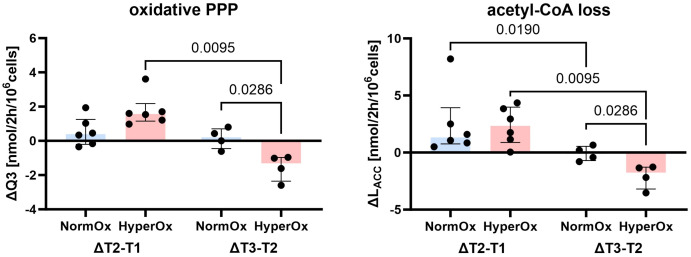
Results: 13C-MFA indicated a hyperoxia-mediated reduction in tricarboxylic acid (TCA) cycle activity in circulating granulocytes which encompassed fluxes of glutamine uptake, TCA cycle, and oxaloacetate/aspartate supply for biosynthetic processes. We further detected elevated superoxide levels in the swine strain characterized by a hypercholesterolemic phenotype. PCA revealed cell type-specific behavioral patterns of metabolic adaptation in response to ASDH and HS that acted irrespective of swine strains or treatment group.

Conclusion: In a model of resuscitated porcine ASDH and HS, we saw that ventilation with increased inspiratory O2 concentrations (PaO2 = 200 - 250 mmHg for 24 h after treatment initiation) did not impact mitochondrial respiration of PBMCs or granulocytes. However, Bayesian 13C-MFA results indicated a reduction in TCA cycle activity in granulocytes compared to cells exposed to normoxemia in the same time period. This change in metabolism did not seem to affect granulocytes' ability to perform phagocytosis or produce superoxide radicals.

Keywords: Bayesian modeling; glucose metabolism; glutamine utilization; hyperoxia; immunometabolism; mass isotopomer distribution; peripheral blood mononuclear cells; reactive oxygen species.


Conflict of interest statement

The authors declare that the research was conducted in the absence of any commercial or financial relationships that could be construed as a potential conflict of interest.

Figures

Figure 1
Figure 1
Experimental setup. After instrumentation, pigs were subjected to ASDH and HS by injection of 0.1 mL/kg autologous blood into the subdural space and passive removal of 30% of the calculated blood volume. After 2 h of ASDH and shock, swine underwent resuscitation comprising retransfusion of shed blood, fluid resuscitation and i.v. NoA titration to maintain MAP at pre-shock levels and CPP ≥ 75 mmHg. Intensive care was maintained up to a maximum of 48 h. Animals were randomly assigned to control (normoxemia, target PaO2 = 80 – 120 mmHg) or targeted hyperoxemia (target PaO2 = 200 – 250 mmHg for 24 h after treatment initiation. Thereafter, target PaO2 as in the control group). Resuscitation was maintained to a maximum of 48 h after shock before experiment termination. Blood was drawn at time points T1 = after instrumentation, T2 = 24 h post ASDH and HS, and T3 = 48 h post ASDH and HS. PBMCs and granulocytes were isolated from whole blood to perform ESR for superoxide quantification, high resolution respirometry and 13C-MFA.
Figure 2
Figure 2
Overview over the pathways covered by the Bayesian 13C-MFA model. Left: PPP model. Right: TCA cycle model. Glyc: glycolytic flux. Q: flux within the PPP. F: flux within the TCA cycle. L: flux of metabolite leaving the network, e.g. for biosynthetic processes. Additional considered metabolite inputs (pyruvate, OAA, acetyl-CoA) and losses (pyruvate) are not shown in the graphic, but are presented and visualized in Supplementary Figure 1 . The Figure is taken from Wolfschmitt et al. (20), with permission.
Figure 3
Figure 3
Effects of targeted hyperoxia on circulating granulocytes. Triangles with filled symbols indicate data originating from BMW animals, and empty symbols FBM data. Bars indicate the median with IQR (NormOx: blue bars, HyperOx: red bars). (A) The increase in TCA cycle activity from the first to the second measurement time point was reduced after cells were exposed to targeted hyperoxia. (B) Differences in time-related behavior of fluxes between NormOx and HyperOx groups. On the left side of each graph is the change in flux between T1 and T2, on the right side the change between T2 and T3. ΔT2-T1: NormOx (FBM n = 3, BMW n = 6), HyperOx (FBM n = 6, BMW n = 6), and ΔT3-T2: NormOx (FBM n = 2, BMW n = 4), HyperOx (FBM n = 6, BMW n = 5). (C) Absolute flux values of central TCA cycle fluxes at T2. Graphs including all measurement time points are available in Supplementary Figure 2 . NormOx (FBM n = 7, BMW n = 6), HyperOx (FBM n = 7, BMW n = 6). (D) Absolute values of central TCA cycle fluxes at T2 in isolated granulocytes after ex vivo stimulation with E.coli bioparticles. Graphs including all measurement time points are available in Supplementary Figure 3 . NormOx (BMW n = 6) and HyperOx (BMW n = 6). (E) Differences in time-related behavior of fluxes between NormOx and HyperOx groups in isolated granulocytes after stimulation with E.coli bioparticles. ΔT2-T1: NormOx (BMW n = 6), HyperOx (BMW n = 6), and ΔT3-T2: NormOx (BMW n = 4), HyperOx (BMW n = 4). F3: flux from α-ketoglutarate to oxaloacetate, F4: oxaloacetate to α-ketoglutarate. F8: glutamate to α-ketoglutarate. LOAA: flux indicating amount of oxaloacetate/aspartate leaving the investigated network. dTAL: net flux in non-oxidative PPP activity (Q9-Q10). P-values are indicated in the graphs. We performed Mann-Whitney U tests for intergroup differences, and Kruskal-Wallis rank sum tests for time-related effects.
Figure 4
Figure 4
Effects of targeted hyperoxia on circulating PBMCs of BMW animals. Bars indicate the median with IQR (NormOx: blue bars, HyperOx: red bars). Fluxes with differences in time-related development between NormOx (ΔT2-T1: n = 6, ΔT3-T2: n = 4) and HyperOx (ΔT2-T1: n = 6, ΔT3-T2: n = 4) groups in isolated PBMCs from BMW animals. Q3: flux representing oxidative PPP activity. LACC: flux indicating amount of acetyl-CoA leaving the investigated network. P-values are indicated in the graphs. We performed Mann-Whitney U tests for intergroup differences, and Kruskal-Wallis rank sum tests for time-related effects.
Figure 5
Figure 5
Strain-specific effects of ASDH and HS on immunometabolism. Diamonds indicate non-cell type-specific data. PBMCs are depicted as circles and granulocytes as triangles with filled symbols indicating data originating from BMW animals, and empty symbols FBM data. (A) O2 •− production by PBMCs and granulocytes and O2 •− concentration in whole blood as determined by ESR at the indicated measurement time points. Averaged noradrenalin (NoA) amount required during the experiment by FBM and BMW animals. PBMCs and granulocyte production: T1 (FBM n = 12, BMW n = 14), T2 (FBM n = 12, BMW n = 12), T3 (FBM n = 9, BMW n = 9). Whole blood concentration: T1 (FBM n = 12, BMW n = 14), T2 (FBM n = 10, BMW n = 12), T3 (FBM n = 9, BMW n = 8). NoA administration: FBM n = 14, BMW n = 12. (B) Phagocytic activity of E.coli bioparticle-stimulated granulocytes. Data is either presented as normalized mean fluorescence intensity (nMFI) or fraction of phagocytic granulocytes within the granulocyte subset (6D10+ Phago+). T1 (FBM n = 10, BMW n = 14), T2 (FBM n = 12, BMW n = 12), T3 (FBM n = 9, BMW n = 9). (C) Fluxes with differences in time-related development in granulocytes between FBM and BMW groups. On the left side of each graph is the change in flux between T1 and T2, on the right side the change between T2 and T3. ΔT2-T1: FBM n = 9, BMW n = 12, and ΔT3-T2: FBM n = 8, BMW n = 9. (D) Fluxes with differences in time-related development in PBMCs between FBM and BMW groups. ΔT2-T1: FBM n = 13, BMW n = 12, and ΔT3-T2: FBM n = 9, BMW n = 8. Q3: flux representing oxidative PPP activity. F2: pyruvate-derived fraction of acetyl-CoA. F4: flux from oxaloacetate to α-ketoglutarate. P-values are indicated in the graphs. We performed Mann-Whitney U tests for intergroup differences, and Kruskal-Wallis rank sum tests for time-related effects.
Figure 6
Figure 6
Principal component analysis of experimental data. Granulocytes are depicted as triangles and PBMCs as circles. Stimulated granulocytes are indicated as half-filled triangles. For the measurement time points, the following color code was chosen: T1: grey; T2: green; T3: violet. PC 1 and PC 2 scores were plotted in a x-y graph for each dataset. (A) Combined data from granulocytes and PBMCs (n = 123, FBM and BMW). Granulocyte and PBMC data are each depicted with their 95% confidence interval (CI) as grey ellipses. (B) PCA of combined PBMC data (n = 63, FBM and BMW). Data from each measurement time point are shown with their 95% CI. (C) PCA of combined granulocyte data (n = 60, FBM and BMW). Data from each measurement time point are shown with their 95% CI. (D) PCA of combined data of BMW granulocytes and E.coli bioparticle-stimulated granulocytes (n = 64, BMW). Data from granulocytes and stimulated granulocytes are each presented with their 95% CI.

Similar articles

References

    1. Barbee RW, Reynolds PS, Ward KR. Assessing shock resuscitation strategies by oxygen debt repayment. Shock (2010) 33:113–22. doi: 10.1097/SHK.0b013e3181b8569d - DOI - PubMed
    1. Veenith TV, Carter EL, Geeraerts T, Grossac J, Newcombe VF, Outtrim J, et al. . Pathophysiologic mechanisms of cerebral ischemia and diffusion hypoxia in traumatic brain injury. JAMA Neurol (2016) 73:542–50. doi: 10.1001/jamaneurol.2016.0091 - DOI - PubMed
    1. Vincent J-L, de Backer D. Circulatory shock. N Engl J Med (2013) 369:1726–34. doi: 10.1056/NEJMra1208943 - DOI - PubMed
    1. Madias JE, Madias NE, Hood WB. Precordial ST-segment mapping. 2. Effects of oxygen inhalation on ischemic injury in patients with acute myocardial infarction. Circulation (1976) 53:411–7. doi: 10.1161/01.cir.53.3.411 - DOI - PubMed
    1. Hartmann C, Loconte M, Antonucci E, Holzhauser M, Hölle T, Katzsch D, et al. . Effects of hyperoxia during resuscitation from hemorrhagic shock in swine with preexisting coronary artery disease. Crit Care Med (2017) 45:e1270–9. doi: 10.1097/CCM.0000000000002767 - DOI - PubMed

Publication types

LinkOut - more resources