The 'analysis of gene expression and biomarkers for point-of-care decision support in Sepsis' study; temporal clinical parameter analysis and validation of early diagnostic biomarker signatures for severe inflammation andsepsis-SIRS discrimination
- PMID: 38332914
- PMCID: PMC10850284
- DOI: 10.3389/fimmu.2023.1308530
The 'analysis of gene expression and biomarkers for point-of-care decision support in Sepsis' study; temporal clinical parameter analysis and validation of early diagnostic biomarker signatures for severe inflammation andsepsis-SIRS discrimination
Abstract
Introduction: Early diagnosis of sepsis and discrimination from SIRS is crucial for clinicians to provide appropriate care, management and treatment to critically ill patients. We describe identification of mRNA biomarkers from peripheral blood leukocytes, able to identify severe, systemic inflammation (irrespective of origin) and differentiate Sepsis from SIRS, in adult patients within a multi-center clinical study.
Methods: Participants were recruited in Intensive Care Units (ICUs) from multiple UK hospitals, including fifty-nine patients with abdominal sepsis, eighty-four patients with pulmonary sepsis, forty-two SIRS patients with Out-of-Hospital Cardiac Arrest (OOHCA), sampled at four time points, in addition to thirty healthy control donors. Multiple clinical parameters were measured, including SOFA score, with many differences observed between SIRS and sepsis groups. Differential gene expression analyses were performed using microarray hybridization and data analyzed using a combination of parametric and non-parametric statistical tools.
Results: Nineteen high-performance, differentially expressed mRNA biomarkers were identified between control and combined SIRS/Sepsis groups (FC>20.0, p<0.05), termed 'indicators of inflammation' (I°I), including CD177, FAM20A and OLAH. Best-performing minimal signatures e.g. FAM20A/OLAH showed good accuracy for determination of severe, systemic inflammation (AUC>0.99). Twenty entities, termed 'SIRS or Sepsis' (S°S) biomarkers, were differentially expressed between sepsis and SIRS (FC>2·0, p-value<0.05).
Discussion: The best performing signature for discriminating sepsis from SIRS was CMTM5/CETP/PLA2G7/MIA/MPP3 (AUC=0.9758). The I°I and S°S signatures performed variably in other independent gene expression datasets, this may be due to technical variation in the study/assay platform.
Keywords: SIRS; biomarker; diagnostic; mRNA signature; sepsis; severe inflammation.
Copyright © 2024 Szakmany, Fitzgerald, Garlant, Whitehouse, Molnar, Shah, Tong, Hall, Ball and Kempsell.
Conflict of interest statement
The authors declare that the research was conducted in the absence of any commercial or financial relationships that could be construed as a potential conflict of interest. The author(s) declared that they were an editorial board member of Frontiers, at the time of submission. This had no impact on the peer review process and the final decision.
Figures


 , PLMN S
  , SIRS DNS
  , SIRS S
  , ABDM DNS
  , ABDM S
  .
.
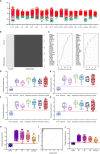
 versus combined SIRS&Sepsis biomarker groups
  (each symbol depicting an individual within each group) (B) volcano plot of log10 p-value vs log fold-change of all gene entities, using a 2-fold change cutoff and with select I°I genes highlighted (C) PCA analysis of CNTRL
  versus combined SIRS&Sepsis biomarker groups
  (each symbol depicting an individual within each group) using select I°I genes only (from
Table 2
) (D) heat map of select I°I biomarkers from
Table 2
across all control, SIRS, ABDM and PLMN sepsis groups stratified by day and prognosis (died/survived).

 , SIRS
  , Sepsis
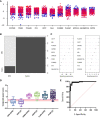
  (B) Random forest classification of validation data into controls and inflammation groups with ‘mtry’ of 31, ‘ntree’ of 2001 (C) Visualization of random forest models features of importance ranked by mean decrease accuracy and mean decrease Gini score (D) I°I candidate panel: ADM+CD177+FAM20A+ITGA7+MMP9+OLAH (E) I°I candidate panel: ADM+FAM20A+ OLAH+ITGA7+MPP9 (F) I°I candidate panel: ADM+OLAH+ FAM20A (G) I°I candidate panel: OLAH+FAM20A (H) I°I candidate panel: ADM+FAM20A+ OLAH+ITGA7+MMP9 across all time-points (I) ROC curves of ADM+FAM20A+OLAH ITGA7+MMP9 and OLAH+FAM20A comparing CNTRL vs SIRS/sepsis across day 1, day 2, day 5 and discharge time points (J) I°I candidate panel: OLAH+FAM20A across all timepoints.
 , ABDM
  , PLMN
  . (B) Random forest classification of validation data into SIRS and Sepsis ‘mtry’ of 11, ‘ntree’ of 2001 (C) Visualization of random forest models features of importance ranked by mean decrease accuracy and mean decrease Gini score (D) S°S candidate panel: CETP+CMTM5+MIA-MPP3-PLA2G7 (E) ROC curves of CETP+CMTM5+MIA-MPP3-PLA2G7 for SIRS vs Sepsis, SIRS vs Abdominal sepsis and SIRS vs Pulmonary sepsis comparisons.
 , SIRS
  , SEPSIS
  (B) the S°S Signature; SIRS
  , PLMN SEPSIS
  , ABDM SEPSIS
  .
.

 , healthy controls and non-septic shock
  , non septic shock and septic shock
  (B) GSE9960 comparing healthy controls and sepsis (mixed infection)
  , healthy controls and sepsis (gram positive)
  , healthy controls and sepsis (gram negative)
  healthy controls and sepsis
  (C) GSE154918 comparing healthy controls and sepsis
  , healthy controls and follow up of sepsis
  , healthy controls and septic shock
  healthy controls and follow up of septic shock
  (D) GSE154918 comparing uncomplicated infection and sepsis
  , uncomplicated infection and follow up of sepsis
  , uncomplicated infection and septic shock
  , uncomplicated infection and follow up of septic shock
  .
.Similar articles
-
Circulating Plasma microRNAs can differentiate Human Sepsis and Systemic Inflammatory Response Syndrome (SIRS).Sci Rep. 2016 Jun 20;6:28006. doi: 10.1038/srep28006. Sci Rep. 2016. PMID: 27320175 Free PMC article.
-
Diagnostic and prognostic value of presepsin vs. established biomarkers in critically ill patients with sepsis or systemic inflammatory response syndrome.Clin Chem Lab Med. 2018 Mar 28;56(4):658-668. doi: 10.1515/cclm-2017-0839. Clin Chem Lab Med. 2018. PMID: 29176018
-
Development and validation of a diagnostic model for early differentiation of sepsis and non-infectious SIRS in critically ill children - a data-driven approach using machine-learning algorithms.BMC Pediatr. 2018 Mar 15;18(1):112. doi: 10.1186/s12887-018-1082-2. BMC Pediatr. 2018. PMID: 29544449 Free PMC article. Clinical Trial.
-
Interpreting Laboratory Tests in Infection: Making Sense of Biomarkers in Sepsis and Systemic Inflammatory Response Syndrome for Intensive Care Unit Patients.Crit Care Nurs Clin North Am. 2017 Mar;29(1):119-130. doi: 10.1016/j.cnc.2016.09.004. Epub 2016 Dec 14. Crit Care Nurs Clin North Am. 2017. PMID: 28160953 Review.
-
Biomarkers predicting sepsis in polytrauma patients: Current evidence.Injury. 2013 Dec;44(12):1680-92. doi: 10.1016/j.injury.2013.09.024. Epub 2013 Sep 20. Injury. 2013. PMID: 24119650 Review.
Cited by
-
Sialyl Lewisx Glycomimetics as E- and P-Selectin Antagonists Targeting Hyperinflammation.ACS Med Chem Lett. 2024 Nov 9;16(1):64-71. doi: 10.1021/acsmedchemlett.4c00452. eCollection 2025 Jan 9. ACS Med Chem Lett. 2024. PMID: 39811128
-
Molecular endotypes in sepsis: integration of multicohort transcriptomics based on RNA sequencing.J Intensive Care. 2025 May 30;13(1):30. doi: 10.1186/s40560-025-00802-1. J Intensive Care. 2025. PMID: 40448231 Free PMC article.
-
Integrating bioinformatics and machine learning for comprehensive analysis and validation of diagnostic biomarkers and immune cell infiltration characteristics in pediatric septic shock.Sci Rep. 2025 Mar 26;15(1):10456. doi: 10.1038/s41598-025-95028-4. Sci Rep. 2025. PMID: 40140612 Free PMC article.
-
Revolutionizing cancer treatment: the rise of personalized immunotherapies.Discov Oncol. 2024 Dec 18;15(1):756. doi: 10.1007/s12672-024-01638-1. Discov Oncol. 2024. PMID: 39692978 Free PMC article. Review.
References
-
- Daniels R, Nutbeam T. The yellow manual 6th edition. In: The UK sepsis trust. London: United Kingdom Sepsis Trust.
-
- YHEC . The cost of sepsis care in the UK: final report. London: United Kingdom Sepsis Trust. (2017).
Publication types
MeSH terms
Substances
LinkOut - more resources
Full Text Sources
Medical
Molecular Biology Databases
Miscellaneous

