. 2024 Feb 3:16:203-218.
doi: 10.2147/IJWH.S439335. eCollection 2024.

Significant Prognostic Factor at Age Cut-off of 73 Years for Advanced Ovarian Serous Cystadenocarcinoma Patients: Insights from Real-World Study

Affiliations

Significant Prognostic Factor at Age Cut-off of 73 Years for Advanced Ovarian Serous Cystadenocarcinoma Patients: Insights from Real-World Study

Ke Zhang et al. Int J Womens Health. .

Abstract

Objective: The objective of this research was to determine the age cut-off for worse prognosis and investigate age-related differentially expressed genes (DEGs) in patients with advanced ovarian serous cystadenocarcinoma (AOSC).

Methods: In this research, we included a cohort of 20,846 patients diagnosed with AOSC, along with RNA-seq data from 374 patients in publicly available databases. Then we used the X-tile software to determine the age cut-off and stratified the patients into young and old groups. We utilized propensity score matching (PSM) to balance baseline between the young and old groups. Furthermore, we conducted an enrichment analysis of DEGs between the two age groups using Kyoto Encyclopedia of Genes and Genomes (KEGG) pathways and gene ontology (GO) to identify dysregulated pathways. To evaluate the potential prognostic value of the DEGs, we performed survival analysis, such as Kaplan-Meier analysis and Log rank test.

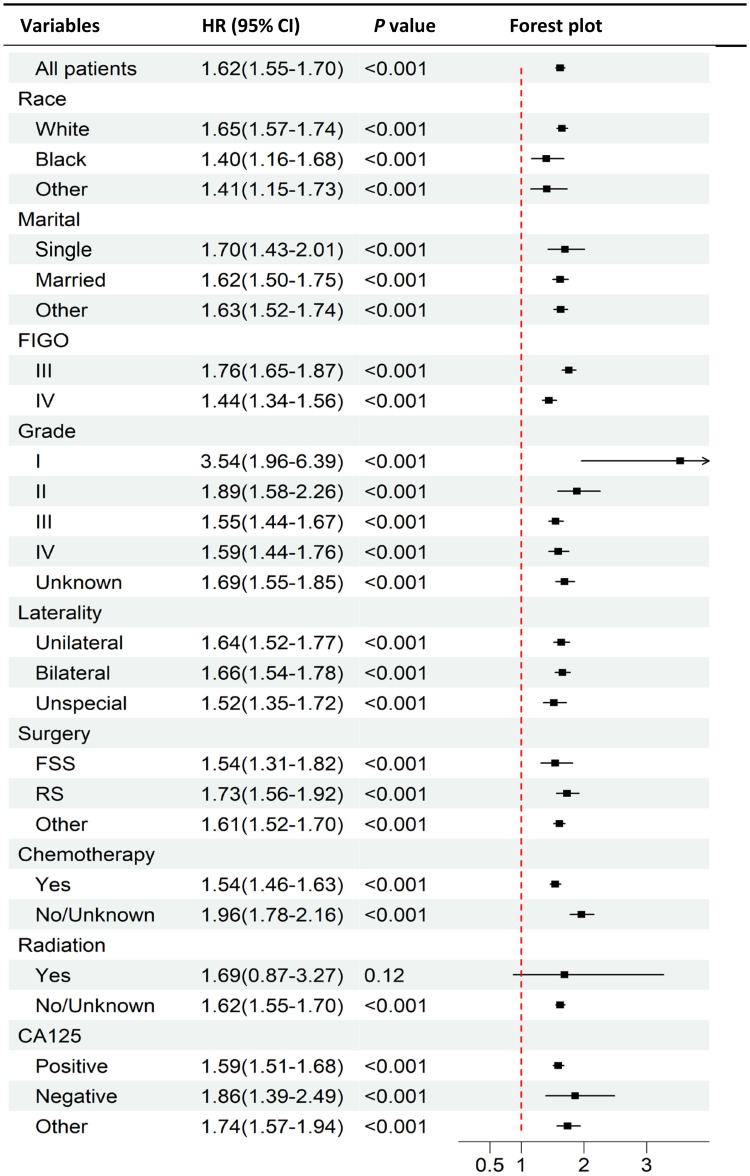
Results: We stratified the patients into young group (n=16,336) and old group (n=4510) based on the cut-off age of 73 years by X-tile software. Age over 73 years was identified as an independent risk factor for overall survival (OS) and cancer-specific survival (CSS). Next, we identified 436 DEGs and found that the neurotrophin signaling pathway and translation factor activity were associated with prognosis outcomes. Among the top 10 hub genes (RELA, NFKBIA, TRAF6, IRAK2, TAB3, AKT1, TBP, EIF2S2, MAPK10, and SUPT3H), RELA, TAB3, AKT1, TBP, and SUPT3H were found to be significantly associated with poor prognosis in old patients with AOSC.

Conclusion: Our study determined 73 years as the cutoff value for age in patients with AOSC. RELA, TAB3, AKT1, TBP, and SUPT3H were identified as age-related DEGs that could contribute to the poor prognosis of older patients with AOSC.

Keywords: advanced ovarian serous cystadenocarcinoma; age; prognosis; propensity score matching; real-world study.


Conflict of interest statement

There are no conflicts of interest regarding the publication of this article.

Figures

Figure 1
Figure 1
Flowchart for screening patients.
Figure 2
Figure 2
X-Tile analysis of survival data from the SEER database. (A) The X-Tile plot displays red coloration of cut-points, indicating a negative correlation with survival, while green coloration represents a positive correlation. The plot illustrates patient age divided at the mean age, and the optimal cut-point is highlighted by a black circle located in the middle of the color bar. (B) The histogram of the entire cohort reveals that the optimal cut-off value of age at diagnosis is 73 years, based on cancer-specific survival (CSS). The X-axis represents the age of patients, and the Y-axis represents the number of patients at each age. (C) The Kaplan-Meier survival curve is generated based on these cut-off values.
Figure 3
Figure 3
Kaplan-Meier curves of overall survival (OS) and cancer-specific survival (CSS). Kaplan-Meier curves of OS (A) and CSS (B) before propensity score matching (PSM), Kaplan-Meier curves of OS (C) and CSS (D) after PSM.
Figure 4
Figure 4
The forest plot of subgroup analyses according to age (young vs old) of patients with advanced serous ovarian cystadenocarcinoma in the PSM cohort from the SEER database.
Figure 5
Figure 5
Differentially expressed genes (DEGs) between the old group and the young group. (A) The heatmap of DEGs. (B) The volcano plot of DEGs. (C) A bar chart of Kyoto Encyclopedia of Genes and Genomes (KEGG) enrichment of DEGs. (D) A bar chart of Gene Ontology (GO) analysis of DEGs. (E) The protein-protein interaction network of DEGs.
Figure 6
Figure 6
Survival analysis of DEGs. Kaplan-Meier analysis is developed based on the expression levels of AKT1 (A), SUPT3H (B), RELA (C), TAB3 (D), and TBP (E).

References

    1. Siegel RL, Miller KD, Wagle NS, Jemal A. Cancer statistics, 2023. Ca a Cancer J Clinicians. 2023;73(1):17–48. doi:10.3322/caac.21763 - DOI - PubMed
    1. Matz M, Coleman MP, Sant M, et al. The histology of ovarian cancer: worldwide distribution and implications for international survival comparisons (Concord-2). Gynecologic Oncol. 2017;144(2):405–413. doi:10.1016/j.ygyno.2016.10.019 - DOI - PMC - PubMed
    1. Torre LA, Trabert B, DeSantis CE, et al. Ovarian cancer statistics, 2018. Ca a Cancer J Clinicians. 2018;68(4):284–296. doi:10.3322/caac.21456 - DOI - PMC - PubMed
    1. Singh A, Gupta S, Sachan M. Epigenetic biomarkers in the management of ovarian cancer: current prospectives. Front Cell Develop Biol. 2019;7:182. doi:10.3389/fcell.2019.00182 - DOI - PMC - PubMed
    1. Jin S, Liu X, Peng D, Li D, Ye YN. Differences between cancer-specific survival of patients with anaplastic and primary squamous cell thyroid carcinoma and factors influencing prognosis: a SEER database analysis. Front Endocrinol. 2022;13:830760. doi:10.3389/fendo.2022.830760 - DOI - PMC - PubMed