

Factors associated with viral load non-suppression among treatment-experienced pre-teenage children living with HIV in Kenya: a nationwide population-based cohort study, 2015-2021
- PMID: 38333535
- PMCID: PMC10850406
- DOI: 10.1016/j.eclinm.2024.102454
Factors associated with viral load non-suppression among treatment-experienced pre-teenage children living with HIV in Kenya: a nationwide population-based cohort study, 2015-2021
Abstract
Background: Viral load non-suppression (VLNS) in children is a major public health concern because of attendant HIV disease progression and risk of morbidity and mortality. Based on a nationally representative database we present estimates of the prevalence, trends and factors associated with VLNS in Kenyan pre-teenage children between 2015 and 2021.
Methods: Kenya National AIDS & STI Control Program's (NASCOP) maintains an early infant diagnosis and viral load (EID/VL) database for all persons living with HIV who are enrolled in the country's primary care clinics for purposes of monitoring progress towards achievement of the 95% viral suppression goals. Participants were eligible if they were children living with HIV (CLHIV), on combination ART (cART) treatment, and ≤12 years old. The modified Mann-Kendall trend test for serially correlated data was used to identify VLNS trends. Generalized estimating equations (GEE) with a logit link was used to assess the effects of covariates on the odds of VLNS (VL ≥1,000 copies/mL) over repeated points in time, allowing for the correlation among the repeated measures.
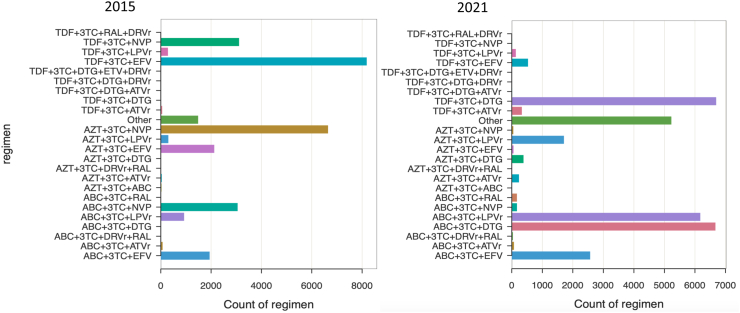
Findings: Between January 2015 and December 2021, 508,743 viral load tests were performed on samples collected from 109,682 pre-teenage children. The prevalence of VLNS decreased from 22.9% (95% CI 22.4-23.3) to 12.5% (95% CI 12.1-12.9), p < 0.0001, and mean age increased from 3.1 (4.2) to 8.0 (3.2) years in 2015 and 2021 respectively. A modified Mann-Kendall trend test for serially correlated data denotes a statistically significant decreasing trend (τ = -0.300, p < 0.0001) over the study period. In the multivariable GEE analysis adjusted for covariates, the odds of VLNS decreased by 11% per year during the study period, (GEE-aOR 0.89, 95% CI 0.88-0.90; p < 0.0001). Factors positively associated with VLNS were EFV/NVP-based first-line cART regimen (GEE-aOR 1.74, 95% CI 1.65-1.84, p < 0.0001), PI-based cART regimen (GEE-aOR 1.82, 95% CI 1.72-1.92, p < 0.0001), and children aged 1-3 years (toddlers) (GEE-aOR: 1.84, 95% CI 1.79-1.90, p < 0.0001). On the contrary, DTG-based cART regimen, were negatively associated with VLNS (GEE-aOR 0.70, 95% CI 0.65-0.75, p < 0.0001).
Interpretation: There is a strong evidence of decreasing viremia between 2015 and 2021. To sustain the decreasing trend, accelerating the switch from the suboptimal EVP/NVP first-line regimen to optimised DTG regimen is warranted.
Funding: U.S. President's Emergency Plan for AIDS Relief (PEPFAR) and Clinton Health Access Initiative (CHAI).
Keywords: Antiretroviral therapy (ART); Generalized estimating equations (GEE); HIV; Kenya; Pre-teenage children; Viral load non-suppression (VLNS).
© 2024 The Authors.
Conflict of interest statement
All the authors declare no competing interests.
Figures


References
-
- UNICEF . 2022. HIV statistics - global and regional trends.https://data.unicef.org/topic/hivaids/global-regional-trends/ Accessed Jan 31, 2023.
-
- The Lancet Hiv Declaration commits to ending AIDS in children. Lancet HIV. 2023;10 - PubMed
-
- Nduati R., John G., Mbori-Ngacha D., et al. Effect of breastfeeding and formula feeding on transmission of HIV-1: a randomized clinical trial. J Am Med Assoc. 2000;283:1167–1174. - PubMed
LinkOut - more resources
Full Text Sources
Research Materials
Miscellaneous
