. 2024 Jan 25:15:1337578.
doi: 10.3389/fgene.2024.1337578. eCollection 2024.

Genome-wide identification, evolution, and expression analysis of the NAC gene family in chestnut (Castanea mollissima)

Affiliations

Genome-wide identification, evolution, and expression analysis of the NAC gene family in chestnut (Castanea mollissima)

Fei Cao et al. Front Genet. .

Abstract

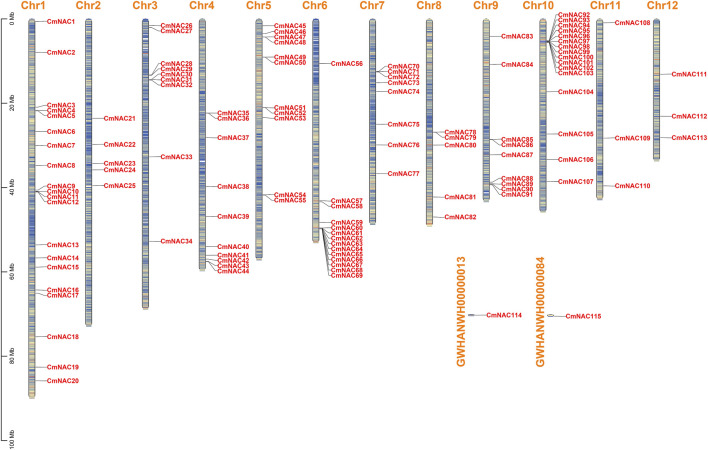
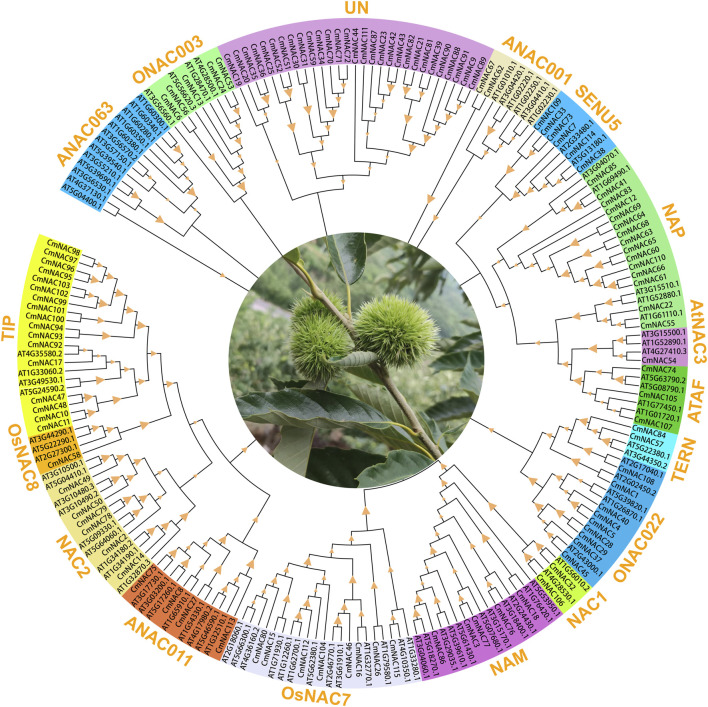
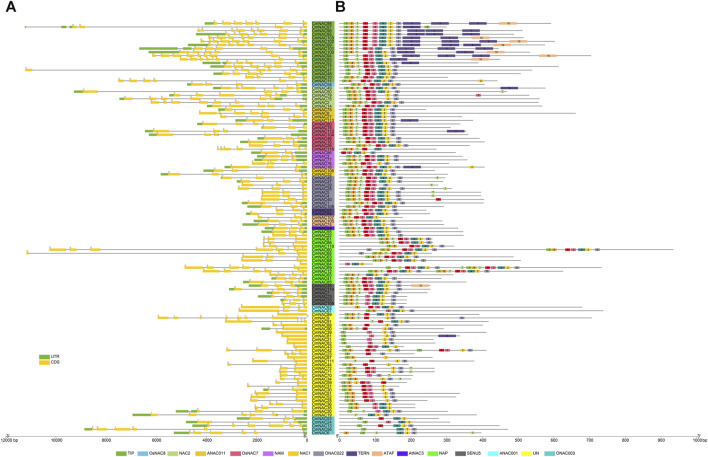
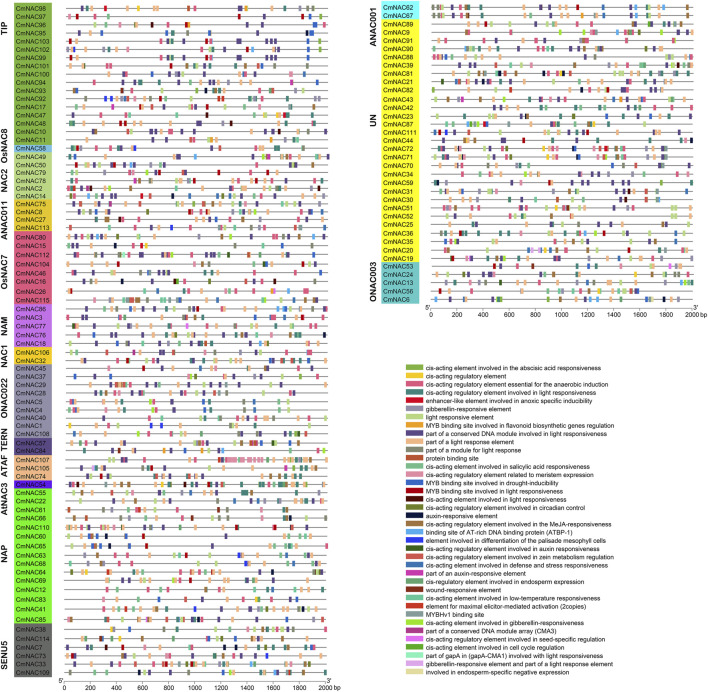
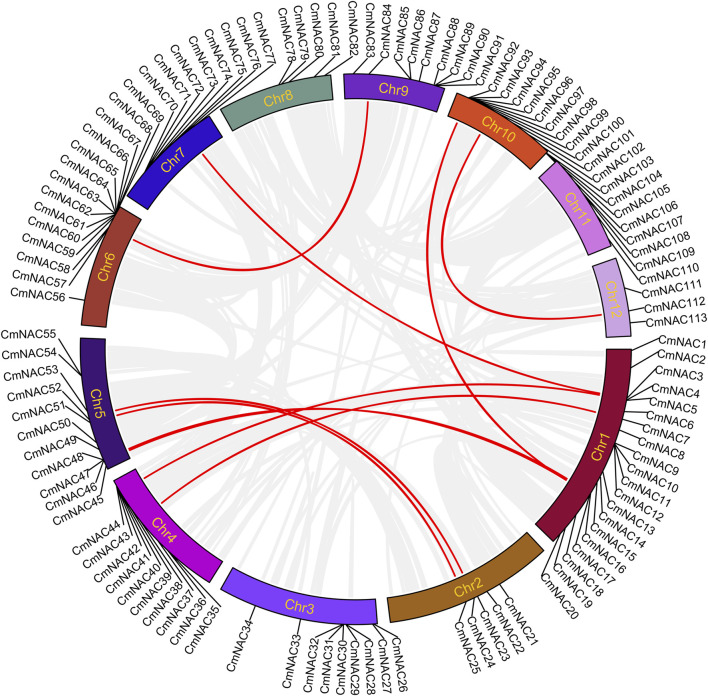
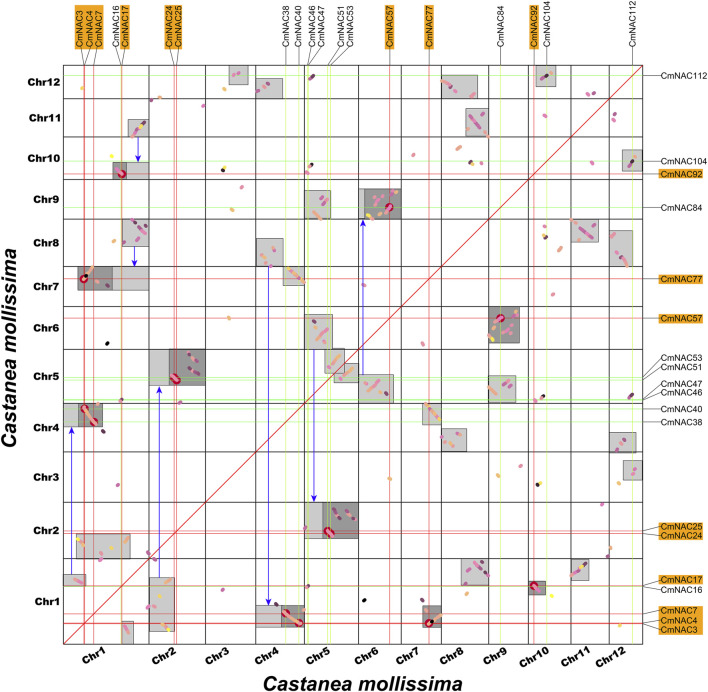
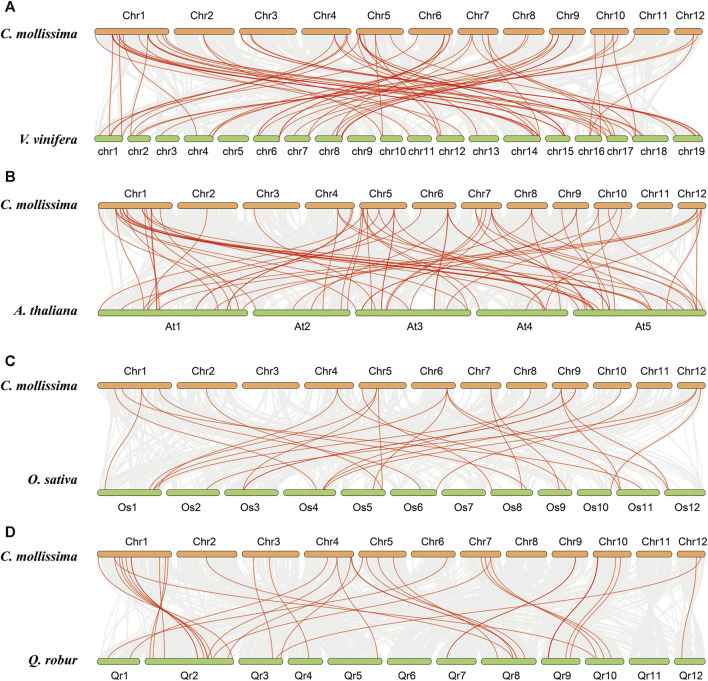
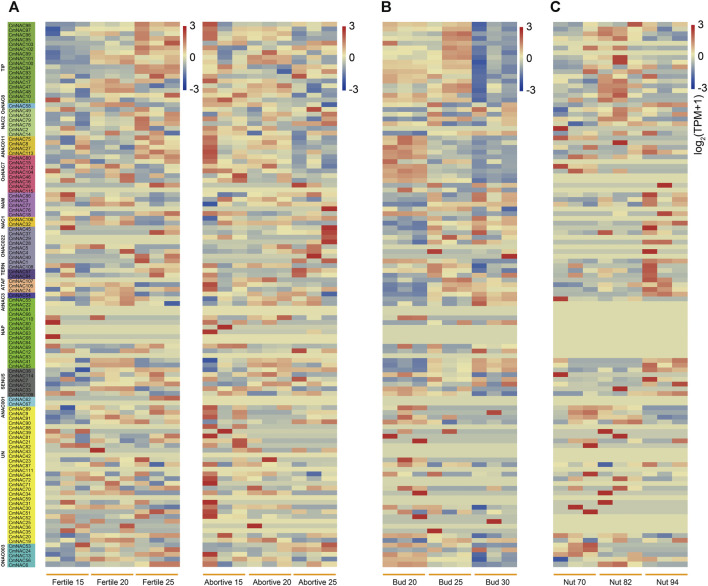
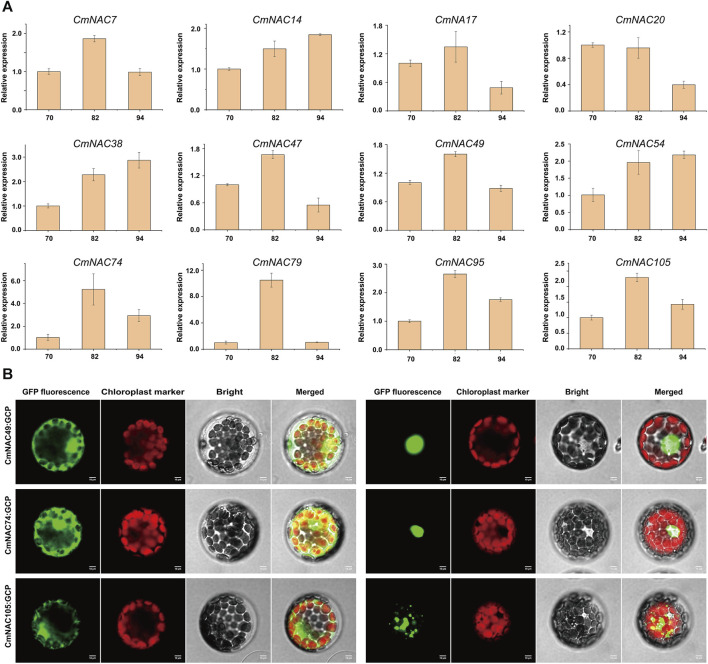
The NAC gene family is one of the most important transcription factor families specific to plants, responsible for regulating many biological processes, including development, stress response, and signal transduction. However, it has not yet been characterized in chestnut, an important nut tree species. Here, we identified 115 CmNAC genes in the chestnut genome, which were divided into 16 subgroups based on the phylogenetic analysis. Numerous cis-acting elements related to auxin, gibberellin, and abscisic acid were identified in the promoter region of CmNACs, suggesting that they play an important role in the growth and development of chestnut. The results of the collinear analysis indicated that dispersed duplication and whole-genome-duplication were the main drivers of CmNAC gene expansion. RNA-seq data of developmental stages of chestnut nut, bud, and ovule revealed the expression patterns of CmNAC genes. Additionally, qRT-PCR experiments were used to verify the expression levels of some CmNAC genes. The comprehensive analysis of the above results revealed that some CmNAC members may be related to chestnut bud and nut development, as well as ovule fertility. The systematic analysis of this study will help to increase understanding of the potential functions of the CmNAC genes in chestnut growth and development.

Keywords: Castanea mollissima; NAC TF; duplication model; evolution; expression patterns.


Conflict of interest statement

The authors declare that the research was conducted in the absence of any commercial or financial relationships that could be construed as a potential conflict of interest.

Figures

FIGURE 1
FIGURE 1
Chromosome distribution of CmNAC genes. The color of segments in the chromosomes shows the gene density of the corresponding region.
FIGURE 2
FIGURE 2
The phylogenetic tree of 209 NAC proteins of chestnut and A. thaliana. MEGA 7.0 was used to construct the phylogenetic tree based on the protein sequences with maximum likelihood method. The proteins were clustered into 17 groups. Different background colors indicate the different groups of the NAC proteins.
FIGURE 3
FIGURE 3
The gene structure and conserved motifs distribution of CmNAC genes. (A) Gene structure of CmNAC genes. (B) Distribution of conserved motifs of CmNAC genes. The gene names highlighted in different colors in the middle are classified according to the CmNACs obtained from the phylogenetic tree.
FIGURE 4
FIGURE 4
Cis-acting elements in the promoter region of CmNAC genes. The gene names highlighted in different colors on the left are classified based on CmNAC obtained from the phylogenetic tree. The distribution of cis-acting elements in the 2,000 bp upstream promoter is shown. The different functions of cis-acting elements are represented by different colors, as shown on the right.
FIGURE 5
FIGURE 5
Circos plot showing the collinearity of the CmNAC genes. The homologous gene pairs formed by the chestnut NAC genes in the collinear region are connected by red lines, while other collinear regions are connected by light gray lines.
FIGURE 6
FIGURE 6
Homologous collinearity dot-plot within the chestnut genome. The collinear blocks from WGD containing CmNAC genes are marked in the orange boxes of the figure. The boxes in the figure represent collinear regions within the chestnut genome, in which the dark or light highlighted boxes indicate regions formed by WGD event containing CmNAC homologous gene pairs and complementary fragments forming larger homologous regions, respectively.
FIGURE 7
FIGURE 7
Collinear relationships with chestnut, grape, A. thaliana, rice and oak genomes. (A) Collinear relationship between chestnut and grape genomes. (B) Collinear relationship between chestnut and (A) thaliana genomes. (C) Collinear relationship between chestnut and rice genomes. (D) Collinear relationship between chestnut and oak genomes.
FIGURE 8
FIGURE 8
Heat-map of NAC genes expression in ovules (fertile/abortive), buds and nuts of chestnut at different stages. (A) Heat-map of NAC genes expression in fertile and abortive ovules of chestnut at 15-July, 20-July, and 25-July. The gene names highlighted in different colors on the left are classified based on CmNAC obtained from the phylogenetic tree. (B) Heat-map of NAC genes expression in chestnut buds 20, 25, and 30 days after flowering. (C) Heat-map of NAC genes expression in chestnut nuts 70, 82, and 94 days after flowering.
FIGURE 9
FIGURE 9
qRT-PCR of 12 CmNAC genes in chestnut nuts at different developmental stages and subcellular location of three CmNAC genes proteins in (A) thaliana protoplasts. (A) qRT-PCR of CmNAC7, CmNAC14, CmNAC17, CmNAC20, CmNAC38, CmNAC47, CmNAC49, CmNAC54, CmNAC74, CmNAC79, CmNAC95 and CmNAC105 in chestnut nuts at different developmental stages. (B) Subcellular location of CmNAC49, CmNAC74 and CmNAC105 proteins in (A) thaliana protoplasts.

Similar articles

Cited by

References

    1. Anisimova M., Bielawski J. P., Yang Z. (2001). Accuracy and power of the likelihood ratio test in detecting adaptive molecular evolution. Mol. Biol. Evol. 18 (8), 1585–1592. 10.1093/oxfordjournals.molbev.a003945 - DOI - PubMed
    1. Badouin H., Gouzy J., Grassa C. J., Murat F., Staton S. E., Cottret L., et al. (2017). The sunflower genome provides insights into oil metabolism, flowering and Asterid evolution. Nature 546 (7656), 148–152. 10.1038/nature22380 - DOI - PubMed
    1. Bai J., Song M. J., Gao J., Li G. (2022). Whole genome duplication and dispersed duplication characterize the evolution of the plant PINOID gene family across plant species. Gene 829, 146494. 10.1016/j.gene.2022.146494 - DOI - PubMed
    1. Barros A. I. R. N. A., Nunes F. M., Gonçalves B., Bennett R. N., Silva A. P. (2011). Effect of cooking on total vitamin C contents and antioxidant activity of sweet chestnuts (Castanea sativa Mill). Food Chem. 128 (1), 165–172. 10.1016/j.foodchem.2011.03.013 - DOI - PubMed
    1. Bray N. L., Pimentel H., Melsted P., Pachter L. (2016). Near-optimal probabilistic RNA-seq quantification. Nat. Biotechnol. 34 (5), 525–527. 10.1038/nbt.3519 - DOI - PubMed