. 2024 Jan 17;27(2):108941.
doi: 10.1016/j.isci.2024.108941. eCollection 2024 Feb 16.

Effects of flora deficiency on the structure and function of the large intestine

Affiliations

Effects of flora deficiency on the structure and function of the large intestine

Tailiang Chai et al. iScience. .

Abstract

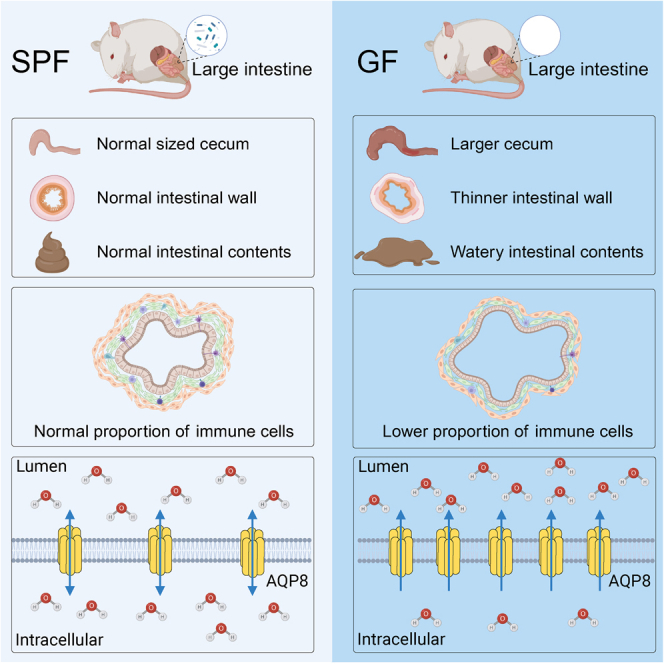
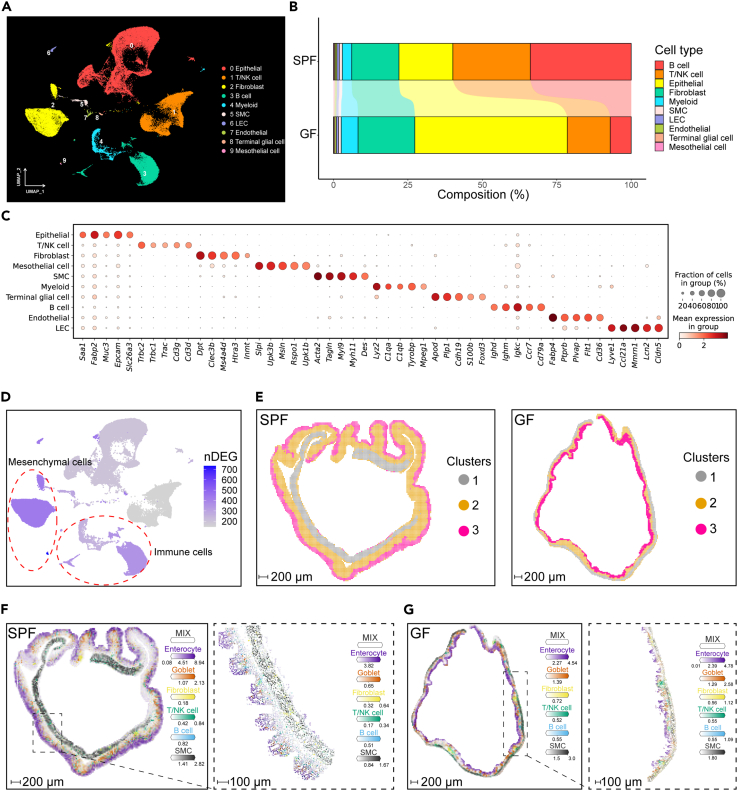
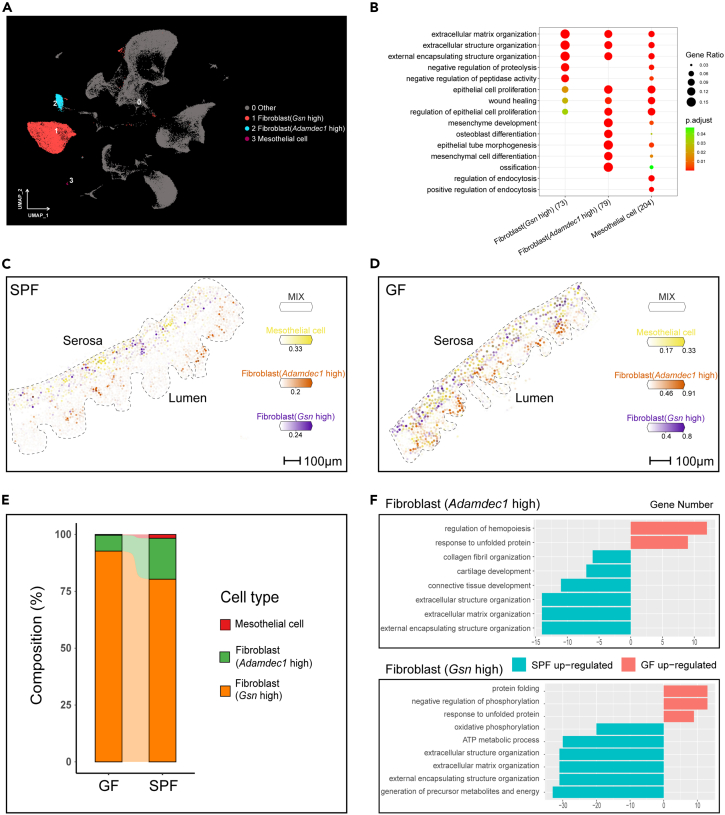
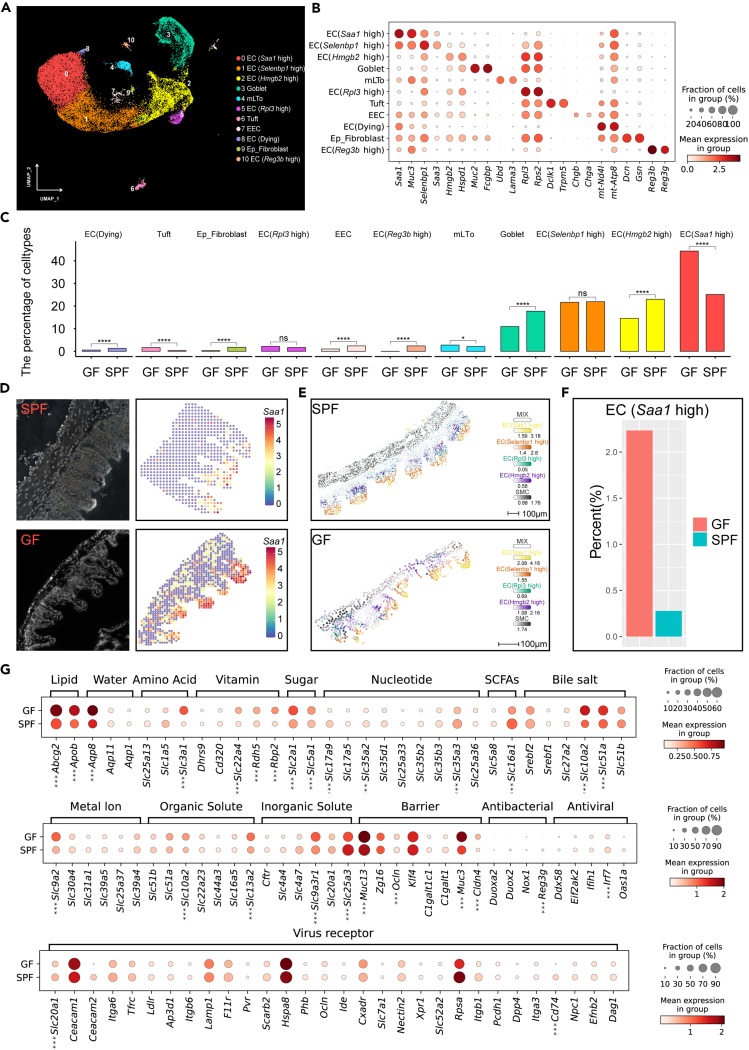
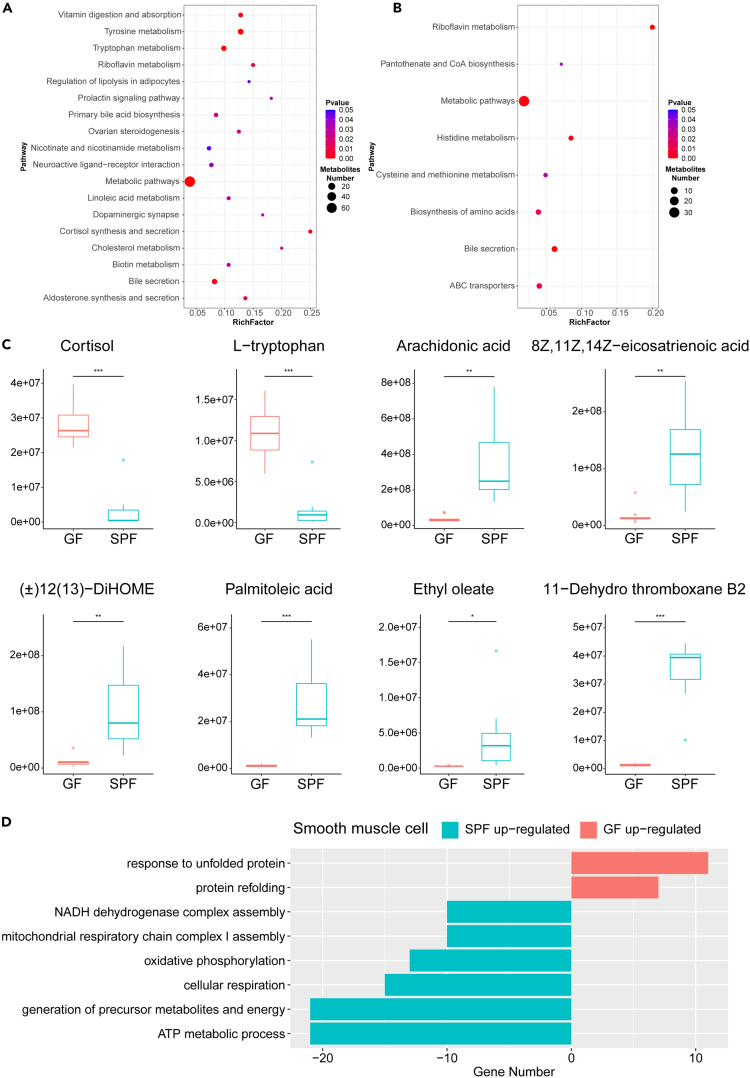
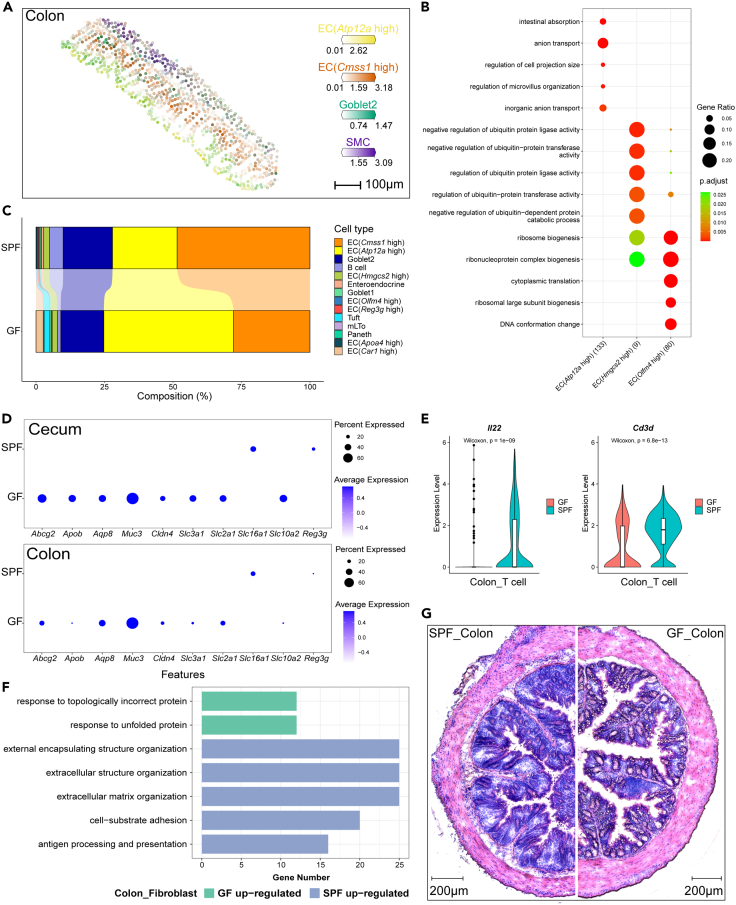
The significant anatomical changes in large intestine of germ-free (GF) mice provide excellent material for understanding microbe-host crosstalk. We observed significant differences of GF mice in anatomical and physiological involving in enlarged cecum, thinned mucosal layer and enriched water in cecal content. Furthermore, integration analysis of multi-omics data revealed the associations between the structure of large intestinal mesenchymal cells and the thinning of the mucosal layer. Increased Aqp8 expression in GF mice may contribute to enhanced water secretion or altered hydrodynamics in the cecum. In addition, the proportion of epithelial cells, nutrient absorption capacity, immune function and the metabolome of cecum contents of large intestine were also significantly altered. Together, this is the first systematic study of the transcriptome and metabolome of the cecum and colon of GF mice, and these findings contribute to our understanding of the intricate interactions between microbes and the large intestine.

Keywords: Metabolomics; Microbiome; Transcriptomics.


Conflict of interest statement

The authors declare no competing interests.

Figures

None
Graphical abstract
Figure 1
Figure 1
Significant anatomical changes occur in the cecum of GF mice (A) Experimental design. (B) Anatomical view of the cecum of GF and SPF mice showing the significantly enlarged cecum of GF mice. GF mice are shown on the left and SPF mice are shown on the right. (C) H&E stained image showing significant wall thinning in the cecum of GF mice. The top of the image shows the GF cecum and the bottom of the image shows the SPF cecum. Resolution: 100 μm. (D) The cecum of GF mice weighs 9 times more than that of SPF mice. p values were generated by Student’s t test. ∗∗∗ indicates p < 0.001. (E) The thickness of the cecum wall of GF mice is one-third that of SPF mice. p values were generated by Student’s t test. ∗∗∗ indicates p < 0.001.
Figure 2
Figure 2
Overview of single cell transcriptome and spatial transcriptome data from GF and SPF cecum (A) UMAP plot shows the ten main cell types of the cecum. SMC, smooth muscle cell; LEC, lymphatic endothelial cell. (B) Proportion of cells in each cluster of GF and SPF cecum single cell transcriptome. (C) Expression of marker genes in each cell type of cecum. Each dot represents a gene, where color saturation indicates the average expression level in the intestinal segment and size indicates the percentage of cells expressing the gene. (D) The number of differential genes indicates that mesenchymal cells, immune cells have more differential genes. Color saturation indicates the number of differential genes. To find differential genes, the "FindMarkers" function in the seurat package was used, and the method used was "MAST." The screening conditions for highly expressed genes in GF mice were P_adjust < 0.05, avg_log2FC > 0.58. log2FC > 0.58. The screening conditions for highly expressed genes in SPF mice were: P_adjust < 0.05, avg_log2FC < −0.58. (E) BayesSpace clustering results for GF and SPF mice. The left side of the image shows SPF mice. The right side of the image shows GF mice. Cluster1 represents the muscle layer, Cluster2 represents the mixed layer, and Cluster3 represents the epithelial layer. Spatial data adopts Bin50 resolution. (F) Deconvolution results show the spatial distribution of major cell types in SPF mice. The image on the left shows the whole slice, spatial data adopts Bin50 resolution. The picture on the right shows a partial view, spatial data adopts cell-Bin resolution. (G) Deconvolution results show the spatial distribution of major cell types in GF mice. The image on the left shows the whole slice, spatial data adopts Bin50 resolution. The picture on the right shows a partial perspective, spatial data adopts cell-Bin resolution.
Figure 3
Figure 3
Microbial defects significantly affect the structure-building function of mesenchymal cells (A) UMAP plot shows three major mesenchymal cell subtypes. (B) GO enrichment results demonstrate that three mesenchymal cell subtypes perform different functions. Each dot indicates a pathway, where the color unsaturation indicates the level of p adjust and the size indicates the percentage of genes enriched to that pathway. (C and D) Results of deconvolution of SPF and GF cecum mesenchymal cell subclasses. Fibroblast (Adamdec1 high) cells are mainly found in the mucosal layer. Fibroblast (Gsn high) cells are mainly found in the submucosal and muscular layers. Mesothelial cells are found in the mucosal, submucosal and muscular layers. Results on the left show the SPF cecum (C). Results on the right show the GF cecum (D). Spatial data adopts cell-Bin resolution. (E) The proportion of mesenchymal cells showed a significant increase in the proportion of fibroblast (Gsn high) cells. (F) GO enrichment results demonstrate reduced activity in both subclasses of GF cecum mesenchymal cells in structurally constructed pathways. To find differential genes, the "FindMarkers" function in the seurat package was used, and the method used was "MAST." The screening conditions for highly expressed genes in GF mice were P_adjust < 0.05, avg_log2FC > 0.25. The screening conditions for highly expressed genes in SPF mice were: P_adjust < 0.05, avg_log2FC < −0.25. GO enrichment was performed on the results of differential genes, and the first few pathways with the most significant differences were selected for display.
Figure 4
Figure 4
Comparison of the single cell and spatial transcriptomes of cecum epithelial cells in GF and SPF cecum (A) UMAP plot shows 11 subtypes of cecum epithelial cells. EC, enterocyte; mLTo, mesenchymal lymphoid tissue organizer; EEC, enteroendocrine cell. (B) Expression of marker genes in each cell type of cecum epithelial cells. (C) Significant increase in the proportion of GF cecum EC (Saa1 high) cells. p values were generated by Fisher’s exact test. ∗∗∗∗ indicates p < 0.0001, ∗ indicates p < 0.05, ns means not significant. (D) GF cecum has more spots with high expression of Saa1 gene. The ssDNA image is displayed on the left. Spatial data adopts Bin20 resolution. (E) The enterocyte subtype is stratified along the columnar epithelium. Spatial data adopts cell-Bin resolution. (F) Spatial transcriptome cell ratio results demonstrate an elevated proportion of EC (Saa1 high) cells in the GF cecum. (G) Enhanced water transport capacity and absorption of major nutrients in the cecum epithelium of GF mice. Each dot represents a gene, where color saturation indicates the average expression level in the intestinal segment and size indicates the percentage of cells expressing the gene. p values were generated by Wilcoxon test. ∗∗∗ indicates p < 0.001.
Figure 5
Figure 5
Absence of microorganisms significantly impairs the proportion and function of immune cells (A) UMAP plot shows three main immune cell types. (B) Mature NKT, Iga_Plasma and other mature immune cells are significantly reduced in the proportion of GF cecum. (C) Volcano map of differentially expressed genes in immune cells. To find differential genes, the "FindMarkers" function in the seurat package was used, and the method used was "MAST." The screening conditions for highly expressed genes in B cells and T/NK cells of GF mice are P_adjust < 0.05, avg_log2FC > 0.58. The screening conditions for highly expressed genes in B cells and T/NK cells of SPF mice are P_adjust < 0.05, avg_log2FC < −0.58. The screening conditions for highly expressed genes in macrophage of GF mice are P_adjust < 0.05, avg_log2FC > 0.25. The screening conditions for highly expressed genes in macrophage of SPF mice are P_adjust < 0.05, avg_log2FC < −0.25. (D) GO enrichment plot shows decreased immune function in three major immune cells. GO enrichment was performed on the results of differential genes, and the first few pathways with the most significant differences were selected for display. (E) Results of immune cell deconvolution, showing the spatial distribution of immune cells in the cecum of GF and SPF mice. Local enlargements are shown in red boxes. Spatial data adopts Bin50 resolution.
Figure 6
Figure 6
Significant changes in the metabolism of cecal contents in GF mice compared to SPF mice (A) KEGG functional enrichment map of cationic differential metabolites in the cecal content metabolome of GF and SPF mice. The results showed significant differences in the metabolic pathways of vitamins, amino acids and cortisol. RichFactor is the number of differential metabolites annotated to the pathway divided by all identified metabolites annotated to the pathway. The dot size represents the number of differential metabolites annotated to this pathway. (B) KEGG functional enrichment map of anionic differential metabolites in the cecal content metabolome of GF and SPF mice. The results showed significant differences in metabolic pathways such as riboflavin, amino acids and bile acids. (C) Boxplot showing significantly changed metabolites in cecal contents of GF mice. The results showed that metabolites such as tryptophan and cortisol were significantly enriched in the GF cecum contents and unsaturated fatty acids such as arachidonic acid were significantly absent. p values were generated by Student’s t test. ∗∗∗ indicates p < 0.001, ∗∗ indicates p < 0.01, ∗ indicates p < 0.05. (D) Differential gene GO enrichment results demonstrate a significant decrease in GF cecum smooth muscle cell (SMC) activity. To find differential genes, the "FindMarkers" function in the seurat package was used, and the method used was "MAST." The screening conditions for highly expressed genes in GF mice were P_adjust < 0.05, avg_log2FC > 0.25. The screening conditions for highly expressed genes in SPF mice were: P_adjust < 0.05, avg_log2FC < −0.25. GO enrichment was performed on the results of differential genes, and the first few pathways with the most significant differences were selected for display.
Figure 7
Figure 7
Effect of microbial deficiency on colonic cell function (A) Deconvolution results show that subclasses of colonic epithelial cells are stratified along the columnar epithelium. EC, enterocyte; SMC, smooth muscle cell. (B) GO enrichment results demonstrate that colonic epithelial cell subtypes perform distinct cellular functions. Each dot indicates a pathway, where the color unsaturation indicates the level of p adjust and the size indicates the percentage of genes enriched to that pathway. (C) The proportion of colon epithelial cells in GF and SPF mice. The proportion of EC (Atp12a high) cells located in the apical mucosal layer of the colon was significantly higher in the GF colon. (D) Enhanced water transport capacity and absorption of major nutrients in the cecum and colonic epithelium of GF mice. Each dot represents a gene, where color saturation indicates the average expression level in the intestinal segment and size indicates the percentage of cells expressing the gene. (E) Differential expression of Il22 and Cd3d genes in colon T cells of GF and SPF mice. (F) GO enrichment results show reduced structure-building function of colonic fibroblasts. To find differential genes, the "FindMarkers" function in the seurat package was used, and the method used was "MAST." The screening conditions for highly expressed genes in GF mice were P_adjust <0.05, avg_log2FC > 0.25. The screening conditions for highly expressed genes in SPF mice were: P_adjust < 0.05, avg_log2FC < −0.25. GO enrichment was performed on the results of differential genes, and the first few pathways with the most significant differences were selected for display. (G) H&E staining of the colon of GF and SPF mice. The mucosal layer of the colon was significantly thinner in GF mice compared to SPF mice.

Similar articles

Cited by

References

    1. Hornbuckle W.E., Tennant B.C. Clinical biochemistry of domestic animals. Elsevier; 1997. Gastrointestinal function; pp. 367–406.
    1. Baumgart D.C., Dignass A.U. Intestinal barrier function. Curr. Opin. Clin. Nutr. Metab. Care. 2002;5:685–694. doi: 10.1097/00075197-200211000-00012. - DOI - PubMed
    1. Li Z., Hao M.M., Van den Haute C., Baekelandt V., Boesmans W., Vanden Berghe P. Regional complexity in enteric neuron wiring reflects diversity of motility patterns in the mouse large intestine. Elife. 2019;8 - PMC - PubMed
    1. Eisenstein M. Biology: A slow-motion epidemic. Nature. 2016;540:S98–S99. doi: 10.1038/540S98a. - DOI - PubMed
    1. Le H.H., Lee M.-T., Besler K.R., Comrie J.M.C., Johnson E.L. Characterization of interactions of dietary cholesterol with the murine and human gut microbiome. Nat. Microbiol. 2022;7:1390–1403. - PMC - PubMed

LinkOut - more resources