

Insight into planktonic protistan and fungal communities across the nutrient-depleted environment of the South Pacific Subtropical Gyre
- PMID: 38334383
- PMCID: PMC10913754
- DOI: 10.1128/spectrum.03016-23
Insight into planktonic protistan and fungal communities across the nutrient-depleted environment of the South Pacific Subtropical Gyre
Abstract
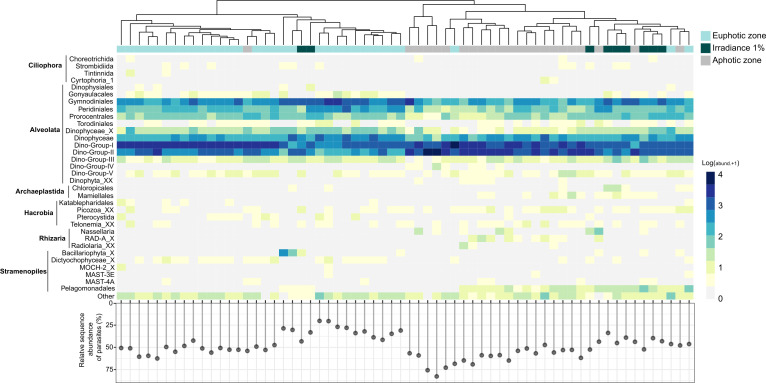
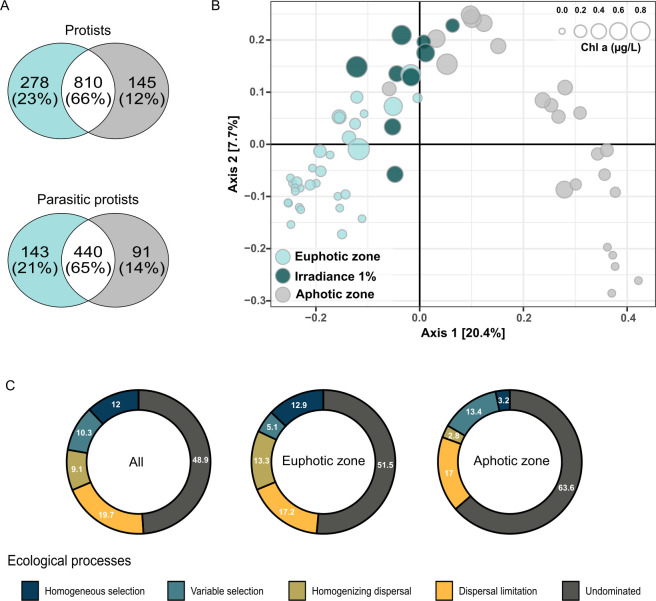
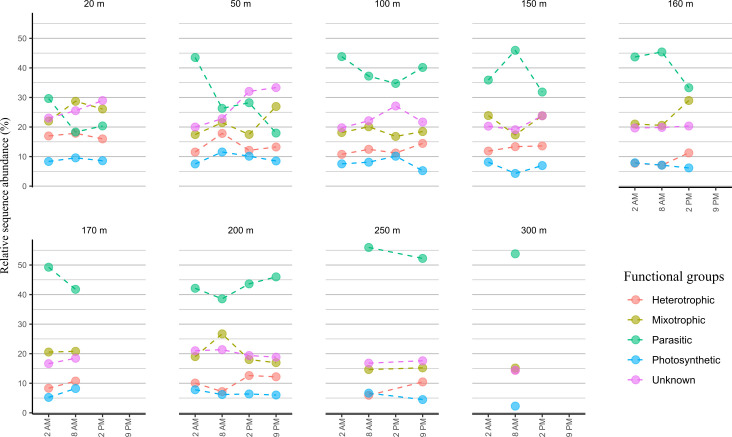
Ocean microorganisms constitute ~70% of the marine biomass, contribute to ~50% of the Earth's primary production, and play a vital role in global biogeochemical cycles. The marine heterotrophic and mixotrophic protistan and fungal communities have often been overlooked mainly due to limitations in morphological species identification. Despite the accumulation of studies on biogeographic patterns observed in microbial communities, our understanding of the abundance and distribution patterns within the microbial community of the largest subtropical gyre, the South Pacific Gyre (SPG), remains incomplete. Here, we investigated the diversity and vertical composition of protistan and fungal communities in the water column of the ultra-oligotrophic SPG. Our results showed apparent differences in protistan community diversity in the photic and aphotic regions. The entire protistan community diversity was significantly affected by temperature, salinity, oxygen, and nutrient concentrations, while the parasitic community diversity was also affected by chlorophyll a concentration. The parasitic protists were assigned to the class Syndiniales accounting for over 98% of the total parasitic protists, exhibiting higher relative sequence abundance along the water depth and displaying consistent patterns among different sampling stations. In contrast to the protistan community, the fungal community along the SPG primarily clustered based on the sampling station and pelagic zones. In particular, our study reveals a significant presence of parasitic protists and functionally diverse fungi in SPG and their potential impact on carbon cycling in the gyre.IMPORTANCEOur findings carry important implications for understanding the distribution patterns of the previously unrecognized occurrence of parasitic protists and functionally diverse fungi in the nutrient-limited South Pacific Gyre. In particular, our study reveals a significant presence of parasitic Syndiniales, predominantly abundant in the upper 300 m of the aphotic zone in the gyre, and a distinct presence of fungal communities in the aphotic zone at the central part of the gyre. These findings strongly suggest that these communities play a substantial role in yet insufficiently described microbial food web. Moreover, our research enhances our understanding of their contribution to the dynamics of the food webs in oligotrophic gyres and is valuable for projecting the ecological consequences of future climate warming.
Keywords: South Pacific Subtropical Gyre; fungi; parasitic protists.
Conflict of interest statement
The authors declare no conflict of interest.
Figures
Similar articles
-
Protistan community composition and metabolism in the North Pacific Subtropical Gyre: Influences of mesoscale eddies and depth.Environ Microbiol. 2024 Jan;26(1):e16556. doi: 10.1111/1462-2920.16556. Epub 2023 Dec 11. Environ Microbiol. 2024. PMID: 38081167
-
On-Site Analysis of Bacterial Communities of the Ultraoligotrophic South Pacific Gyre.Appl Environ Microbiol. 2019 Jul 1;85(14):e00184-19. doi: 10.1128/AEM.00184-19. Print 2019 Jul 15. Appl Environ Microbiol. 2019. PMID: 31076426 Free PMC article.
-
Patchy Blooms and Multifarious Ecotypes of Labyrinthulomycetes Protists and Their Implication in Vertical Carbon Export in the Pelagic Eastern Indian Ocean.Microbiol Spectr. 2022 Jun 29;10(3):e0014422. doi: 10.1128/spectrum.00144-22. Epub 2022 May 3. Microbiol Spectr. 2022. PMID: 35502912 Free PMC article.
-
Strong Seasonality in Arctic Estuarine Microbial Food Webs.Front Microbiol. 2019 Nov 29;10:2628. doi: 10.3389/fmicb.2019.02628. eCollection 2019. Front Microbiol. 2019. PMID: 31849850 Free PMC article. Review.
-
Diversity, Abundance, and Ecological Roles of Planktonic Fungi in Marine Environments.J Fungi (Basel). 2022 May 8;8(5):491. doi: 10.3390/jof8050491. J Fungi (Basel). 2022. PMID: 35628747 Free PMC article. Review.
References
-
- Caron DA. 2005. Marine microbial ecology in a molecular world: what does the future hold? Sci Mar 69:97–110. doi:10.3989/scimar.2005.69s197 - DOI
-
- Polimene L, Sailley S, Clark D, Mitra A, Allen JI. 2017. Biological or microbial carbon pump? The role of phytoplankton stoichiometry in ocean carbon sequestration. J Plankton Res 39:180–186. doi:10.1093/plankt/fbw091 - DOI
MeSH terms
Substances
Grants and funding
LinkOut - more resources
Full Text Sources
