. 2024 Feb 9:13:e86386.
doi: 10.7554/eLife.86386.

Altered hierarchical auditory predictive processing after lesions to the orbitofrontal cortex

Affiliations

Altered hierarchical auditory predictive processing after lesions to the orbitofrontal cortex

Olgerta Asko et al. Elife. .

Abstract

Orbitofrontal cortex (OFC) is classically linked to inhibitory control, emotion regulation, and reward processing. Recent perspectives propose that the OFC also generates predictions about perceptual events, actions, and their outcomes. We tested the role of the OFC in detecting violations of prediction at two levels of abstraction (i.e., hierarchical predictive processing) by studying the event-related potentials (ERPs) of patients with focal OFC lesions (n = 12) and healthy controls (n = 14) while they detected deviant sequences of tones in a local-global paradigm. The structural regularities of the tones were controlled at two hierarchical levels by rules defined at a local (i.e., between tones within sequences) and at a global (i.e., between sequences) level. In OFC patients, ERPs elicited by standard tones were unaffected at both local and global levels compared to controls. However, patients showed an attenuated mismatch negativity (MMN) and P3a to local prediction violation, as well as a diminished MMN followed by a delayed P3a to the combined local and global level prediction violation. The subsequent P3b component to conditions involving violations of prediction at the level of global rules was preserved in the OFC group. Comparable effects were absent in patients with lesions restricted to the lateral PFC, which lends a degree of anatomical specificity to the altered predictive processing resulting from OFC lesion. Overall, the altered magnitudes and time courses of MMN/P3a responses after lesions to the OFC indicate that the neural correlates of detection of auditory regularity violation are impacted at two hierarchical levels of rule abstraction.

Keywords: EEG; attention; auditory perception; brain damage; human; meningioma; neuroscience; prediction.


Conflict of interest statement

OA, AB, SL, MF, AL, IF, TM, RK, TE, AS No competing interests declared

Figures

Figure 1.
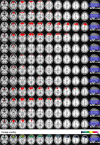
Figure 1.. Lesion reconstruction for the group with orbitofrontal cortex (OFC) damage.
(A) Aggregate lesion overlay maps in axial view. The color code (from 0 to 100%) for the group overlay indicates the percentage of shared lesion coverage across patients. The redder the color, the greater the lesion overlap. Neurological convention: the right side of the brain is depicted on the right side of the image and vice versa. (B) Average percentage of damaged tissue within each Brodmann area (BA) per hemisphere. BAs with less than 2% damage are not presented.
Figure 1—figure supplement 1.
Figure 1—figure supplement 1.. Lesion reconstructions for the orbitofrontal cortex (OFC) group.
Individual patients (1–12) and group overlay (bottom row). The color code for the group overlay indicates the number of patients with damaged tissue in that area.
Figure 1—figure supplement 2.
Figure 1—figure supplement 2.. Lesion reconstructions for the right lateral prefrontal cortex (PFC) group.
Individual patients (1–6) and group overlay (bottom row). The color code for the group overlay indicates the number of patients with damaged tissue in that area.
Figure 1—figure supplement 3.
Figure 1—figure supplement 3.. Lesion reconstructions for the left lateral prefrontal cortex (PFC) group.
Individual patients (1–4) and group overlay (bottom row). The color code for the group overlay indicates the number of patients with damaged tissue in that area.
Figure 1—figure supplement 4.
Figure 1—figure supplement 4.. Lateral prefrontal cortex (PFC) lesion by Brodmann areas (BA).
Average percentage of damaged tissue within each BA per hemisphere. BAs with less than 2% damage are not presented.
Figure 2.
Figure 2.. Illustration of stimuli and experimental design.
(A) On each trial, five or four complex tones of 50 ms duration each were presented with a fixed SOA of 150 ms. Two types of tones were used to generate these trials: tone A (composed of 440, 880, and 1760 Hz sinusoidal tones) and tone B (composed of 622, 1244, and 2488 Hz sinusoidal tones). (B) Each block started with 20 frequent sequences of tones to establish the block’s global rule. In regular xX blocks, standard sequences (75%) consisted of five repetitions of the same tone (i.e., xx│xX or control trials). These were interspersed with rare local deviant sequences (12.5% each) where the fifth sound was either different in frequency type (i.e., xy│xX or local + global deviant trials), or was omitted. The irregular xY blocks were similar, except that the standard sequences (75%) had a fifth sound differing in frequency type (i.e., xy│xY or local deviant trials), interspersed with rare (12.5%) local standard sequences (i.e., xx│xY or global deviant trials), or omission sequences. (C) By contrasting control (xx│xX) trials with local deviant (xy│xY), global deviant (xx│xY), and local + global deviant (xy│xX) trials, we isolated low-level, high-level, and combined low- and high-level prediction error (PE) responses, respectively. dur., duration; ITI, inter-trial interval; SOA, stimulus onset asynchrony.
Figure 3.
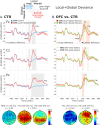
Figure 3.. Local deviance event-related potentials (ERPs).
(A) Local deviance response CTR group. To the left are the healthy control participants’ grand average ERP waveforms at midline electrodes (from top to bottom: Fz, Cz, and Pz). ERPs from the processing of (standard) tones predicted at both levels (control: xx│xX trials) are in blue, and ERPs from the processing of (deviant) tones unpredicted at the local level (local deviant: xy│xY trials) are in red. Gray shaded bars indicate times when the electrode was part of a cluster showing significant within-group condition differences. At the bottom, the topographic scalp maps represent the statistical difference values for the t-contrast of the two experimental conditions computed for the time window corresponding to the cluster with significant differences. (B) Group differences (CTR vs. OFC). To the right are the CTR and OFC grand average ERP waveforms at the same midline electrodes. ERPs from the processing of tones unpredicted at the local level (local deviant: xy│xY trials) are in red for CTR and in green for OFC. Orange shaded bars indicate times when the electrode was part of a cluster showing significant differences between the groups. At the bottom, the topographic scalp map represents the statistical difference values for the t-contrast of the two groups computed for the time window corresponding to the cluster showing differences. MMN and P3a latencies did not show statistically significant differences between groups. Dashed lines at −600, –450, −300,–150, and 0 ms depict tone onsets. Shaded areas around the waveforms represent the standard error of the mean (SEM). OFC, orbitofrontal cortex.
Figure 3—figure supplement 1.
Figure 3—figure supplement 1.. Predicted standard tone response.
(A) Group differences (CTR vs. OFC). CTR and OFC grand average ERP waveforms at the Fz and Pz electrodes. ERPs from the processing of tones predicted at both local and global levels (control: xx | xX trials) are in blue for the CTR group and in green for the OFC lesion group. (B) Group differences (CTR vs. LPFC). CTR and LPFC grand average ERP waveforms at the Fz and Pz electrodes. ERPs from the processing of tones predicted at both local and global levels (control: xx | xX trials) are in blue for the CTR group and in purple for the LPFC lesion group. Dashed lines at −600, –450, −300, –150, and 0 ms depict tone onsets. Shaded areas around the waveforms represent the standard error of the mean (SEM). OFC, orbitofrontal cortex; ERP, event-related potential; LPFC, lateral prefrontal cortex.
Figure 3—figure supplement 2.
Figure 3—figure supplement 2.. Local deviance response. group differences (CTR vs. LPFC).
CTR and LPFC grand average ERP waveforms at the Fz and Pz electrodes. ERPs from the processing of tones unpredicted at the local level (local deviant: xy | xY trials) are in red for the CTR group and in light purple for the LPFC group. Dashed lines at −600, –450, −300, –150, and 0 ms depict tone onsets. Shaded areas around the waveforms represent the standard error of the mean (SEM). ERP, event-related potential; LPFC, lateral prefrontal cortex.
Figure 4.
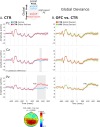
Figure 4.. Global deviance event-related potentials (ERPs).
(A) Global deviance response CTR group. To the left are the healthy control participants’ grand average ERP waveforms at three midline electrodes (from top to bottom: Fz, Cz, and Pz). ERPs from the processing of (standard) tones predicted at both local and global levels (control: xx│xX trials) are in blue, and ERPs from the processing of (standard) tones unpredicted only at the global level (global deviant: xx│xY trials) are in red. Gray shaded bars indicate times when the electrode was part of a cluster showing significant within-group condition differences. At the bottom, the topographic scalp map represents the statistical difference values for the t-contrast of the two experimental conditions computed for the time window corresponding to the cluster showing significant differences. (B) Group differences (CTR vs. OFC). To the right are the CTR and OFC grand average ERP waveforms at the same midline electrodes. ERPs from the processing of standard tones unpredicted at the global level (global deviant: xx│xY trials) are in red for the CTR group and green for the OFC group. P3b latency did not show statistically significant differences between groups. Dashed lines at −600, –450, −300, –150, and 0 ms depict tone onsets. Shaded areas around the waveforms represent the standard error of the mean (SEM). OFC, orbitofrontal cortex.
Figure 4—figure supplement 1.
Figure 4—figure supplement 1.. Global deviance response. group differences (CTR vs. LPFC).
CTR and LPFC grand average ERP waveforms at the Fz and Pz electrodes. ERPs from the processing of standard tones unpredicted at the global level (global deviant: xx | xY trials) are in red for the CTR group and light purple for the LPFC group. Dashed lines at −600, –450, −300, –150, and 0 ms depict tone onsets. Shaded areas around the waveforms represent the standard error of the mean (SEM). ERP, event-related potential; LPFC, lateral prefrontal cortex.
Figure 5.
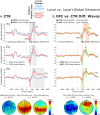
Figure 5.. Local + global deviance event-related potentials (ERPs).
(A) Local + global deviance response CTR group. To the left are the healthy control participants’ grand average ERP waveforms at midline electrodes (from top to bottom: Fz, Cz, and Pz). ERPs from the processing of (standard) tones predicted at both local and global levels (control: xx│xX trials) are in blue, and ERPs from the processing of (deviant) tones unpredicted at both levels (local + global deviant: xy│xX trials) are in red. Gray shaded bars indicate times when the electrode was part of a cluster showing significant within-group condition differences. At the bottom, the topographic scalp maps reflect the statistical difference values for the t-contrast of the two experimental conditions computed for the time window corresponding to the cluster with significant differences. (B) Group differences (CTR vs. OFC). To the right are the CTR and OFC grand average ERP waveforms at the same midline electrodes. ERPs from the processing of (deviant) tones unpredicted at both local and global level (local + global deviant: xy│xX trials) are in red for CTR and in green for OFC. Orange shaded bars indicate times when the electrode was part of a cluster showing significant differences between the groups. Vertical red lines indicate the 50% area latency for the CTR group while vertical green lines indicate the latency for the OFC group for the corresponding components (i.e., MMN and P3a). Asterisks (*) denote significant latency differences. At the bottom, the topographic scalp maps represent the statistical difference values for the t-contrast of the two groups computed for the time window corresponding to the cluster with observed differences. Dashed lines at −600, –450, −300, –150, and 0 ms depict tone onsets. Shaded areas around the waveforms represent the standard error of the mean (SEM). OFC,orbitofrontal cortex; MMN, mismatch negativity.
Figure 5—figure supplement 1.
Figure 5—figure supplement 1.. Local + global deviance response. group differences (CTR vs. LPFC).
CTR and LPFC grand average ERP waveforms at the Fz and Pz electrodes. ERPs from the processing of (deviant) tones unpredicted at both levels (local + global deviant: xy | xX trials) are in red for the CTR group and light purple for the LPFC group. Dashed lines at −600, –450, −300, –150, and 0 ms depict tone onsets. Shaded areas around the waveforms represent the standard error of the mean (SEM). ERP, event-related potential; LPFC, lateral prefrontal cortex.
Figure 5—figure supplement 2.
Figure 5—figure supplement 2.. Local versus local + global deviance event-related potentials (ERPs).
(A) Local vs. local + global deviance response CTR group. To the left, healthy control participants’ grand average ERP waveforms at midline electrodes (from top to bottom: Fz, Cz, and Pz). ERPs from the processing of deviant tones predicted at the global level (local deviant: xy│xY trials) are in blue, and ERPs from the processing of deviant tones unpredicted at the global level (local + global deviant: xy│xX trials) are in red. Gray shaded bars indicate times when the electrode was part of a cluster showing significant within-group condition differences. At the bottom, the topographic scalp maps reflect the statistical difference values for the t-contrast of the two experimental conditions computed for the time window corresponding to the cluster with significant differences. (B) Group differences (CTR vs. OFC difference waves). To the right, CTR and OFC grand average ERP waveforms at the same midline electrodes. Difference wave ERPs from the processing of local deviant tones minus the processing of local + global deviant tones (xy│xX minus xy│xY trials) are in red for the CTR group and in green for the OFC group. Orange shaded bars indicate times when the electrode was part of a cluster showing significant differences between the two groups. At the bottom, the topographic scalp maps represent the statistical difference values for the t-contrast of the two groups computed for the time window corresponding to the cluster with observed group differences. Dashed lines at −600, –450, −300, –150, and 0 ms depict tone onsets. Shaded areas around the waveforms represent the standard error of the mean (SEM). OFC, orbitofrontal cortex.

Update of

  • doi: 10.1101/2023.01.04.521570

References

    1. Alain C, Woods DL, Knight RT. A distributed cortical network for auditory sensory memory in humans. Brain Research. 1998;812:23–37. doi: 10.1016/s0006-8993(98)00851-8. - DOI - PubMed
    1. Alexander WH, Brown JW. Medial prefrontal cortex as an action-outcome predictor. Nature Neuroscience. 2011;14:1338–1344. doi: 10.1038/nn.2921. - DOI - PMC - PubMed
    1. Alexander WH, Brown JW. A general role for medial prefrontal cortex in event prediction. Frontiers in Computational Neuroscience. 2014;8:69. doi: 10.3389/fncom.2014.00069. - DOI - PMC - PubMed
    1. Alho K, Woods DL, Algazi A, Knight RT, Näätänen R. Lesions of frontal cortex diminish the auditory mismatch negativity. Electroencephalography and Clinical Neurophysiology. 1994;91:353–362. doi: 10.1016/0013-4694(94)00173-1. - DOI - PubMed
    1. Aru J, Bachmann T, Singer W, Melloni L. Distilling the neural correlates of consciousness. Neuroscience & Biobehavioral Reviews. 2012;36:737–746. doi: 10.1016/j.neubiorev.2011.12.003. - DOI - PubMed

MeSH terms