. 2024 Feb 4;14(3):314.
doi: 10.3390/nano14030314.

Oro-Respiratory Dysbiosis and Its Modulatory Effect on Lung Mucosal Toxicity during Exposure or Co-Exposure to Carbon Nanotubes and Cigarette Smoke

Affiliations

Oro-Respiratory Dysbiosis and Its Modulatory Effect on Lung Mucosal Toxicity during Exposure or Co-Exposure to Carbon Nanotubes and Cigarette Smoke

Brijesh Yadav et al. Nanomaterials (Basel). .

Abstract

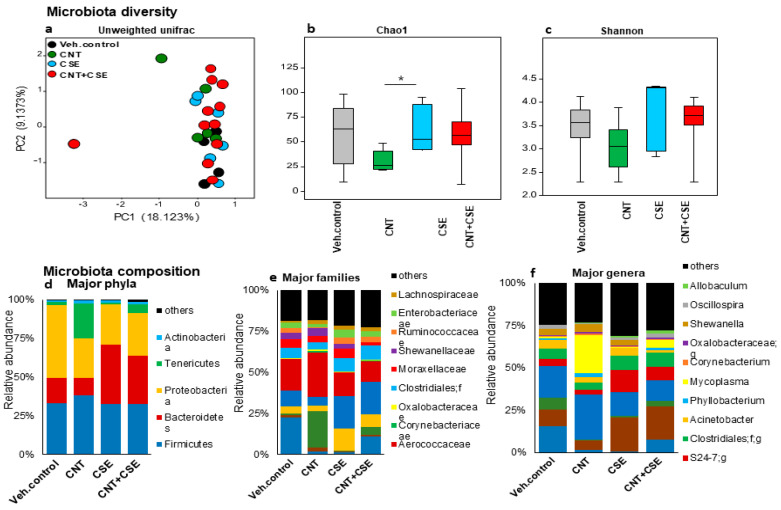
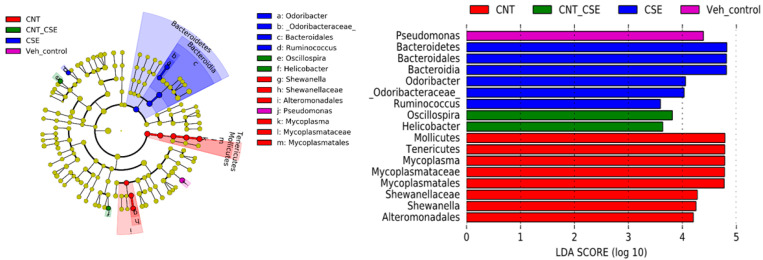
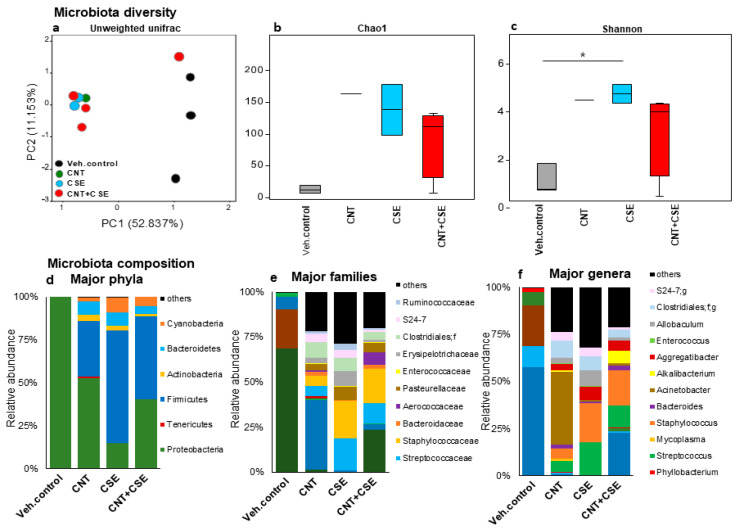
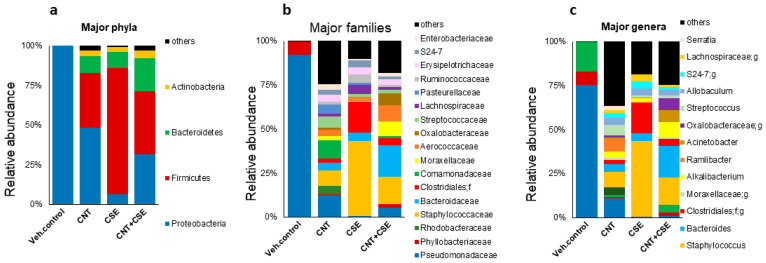
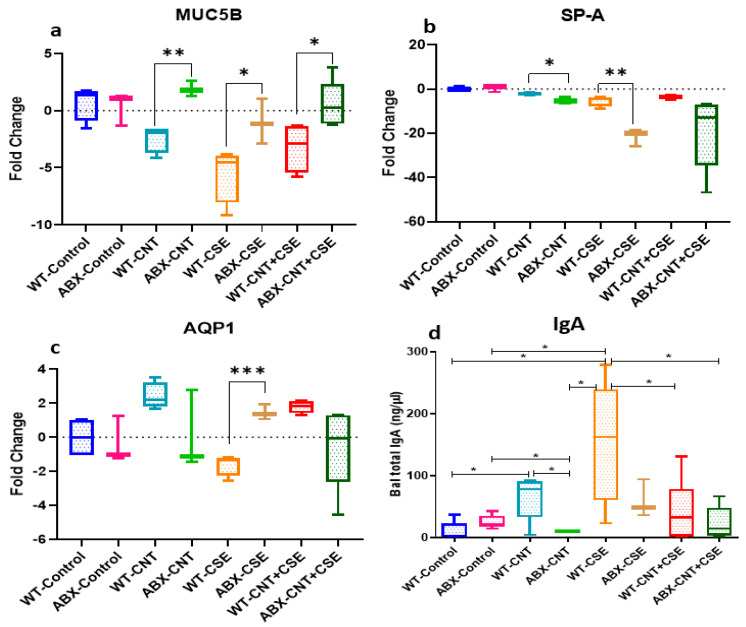
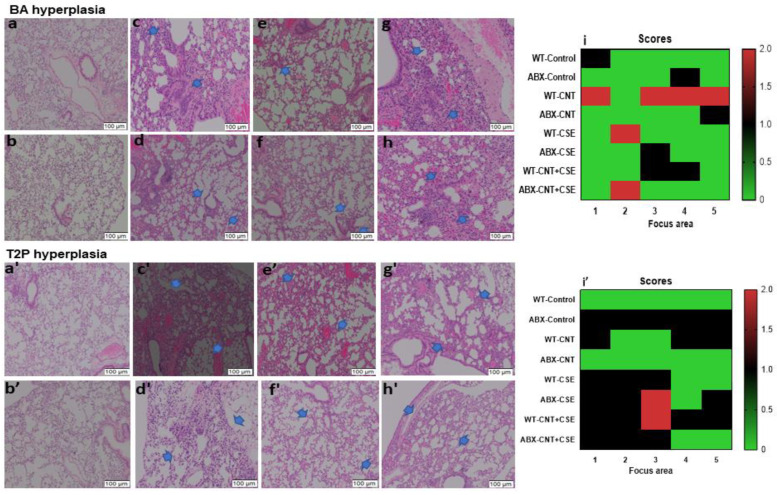
The oro-respiratory microbiome is impacted by inhalable exposures such as smoking and has been associated with respiratory health conditions. However, the effect of emerging toxicants, particularly engineered nanoparticles, alone or in co-exposure with smoking, is poorly understood. Here, we investigated the impact of sub-chronic exposure to carbon nanotube (CNT) particles, cigarette smoke extract (CSE), and their combination. The oral, nasal, and lung microbiomes were characterized using 16S rRNA-based metagenomics. The exposures caused the following shifts in lung microbiota: CNT led to a change from Proteobacteria and Bacteroidetes to Firmicutes and Tenericutes; CSE caused a shift from Proteobacteria to Bacteroidetes; and co-exposure (CNT+CSE) had a mixed effect, maintaining higher numbers of Bacteroidetes (due to the CNT effect) and Tenericutes (due to the CSE effect) compared to the control group. Oral microbiome analysis revealed an abundance of the following genera: Acinetobacter (CNT), Staphylococcus, Aggregatibacter, Allobaculum, and Streptococcus (CSE), and Alkalibacterium (CNT+CSE). These proinflammatory microbial shifts correlated with changes in the relative expression of lung mucosal homeostasis/defense proteins, viz., aquaporin 1 (AQP-1), surfactant protein A (SP-A), mucin 5b (MUC5B), and IgA. Microbiota depletion reversed these perturbations, albeit to a varying extent, confirming the modulatory role of oro-respiratory dysbiosis in lung mucosal toxicity. This is the first demonstration of specific oro-respiratory microbiome constituents as potential modifiers of toxicant effects in exposed lungs.

Keywords: carbon nanotubes; cigarette smoke extract; lung microbiome; nasal microbiome; oral microbiome.


Conflict of interest statement

The authors declare no conflicts of interest.

Figures

Figure 1
Figure 1
Lung microbiota diversity and compositional changes in mice in response to respiratory toxicants. The toxicants, animal exposure conditions, and lung microbiota DNA analyses are described in the Materials and Methods (Section 2). The top part of the figure depicts microbiota diversity showing differential microbiota clustering for beta diversity based on principal component analysis (a) and alpha diversity based on Chao1 index (b) and Shannon index (c), between the control and treated groups. The bottom part of the figure depicts microbiota composition at the phylum (d), family (e), and genus (f) level showing distinct differences in the CNT, CSE, and CNT+CSE groups compared to the control group. The differences in diversity and composition suggest definitive effects of the toxicant exposures.
Figure 2
Figure 2
Dominant operational taxonomical units (OTUs) of the lung microbiome in mice exposed to respiratory toxicants. The toxicants, animal exposure conditions, and lung microbiota DNA analyses are described in the Materials and Methods (Section 2). The LEfSe analysis shows a higher proportion of Mollicutes, Mycoplasma, Tenericutes, Shewanella, and Altermonadales in the CNT group; Bacteroidetes, Odoribacter, and Ruminococcus in the CSE group; and Oscillospira and Helicobacter in the CNT+CSE group.
Figure 3
Figure 3
Oral microbiota diversity and compositional changes in mice in response to respiratory toxicants. The toxicants, animal exposure conditions, and oral microbiota DNA analyses are described in the Materials and Methods (Section 2). The top part of the figure depicts oral microbiota diversity showing differential microbiota clustering between the control and treated groups for beta diversity based on principal component analysis (a) and alpha diversity based on Chao1 index (b) and Shannon index (c). The bottom part of the figure depicts oral microbiota compositional differences among the treatment groups at phylum (d), family (e), and genus (f) levels. At the genus level, the CNT group had a higher abundance of Acinetobacter, the CSE group had a higher abundance of Staphylococcus, Aggregatibacter, Allobaculum, and Streptococcus, and the CNT+CSE group had Alkalibacterium abundance.
Figure 4
Figure 4
Compositional changes in mouse nasal microbiota at various phylogenetic levels in response to different respiratory toxicants. The toxicants, animal exposure conditions, and nasal microbiota analyses are described in the Materials and Methods (Section 2). Nasal microbiome compositional differences among the treatment groups are shown at phylum (a), family (b), and genus (c) levels. The analysis revealed reduced Proteobacteria and increased Firmicutes in the CNT, CSE, and CNT+CSE groups compared to the control group.
Figure 5
Figure 5
Mucosal defense and homeostasis proteins in the exposed lungs from microbiota-depleted (ABX) mice relative to microbiota-intact (normal) mice. The toxicants and animal exposure conditions are described in the Materials and Methods (Section 2). The gene expression analysis for the following individual proteins measured in the lung tissue showed differential expression among the treatment groups: (a) Mucin 5b (MUC5B); (b) Surfactant protein-A (SP-A); (c) Aquaporin-1 (AQP-1). (d) Immunoglobulin A (IgA) level measured in the bronchoalveolar lavage (Bal) fluid was lower in microbiota-depleted mice. Note that the WT data presented here for comparison are leveraged from our earlier open access publication (Reference [26] published by “Frontiers”). Statistical comparisons between treatments are represented in terms of the level of significance (p-value) denoted using asterisks, as follows: (*) if p ≤ 0.05, (**) if p ≤ 0.01, and (***) if p ≤ 0.001.
Figure 6
Figure 6
Hyperplasia in the exposed lungs of microbiota-intact (normal) versus microbiota-depleted (ABX) mice subjected to different respiratory toxicants. The hyperplasia changes are shown by arrows in the H&E-stained images. The toxicants and animal exposure conditions are described in the Materials and Methods (Section 2). Bronchoalveolar (BA) hyperplasia is presented in the top part of the figure as follows: upper panels—(a) WT-Control; (c) WT-CNT; (e) WT-CSE; (g) WT-CNT+CSE; lower panels—(b) ABX-Control; (d) ABX+CNT; (f) ABX+CSE; (h) ABX+CNT+CSE. (i) Heat map showing the effects of different exposures. Type 2 pneumocyte (T2P) hyperplasia, also known as alveolar Type2 epithelial cell hyperplasia, is presented in the bottom part of the figure as follows: upper panels—(a’) WT-Control; (c’) WT-CNT; (e’) WT-CSE; (g’) WT-CNT+CSE; lower panels—(b’) ABX-Control; (d’) ABX+CNT; (f’) ABX+CSE; (h’) ABX+CNT+CSE. (i’) Heat map showing the effects of different exposures. The x-axis numbers 1–5 in panel (i) and (i’) represent the five different focus areas analyzed per slide. The y-axis numbers 0, 0.5, 1.0,1.5, and 2.0 in panel (i) and (i’) represent the injury scores on a 0 to 4 scale, with 0 being normal and 4 being severe. Microbiota depletion resulted in a lower grade of hyperplasia (BA and T2P) in either CNT- or CSE-exposed mice.

References

    1. Rahman G., Najaf Z., Mehmood A., Bilal S., Shah A.H., Mian S.A., Ali G. An Overview of the Recent Progress in the Synthesis and Applications of Carbon Nanotubes. C. 2019;5:3. doi: 10.3390/c5010003. - DOI
    1. Ravichandran P., Baluchamy S., Gopikrishnan R., Biradar S., Ramesh V., Goornavar V., Thomas R., Wilson B.L., Jeffers R., Hall J.C., et al. Pulmonary Biocompatibility Assessment of Inhaled Single-Wall and Multiwall Carbon Nanotubes in BALB/c Mice. J. Biol. Chem. 2011;286:29725–29733. doi: 10.1074/jbc.M111.251884. - DOI - PMC - PubMed
    1. Chetyrkina M.R., Fedorov F.S., Nasibulin A.G. In Vitro Toxicity of Carbon Nanotubes: A Systematic Review. RSC Adv. 2022;12:16235–16256. doi: 10.1039/D2RA02519A. - DOI - PMC - PubMed
    1. Frank E.A., Carreira V.S., Shanmukhappa K., Medvedovic M., Prows D.R., Yadav J.S. Genetic Susceptibility to Toxicologic Lung Responses among Inbred Mouse Strains Following Exposure to Carbon Nanotubes and Profiling of Underlying Gene Networks. Toxicol. Appl. Pharmacol. 2017;327:59–70. doi: 10.1016/j.taap.2017.04.019. - DOI - PMC - PubMed
    1. Frank E.A., Carreira V.S., Birch M.E., Yadav J.S. Carbon Nanotube and Asbestos Exposures Induce Overlapping but Distinct Profiles of Lung Pathology in Non-Swiss Albino CF-1 Mice. Toxicol. Pathol. 2016;44:211–225. doi: 10.1177/0192623315620587. - DOI - PMC - PubMed

LinkOut - more resources