. 2024 Jan 25;13(3):222.
doi: 10.3390/cells13030222.

Nuclear VANGL2 Inhibits Lactogenic Differentiation

Affiliations

Nuclear VANGL2 Inhibits Lactogenic Differentiation

Stefany Rubio et al. Cells. .

Abstract

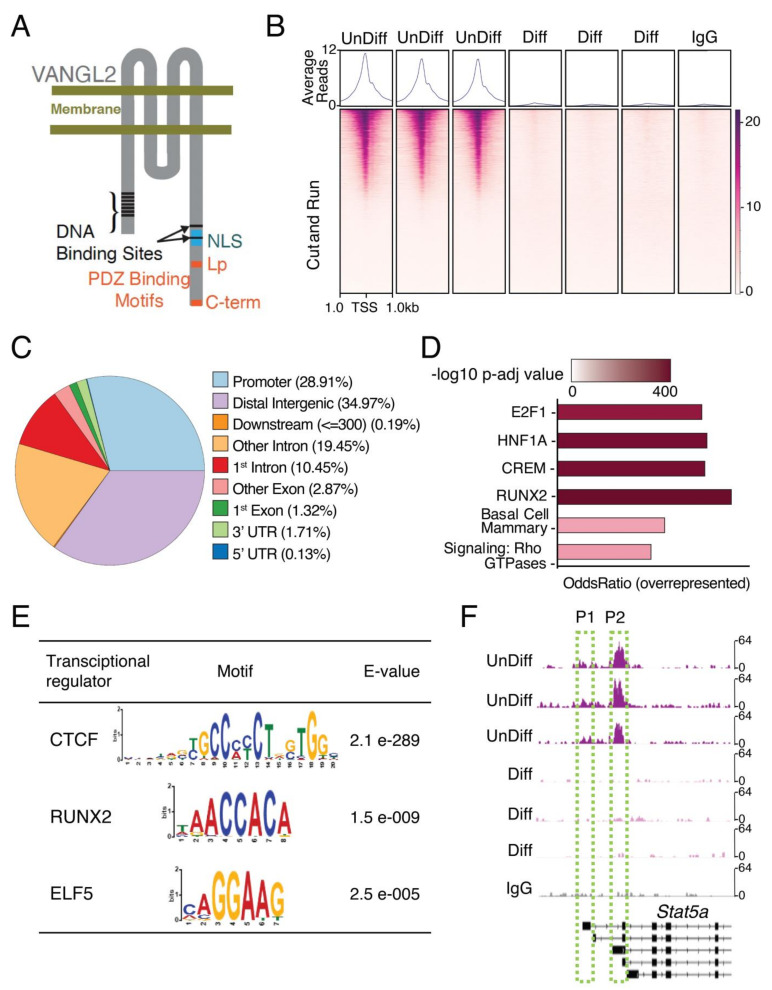
Planar cell polarity (PCP) proteins coordinate tissue morphogenesis by governing cell patterning and polarity. Asymmetrically localized on the plasma membrane of cells, transmembrane PCP proteins are trafficked by endocytosis, suggesting they may have intracellular functions that are dependent or independent of their extracellular role, but whether these functions extend to transcriptional control remains unknown. Here, we show the nuclear localization of transmembrane, PCP protein, VANGL2, in the HCC1569 breast cancer cell line, and in undifferentiated, but not differentiated, HC11 cells that serve as a model for mammary lactogenic differentiation. The loss of Vangl2 function results in upregulation of pathways related to STAT5 signaling. We identify DNA binding sites and a nuclear localization signal in VANGL2, and use CUT&RUN to demonstrate recruitment of VANGL2 to specific DNA binding motifs, including one in the Stat5a promoter. Knockdown (KD) of Vangl2 in HC11 cells and primary mammary organoids results in upregulation of Stat5a, Ccnd1 and Csn2, larger acini and organoids, and precocious differentiation; phenotypes are rescued by overexpression of Vangl2, but not Vangl2ΔNLS. Together, these results advance a paradigm whereby PCP proteins coordinate tissue morphogenesis by keeping transcriptional programs governing differentiation in check.

Keywords: VANGL2; mammary gland; nuclear localization.


Conflict of interest statement

The authors have no conflicts of interest.

Figures

Figure 1
Figure 1
VANGL2 localizes to the nucleus in undifferentiated HC11 cells. (A) Cartoon illustration of the HC11 cell differentiation process. Cells were grown to confluence and cultured for 2 days, before priming for 18 h in the absence of epidermal growth factor (EGF) and presence of dexamethasone (D) and insulin (I). Then, the cultures were induced to differentiate by culturing in dexamethasone, insulin, and prolactin (DIP) for up to seven days. (BD) Representative phase contrast (top panel) or immunofluorescence (bottom panels) micrographs of HC11 cells at different stages of differentiation: confluent (B), primed (C), and day 7 of differentiation (D). Immunofluorescence shows cells stained for VANGL2 (white), BMI1 (pink), and nuclei labeled with Hoechst (blue). Dashed circle indicates milk dome. Scale = 10 µm. (E) Representative immunofluorescent micrographs of nuclei isolated from confluent HC11 cells and stained for VANGL2 (white), BMI1 (pink), and Lamin B1 (LMNB1; orange). Nuclei labeled with Hoechst (blue). Arrows indicates VANGL2 puncta. Scale = 0.5 µm (F) Representative Western blot of phosphoVANGL2 (pV2) at different stages of differentiation: confluent (C), primed (P), and differentiated day 7 (D). HC11 whole cell lysates (WCL) were fractionated as follows: cytosolic/membrane (Cyto/Memb), soluble nuclear (Nuclear), and insoluble nuclear (Isol Nuc). Fractions were assessed using specific antibodies: ß-tubulin I (TUBB) for cytoplasmic/membrane fraction and histone H3 (HH3) for nuclear fraction. One form of VANGL2 was observed: hyperphosphorylated, ***. (G) Quantification of pVANGL2 relative to its loading controls of ß-tubulin I (TUBB) for cytoplasmic/membrane fraction and histone H3 (HH3) for nuclear fraction. PhosphoVANGL2 levels were normalized relative to confluent. (H) Representative Western blot of VANGL2 (V2) at different stages of differentiation: confluent (C), primed (P), and differentiated day 7 (D). HC11 whole cell lysates (WCL) were fractionated as described in (F). Four forms of VANGL2 were observed: unphosphorylated, #; hypophosphorylated, ##; phosphorylated, ###; and hyperphosphorylated, ####. (I) Quantification of VANGL2 relative to its loading controls as described in (G). VANGL2 levels were normalized relative to confluent. For (G,I), N = 3 biological replicates. Data are represented as mean ± S. E. M. p-values determined using unpaired t-test with Welch’s correction. p values: ns ≥ 0.05, * < 0.05, ** < 0.01, **** < 0.0001.
Figure 2
Figure 2
Undifferentiated Vangl2 KO cells have increased polyploidy and express genes involved in lactogenic differentiation. (A) Western blot quantification of VANGL2 in Vangl2 KD1 and Vangl2 KD 2 HC11 cells. (B) Representative immunofluorescent micrographs of WT, Vangl2 KD1, and Vangl2 KD2 cells immunostained for F-actin (magenta). Nuclei labeled with Hoechst (blue). Arrows indicate large nuclei in the KD cells. Scale = 50 µm. (C) Representative FACS dot plots showing forward scatter (FSC-A) and side scatter (SSC-A) properties of WT, Vangl2 KD1, and Vangl2 KD2 HC11 cells. (D) Percentage of WT, Vangl2 KD1, and Vangl2 KD2 HC11 cells with high scatter properties. (E) Percentage of WT, Vangl2 KD1, and Vangl2 KD2 HC11 cells with > 4C DNA content. (F) Representative immunofluorescence micrographs of WT cells, and Vangl2 KD1 and Vangl2 KD2 cells immunostained for STAT5 (green) with nuclei labeled with Hoechst (blue). Scale = 50 µm. (G) Quantification of the percentage of cells stained positive for STAT5. (H) Representative immunofluorescent micrographs of WT cells, and Vangl2 KD1 and Vangl2 KD2 cells immunostained for ELF5 (green) with nuclei stained by Hoechst (blue). Scale = 50 µm. (I) Quantification of the percentage of cells stained positive for ELF5. (J) Representative immunofluorescent micrographs of WT, Vangl2 KD1, and Vangl2 KD2 cells immunostained for CCND1 (green) with nuclei labeled with Hoechst (blue). Scale = 50 µm. (K) Quantification of the percentage of cells stained positive for CCND1. For (D,E), N = 3 biological replicates and for (G,I,K), N = 4 biological replicates. Data are shown as mean ± SD. Two-tailed unpaired Student’s t-test. p values: p values: ns ≥ 0.05, * < 0.05, ** < 0.01, *** < 0.001, **** < 0.0001.
Figure 3
Figure 3
VANGL2 is recruited to distinct promoter sequences, including the Stat5a P2 promoter. (A) Cartoon illustration of VANGL2 showing DNA binding sites, nuclear localization signal (NLS), and two PDZ binding motifs, one containing the looptail (Lp) locus and another at the C-terminus (C-term). (B) Average plot (top) and heatmap (bottom) of VANGL2 CUT&RUN reads around the transcription start site (TSS ± 1 kb) from undifferentiated (unDiff) or differentiated (Diff) HC11 cells in triplicate, or of non-specific rabbit IgG CUT&RUN reads. The gradient purple color indicates high-to-low counts in the corresponding TSS regions. (C) Proportion of peaks called from VANGL2-enriched CUT&RUN reads corresponding to different genomic regions shown in color. (D) Enriched pathways of genes overrepresented in the undifferentiated HC11 cells (unDiff) as identified by VANGL2 CUT&RUN reads. The color gradient scale is logarithmic, with the darker colors representing higher p-values. E2F1, HNF1A, CREM, and RUNX2 were identified through ChIPSeq database, Basal Cell Mammary through Tabula Muris, and Signaling by Rho GTPases through REACTOME. (E) Motif analysis performed by MEME and STREME shows transcription factors motifs identified by VANGL2 CUT&RUN reads in undifferentiated HC11 cells (unDiff). The height of each letter is proportional to its frequency at that particular position. E-values estimate the expected number of motifs that would be found in a similarly sized set of random sequences. (F) Integrative Genomics Viewer (IGV) browser tracks showing VANGL2 binding in the promoter 1 (P1) and promoter 2 (P2) regions within the Stat5a gene locus in undifferentiated HC11 cells (unDiff), differentiated HC11 cells (Diff), or anti-rabbit IgG. All samples have the same scaling factor (0–64) for the y-axis.
Figure 4
Figure 4
VANGL2 contains a nuclear localization signal that inhibits proliferation and acini formation. (A) Cartoon illustration showing WT and ΔNLS Vangl2 lentiviral constructs. Black lines represent DNA binding sites, blue lines represent the nuclear localization signal (NLS) and orange lines represent the PDZ domains. (B) Representative immunofluorescence micrographs of acini grown in 3D Matrigel: WT, Vangl2 KD1, and Vangl2 KD2 HC11 cells that overexpress either WT Vangl2 or Vangl2 ΔNLS lentiviral constructs. Acini were immunostained for KRT14 (pink) with nuclei labeled with Hoechst (blue). (C) Quantification of acini area after being grown for 5 days in 3D Matrigel: WT, Vangl2 KD1, and Vang2 KD2 HC11 cells each overexpressing either Scr control, WT Vangl2, or ΔNLS Vangl2 lentiviral constructs. (D) Quantification of the Stat5a expression in acini grown for 5 days in 3D Matrigel: WT HC11 cells, Vangl2 KD1, and Vang2 KD2 cells each overexpressing either Scr control, WT Vangl2, or ΔNLS Vangl2 lentiviral constructs. (E) Quantification of the Csn2 expression in acini grown for 5 days and then differentiated for 2 days in 3D Matrigel: WT, Vangl2 KD1, and Vang2 KD2 HC11 cells each overexpressing either Scr control, WT Vangl2, or ΔNLS Vangl2 lentiviral constructs. (F) Quantification of the Wap expression in acini grown for 5 days and then differentiated for 2 days in 3D Matrigel: WT, Vangl2 KD1, and Vang2 KD2 HC11 cells each overexpressing either Scr control, WT Vangl2, or ΔNLS Vangl2 lentiviral constructs. For (CF), N = 3 biological replicates. Data are shown as mean ± SD. For (C), data are from 10 organoids. Kruskal–Wallis test. For (CF), one-way ANOVA Tukey’s test. p values: ns ≥ 0.05, * < 0.05, ** < 0.01, *** < 0.001, **** < 0.0001.
Figure 5
Figure 5
Nuclear function of VANGL2 is to repress genes that promote lactogenic differentiation. (A) Cartoon illustration showing mosaic organoids generated from primary murine mammary epithelial cells in which the basal compartment comprises WT primary mammary basal cells and the luminal compartment comprises either WT primary luminal cells (WT/WT 1° LECs) or Vangl2KD primary luminal cells overexpressing Scr control (WT/KD + Scr 1° LECs), Vangl2KD primary luminal cells overexpressing Vangl2 (WT/KD + V2 1° LECs), or Vangl2KD primary luminal cells overexpressing Vangl2ΔNLS (WT/KD + V2ΔNLS) 1° LECs). (B) Representative immunofluorescence micrographs of mosaic organoids, as cartooned in (A), grown for 7 days and then differentiated for 2 days in 3D Matrigel. Organoids were immunostained for KRT8 (magenta), with nuclei labeled with Hoechst (blue). Scale = 10 µm. (C) Quantification of the area of mosaic organoids grown for 7 days and then differentiated for 2 days in 3D Matrigel. (DF) Quantification of the Stat5a (D), Ccnd1 (E), and Csn2 (F) expression in organoids grown for 7 days and then differentiated for 2 days in 3D Matrigel. For (C), N = 3 biological replicates. Data are shown as mean of means ± SEM. Orange dots represent values from 30 organoids from N = 3 biological replicates (10 organoids/replicate). Black dots represent the mean area of each biological replicate. One-way ANOVA Tukey’s test. For (DF), N = 3 biological replicates. Data are shown as mean ± SEM. One-way ANOVA Tukey’s test. p values: ns ≥ 0.05, * < 0.05, ** < 0.01, *** < 0.001.

Update of

References

    1. Aw W.Y., Devenport D. Planar cell polarity: Global inputs establishing cellular asymmetry. Curr. Opin. Cell Biol. 2017;44:110–116. doi: 10.1016/j.ceb.2016.08.002. - DOI - PMC - PubMed
    1. Xie Y., Miao H., Blankenship J.T. Membrane trafficking in morphogenesis and planar polarity. Traffic. 2018;19:679–689. doi: 10.1111/tra.12580. - DOI - PMC - PubMed
    1. Gong Y., Li Z., Zou S., Deng D., Lai P., Hu H., Yao Y., Hu L., Zhang S., Li K., et al. Vangl2 limits chaperone-mediated autophagy to balance osteogenic differentiation in mesenchymal stem cells. Dev. Cell. 2021;56:2103–2120.e9. doi: 10.1016/j.devcel.2021.06.011. - DOI - PubMed
    1. Puvirajesinghe T.M., Bertucci F., Jain A., Scerbo P., Belotti E., Audebert S., Sebbagh M., Lopez M., Brech A., Finetti P., et al. Identification of p62/SQSTM1 as a component of non-canonical Wnt VANGL2-JNK signalling in breast cancer. Nat. Commun. 2016;7:10318. doi: 10.1038/ncomms10318. - DOI - PMC - PubMed
    1. Sheng X., Gao S., Sheng Y., Xie X., Wang J., He Y. Vangl2 participates in the primary ciliary assembly under low fluid shear stress in hUVECs. Cell Tissue Res. 2022;387:95–109. doi: 10.1007/s00441-021-03546-0. - DOI - PubMed

MeSH terms