. 2024 Jan 27;13(3):242.
doi: 10.3390/cells13030242.

Preparation of Viable Human Neurites for Neurobiological and Neurodegeneration Studies

Affiliations

Preparation of Viable Human Neurites for Neurobiological and Neurodegeneration Studies

Markus Brüll et al. Cells. .

Abstract

Few models allow the study of neurite damage in the human central nervous system. We used here dopaminergic LUHMES neurons to establish a culture system that allows for (i) the observation of highly enriched neurites, (ii) the preparation of the neurite fraction for biochemical studies, and (iii) the measurement of neurite markers and metabolites after axotomy. LUHMES-based spheroids, plated in culture dishes, extended neurites of several thousand µm length, while all somata remained aggregated. These cultures allowed an easy microscopic observation of live or fixed neurites. Neurite-only cultures (NOC) were produced by cutting out the still-aggregated somata. The potential application of such cultures was exemplified by determinations of their protein and RNA contents. For instance, the mitochondrial TOM20 protein was highly abundant, while nuclear histone H3 was absent. Similarly, mitochondrial-encoded RNAs were found at relatively high levels, while the mRNA for a histone or the neuronal nuclear marker NeuN (RBFOX3) were relatively depleted in NOC. Another potential use of NOC is the study of neurite degeneration. For this purpose, an algorithm to quantify neurite integrity was developed. Using this tool, we found that the addition of nicotinamide drastically reduced neurite degeneration. Also, the chelation of Ca2+ in NOC delayed the degeneration, while inhibitors of calpains had no effect. Thus, NOC proved to be suitable for biochemical analysis and for studying degeneration processes after a defined cut injury.

Keywords: Wallerian degeneration; axotomy; neurite isolation; neurospheres; nicotinamide.


Conflict of interest statement

The authors declare no conflicts of interest.

Figures

Figure 1
Figure 1
Spatial separation of neurites and cell bodies in 2.5D culture of LUHMES spheroids. (A) Schematic overview of culture protocol to obtain plated LUHMES spheroids. LUHMES spheroids were generated in round bottom plates by seeding 10,000 cells per well on day of differentiation (DoD) 2. Spheroids were transferred to a Matrigel-coated flat bottom plate on DoD 9, where they grew out neurites radially. Spheroids were left to grow neurites for 5 days (until DoD 14). FGF = fibroblast growth factor, cAMP = cyclic adenosine monophosphate, GDNF = glial cell-derived neurotrophic factor, Fbn = fibronectin, PLO = poly-L-ornithine, ULA = ultra-low attachment plastic surface, T75 = tissue culture flasks. (B) Representative image of a calcein-AM/Hoechst (H-33342)-stained plated spheroid after 5 days of neurite outgrowth (DoD 14). The central cell bodies are shown as the image insert on the right (DNA stained with H-33342). Note that the nuclear stain is shown at a higher magnification and a different focal plane than the whole organoid in the calcein channel. The image was focused on the outer nuclei. (C) Scanning electron microscopy (SEM) image of a plated spheroid 5 days after plating (DoD 14) on “minimal Matrigel coating”. White open squares indicate images shown in detail in (D,E). Note that higher Matrigel amounts were used in standard cultures (see Figure S1), but “minimal Matrigel conditions” were used to obtain cleaner SEM images. (D) Higher magnification image of the central spheroid. A detailed image of the spheroid surface is shown below. Cell bodies were pseudo-colored in red. (E) Higher magnification images of the neurites radially grown out of the spheroid. Note the occurrence of neurite blebs (2–3 µm in diameter) on proximal, but not distal, neurites. (F) Example SEM images of growth cones present at the distal tips of the outgrown neurites.
Figure 2
Figure 2
Production and characterization of neurite-only cultures (NOC). (A) Schematic overview of the process to generate neurite-only cultures (NOC) from plated LUHMES spheroids. Five days after plating (DoD 14), the central spheroids (containing all somata) were manually removed from the culture. The resulting NOC were either analyzed directly after soma removal, or at different later time points. FGF = fibroblast growth factor, cAMP = cyclic adenosine monophosphate, GDNF = glial cell-derived neurotrophic factor, Fbn = fibronectin, PLO = poly-L-ornithine, ULA = ultra-low attachment plastic surface, T75 = tissue culture flasks. (B) Representative image of isolated neurites. Note the absence of any nuclei in the image insert (same scale). N.B.: the non-cut counterpart is shown in Figure 1B; a representative overview across many wells is provided in Figure S2. (C) Western blot analysis of marker proteins. To obtain protein samples, 10 wells of plated spheroids with cell bodies (whole) or without cell bodies (neurites) were pooled for each sample. Each well was sampled with 20 µL Laemmli buffer. The “3×” sample contains neurites sampled with 7µL Laemmli buffer per well to obtain higher protein concentrations (30 wells were pooled in total). The same volume of sample (20 µL) was loaded in each lane. (D) The total RNA was prepared from neurites or whole cell samples. For each biological replicate, 30 wells were pooled and the total amount of RNA per sample was quantified by UV spectroscopy (N = 5).
Figure 3
Figure 3
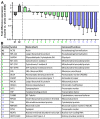
Quantification of relative RNA abundances in neurites. (A) RNA was isolated from NOCs or whole cell preparations. The same amount of total RNA was used for analysis by real-time quantitative PCR (RT-qPCR). Expression data were normalized to the geometric mean of ACTB and RPL13A levels (housekeeping genes). The ratio of normalized RNA levels of NOCs vs. whole cell samples was calculated and displayed. Neurite RNAs which were at least 3-fold less abundant (dotted line) in neurites are depicted in blue, and RNAs which were found at similar abundance (fold difference < 3) are depicted in green. Housekeeping genes are shown in grey. Detailed data are disclosed in Figure S3. (B) Information on the RNAs shown in (A). Where applicable, the names of the translated proteins are shown. DH = dehydrogenase, SU = subunit.
Figure 4
Figure 4
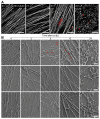
Morphological features of axotomy-induced neurite degeneration. (A) NOC were produced as described in Figure 2. They were fixed at different time points after axotomy and immunostained against βIII-tubulin. Images were recorded using epifluorescence microscopy. Arrows indicate neurite beading, and arrowheads indicate tubulin aggregates in fully fragmented neurites. Scale bar = 50 µm. (B) NOC were isolated and fixed at different time points after axotomy. Scanning electron microscopy images were recorded at 2500× magnification. Three representative images per time point are shown. Red arrowheads indicate exemplary neurite fragmentation. Scale bars = 10 µm.
Figure 5
Figure 5
Live cell observation of progressive degeneration of NOC over time. (A) NOC were produced as described in Figure 2 and live-stained with calcein-AM at different time points after axotomy. Images were recorded by epifluorescence microscopy. Note that all stained areas (including fragments) are surrounded by “intact” plasma membranes (impermeable to calcein). Scale bar = 200 µm. (B) RFP-expressing LUHMES were used to track the neurite morphology in live NOC over time. Timelapse images were recorded every 10 min by epifluorescence microscopy. Representative images are shown (Supplementary Material Video S1). Arrows indicate neurite beading, and arrowheads indicate fully fragmented neurites. Scale bar = 200 µm.
Figure 6
Figure 6
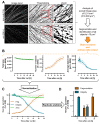
Workflow for quantification of neurite degeneration in NOC. (A) For quantification of neurite degeneration in NOC, fluorescence images of RFP were recorded at different time points after the axotomy (c.f. Figure 5B). Images were background corrected and then converted to binary (black–white) images by thresholding. Note that the same algorithm was also applicable to calcein-stained NOC. All objects >10 µm2 were identified in each image and used for further analysis. (B) Object data were quantified and the raw data output was plotted over time. This included the total object area (= neurite-covered area), the number of objects per image (providing information on the fragmentation level), and the average size of the objects identified per image (providing information on neurite integrity). (C) The raw data were normalized for standardization across experimental runs. The number of objects was normalized to the absolute numbers of fully degenerated cultures. Images of non-cut neurites were regarded as 0% fragmented. The average size of objects was normalized to absolute numbers of an intact control. (D) Normalized values were used to replicate statistics at individual time points. To evaluate statistical significance, a one-way ANOVA was performed, with Dunnet’s post hoc test, relative to 0 h. *** p < 0.001. In the example given, five cultures were analyzed.
Figure 7
Figure 7
Modulation of neurite degeneration by pharmacological interventions. (A) LUHMES 2.5D cultures (DoD15) were generated, as in Figure 2. They were treated with different concentrations of nicotinamide 15 min before axotomy. At 18 h after axotomy, neurites were stained with calcein-AM and imaged by epifluorescence microscopy. Representative images are shown. Scale bar = 200 µm. (B) Quantification of neurite fragmentation and integrity 18 h (as in Figure 6) after axotomy, in the presence of different concentrations of nicotinamide. (C) ATP concentration in neurites 18 h after axotomy, in the presence of different concentrations of nicotinamide. Data were normalized to samples from NOC prepared immediately after axotomy. (D) Total concentrations of reduced plus oxidized nicotinamide adenine dinucleotide (NAD(H)) in neurites 18 h after axotomy, in the presence of different concentrations of nicotinamide. Data were normalized to samples from NOC prepared immediately after axotomy. A one-way ANOVA was performed, followed by Dunnet’s post hoc test. ** p < 0.01. *** p < 0.001. (E) Cultures were treated with the calcium chelator EGTA (5 mM) 15 min before axotomy. At 18 h after axotomy, NOC were stained with calcein-AM and imaged using epifluorescence microscopy. Representative images are shown. Below the images, the quantitative data on fragmentation and integrity (±95% confidence interval) are given (N = 3, n = 5). Scale bar = 200 µm.

References

    1. Carelli V., La Morgia C., Ross-Cisneros F.N., Sadun A.A. Optic neuropathies: The tip of the neurodegeneration iceberg. Hum. Mol. Genet. 2017;26:R139–R150. doi: 10.1093/hmg/ddx273. - DOI - PMC - PubMed
    1. Newman N.J., Yu-Wai-Man P., Biousse V., Carelli V. Understanding the molecular basis and pathogenesis of hereditary optic neuropathies: Towards improved diagnosis and management. Lancet Neurol. 2023;22:172–188. doi: 10.1016/S1474-4422(22)00174-0. - DOI - PubMed
    1. Burke R.E., O’Malley K. Axon degeneration in Parkinson’s disease. Exp. Neurol. 2013;246:72–83. doi: 10.1016/j.expneurol.2012.01.011. - DOI - PMC - PubMed
    1. Krauss R., Bosanac T., Devraj R., Engber T., Hughes R.O. Axons Matter: The Promise of Treating Neurodegenerative Disorders by Targeting SARM1-Mediated Axonal Degeneration. Trends Pharmacol. Sci. 2020;41:281–293. doi: 10.1016/j.tips.2020.01.006. - DOI - PubMed
    1. Lee B., Cho Y. Experimental Model Systems for Understanding Human Axonal Injury Responses. Int. J. Mol. Sci. 2021;22:474. doi: 10.3390/ijms22020474. - DOI - PMC - PubMed

Publication types

LinkOut - more resources