. 2024 Feb 1;13(3):275.
doi: 10.3390/cells13030275.

Deep-Learning-Based Analysis Reveals a Social Behavior Deficit in Mice Exposed Prenatally to Nicotine

Affiliations

Deep-Learning-Based Analysis Reveals a Social Behavior Deficit in Mice Exposed Prenatally to Nicotine

Mengyun Zhou et al. Cells. .

Abstract

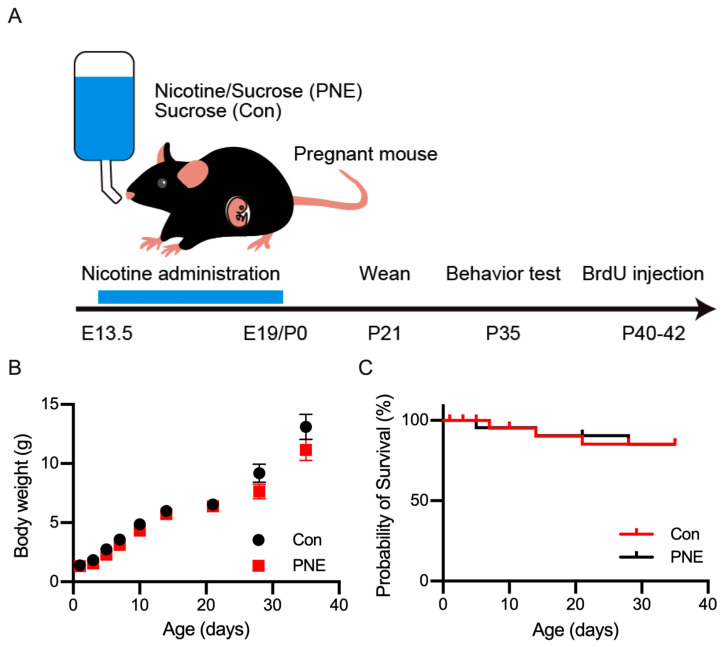
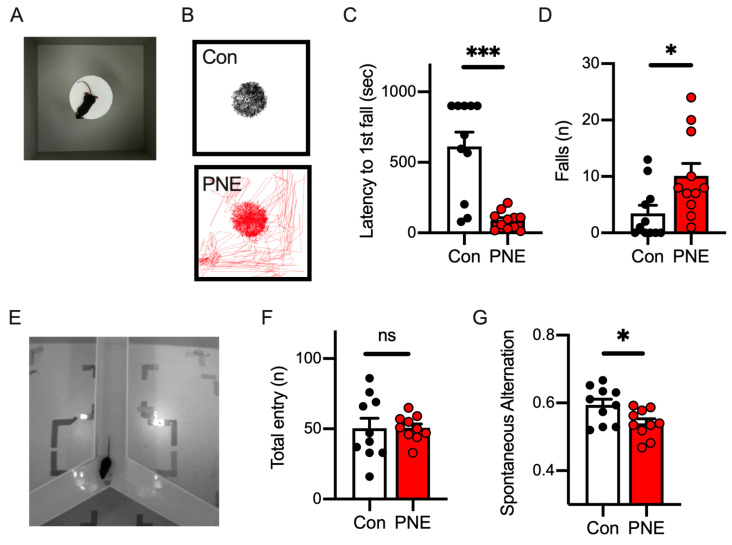
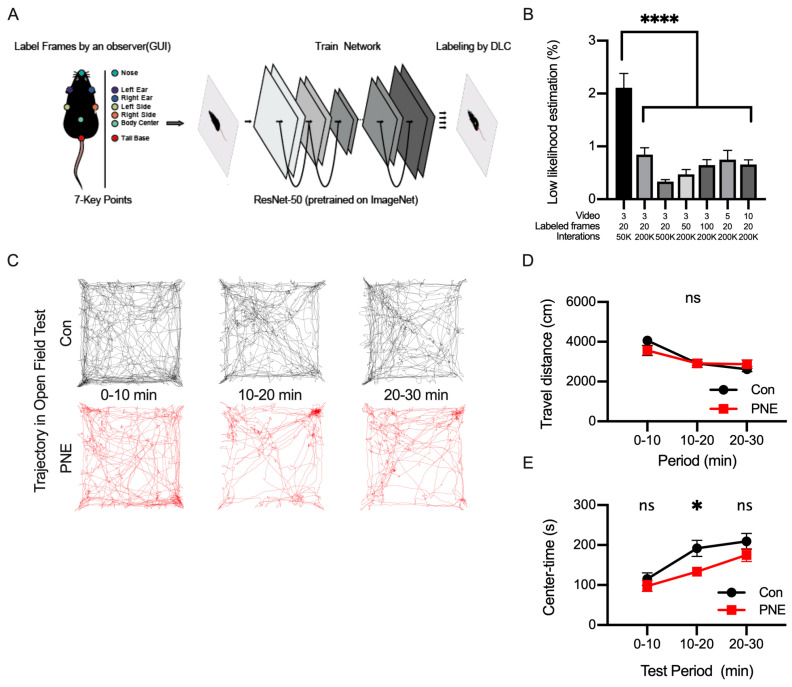
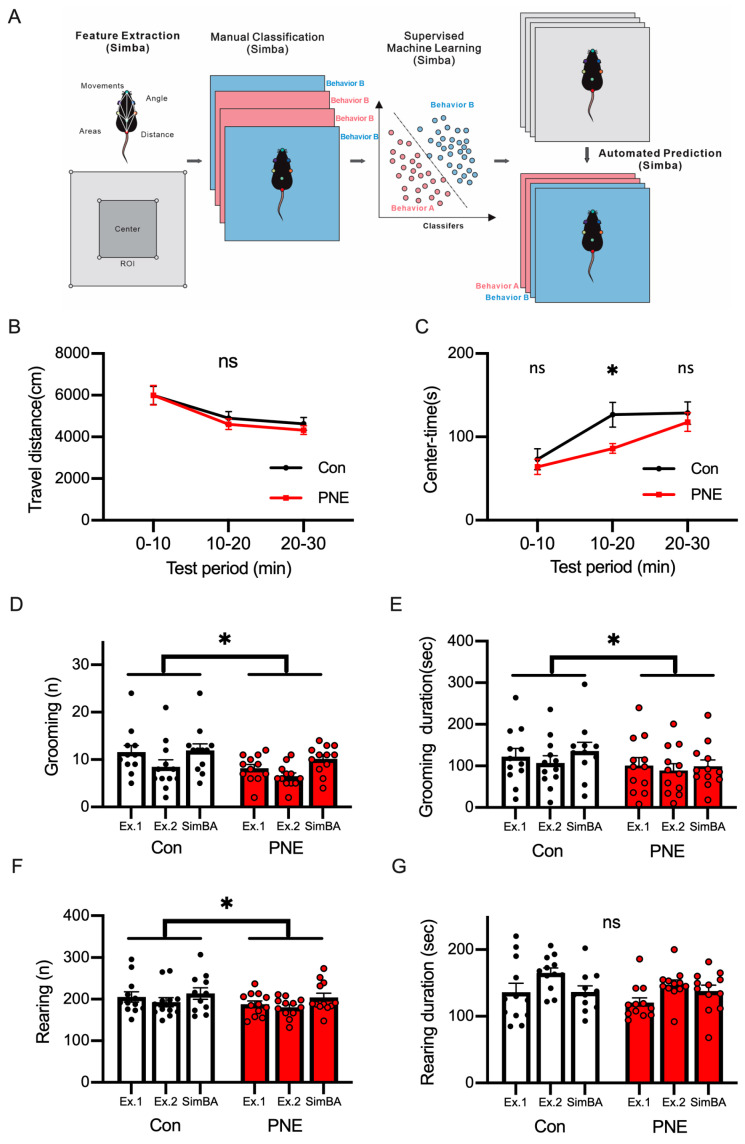
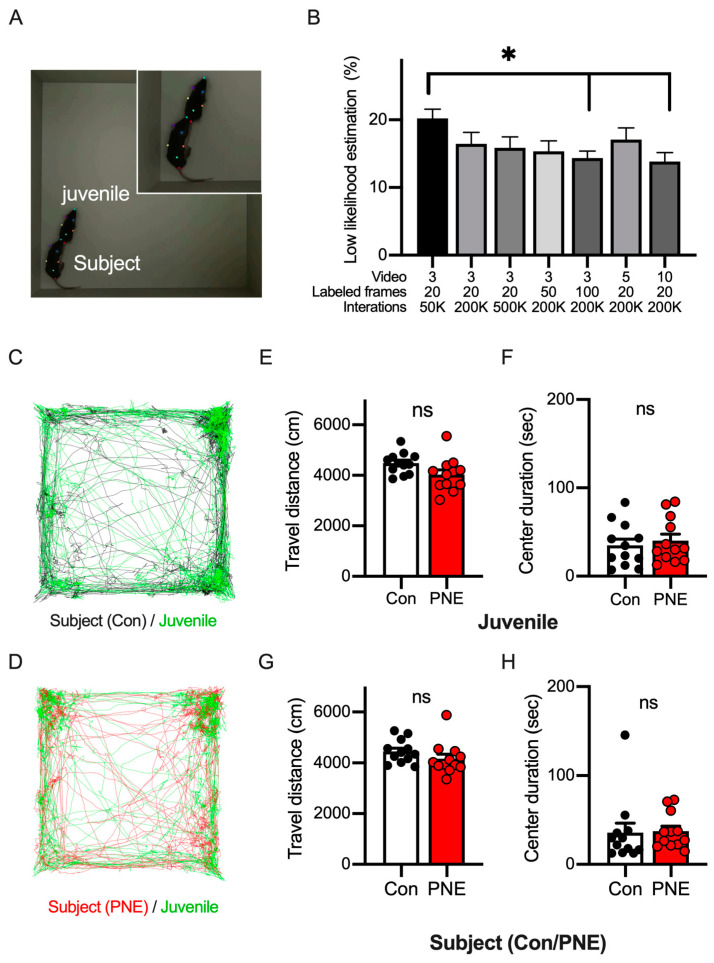
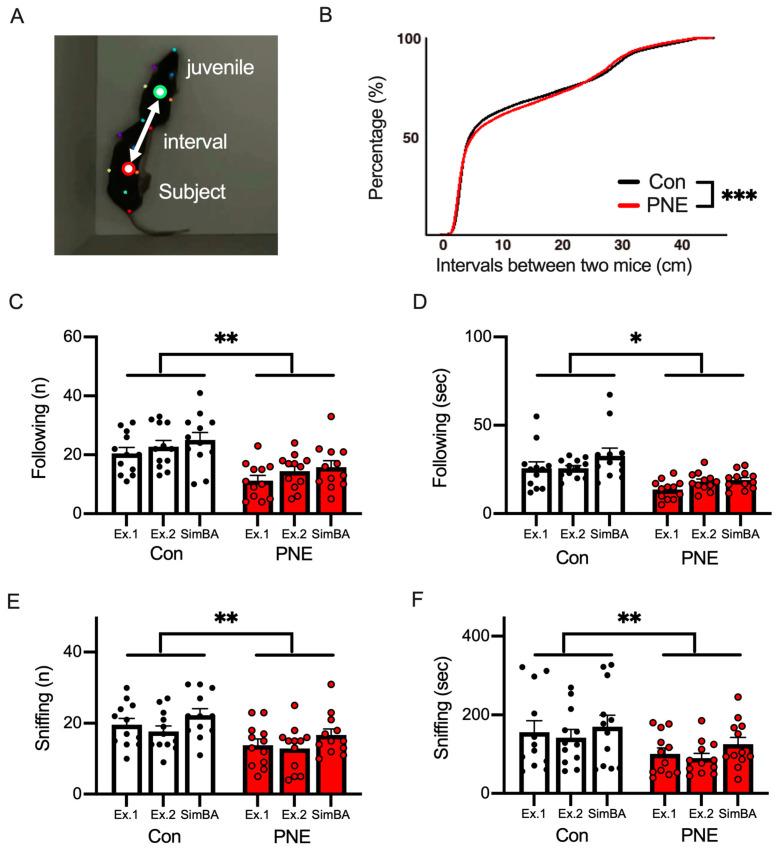
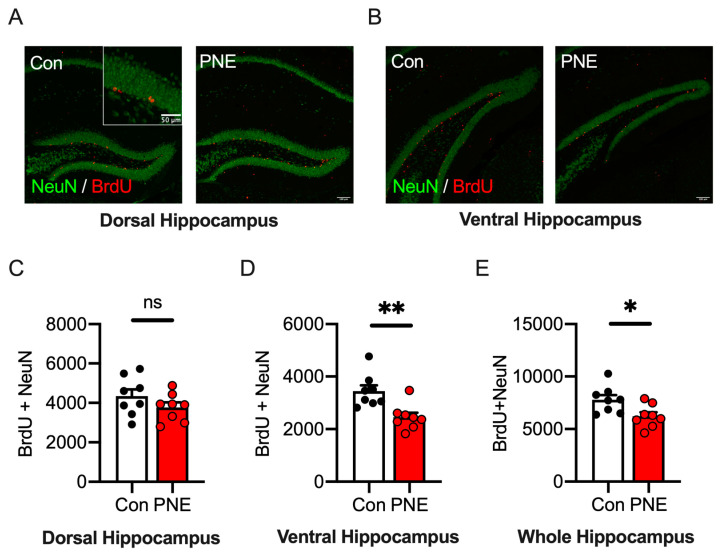
Cigarette smoking during pregnancy is known to be associated with the incidence of attention-deficit/hyperactive disorder (ADHD). Recent developments in deep learning algorithms enable us to assess the behavioral phenotypes of animal models without cognitive bias during manual analysis. In this study, we established prenatal nicotine exposure (PNE) mice and evaluated their behavioral phenotypes using DeepLabCut and SimBA. We optimized the training parameters of DeepLabCut for pose estimation and succeeded in labeling a single-mouse or two-mouse model with high fidelity during free-moving behavior. We applied the trained network to analyze the behavior of the mice and found that PNE mice exhibited impulsivity and a lessened working memory, which are characteristics of ADHD. PNE mice also showed elevated anxiety and deficits in social interaction, reminiscent of autism spectrum disorder (ASD). We further examined PNE mice by evaluating adult neurogenesis in the hippocampus, which is a pathological hallmark of ASD, and demonstrated that newborn neurons were decreased, specifically in the ventral part of the hippocampus, which is reported to be related to emotional and social behaviors. These results support the hypothesis that PNE is a risk factor for comorbidity with ADHD and ASD in mice.

Keywords: ADHD; ASD; DeepLabCut; SimBA; deep learning; prenatal nicotine exposure.


Conflict of interest statement

The authors have no competing interests. We confirm that we have read the journal’s position on issues regarding ethical publication and affirm that this report is consistent with those guidelines.

Figures

Figure 1
Figure 1
Establishment of nicotine exposure mice and postnatal development. (A): schematic drawing showing the experimental design of the prenatal nicotine exposure (PNE). Water with nicotine and sucrose (PNE), or sucrose only (Con), was supplied to pregnant C57BL/6J mice, starting from embryonic day 14 until delivery, postnatal day 0 (P0). Mothers and pups were supplied with normal drinking water thereafter. (B): the developmental changes in the body weight of PNE (n = 8) and Con (n = 8) pups until the date of the behavioral experiments. A slight decrease in the body weight was observed in PNE mice, but this was not statistically significant. (C): the survival curve of the PNE (n = 24) and Con (n = 24) mice indicated no change in the mortality after prenatal exposure of nicotine.
Figure 2
Figure 2
Nicotine exposure during the late embryonic stage demonstrated impulsivity and impaired working memory in mice. (A): the top view of the cliff avoidance reaction (CAR) test is shown. A test mouse was placed on a platform (20 cm high), and we observed whether it jumped from the platform. (B): the trajectory of the mice during the CAR test is shown. The Con mice stayed on the platform for the entire period of the CAR test (top), whereas the PNE mice jumped off the platform and walked on the floor (bottom). (C): the time elapsed to the first jump demonstrated that PNE mice (n = 11) jumped off the platform sooner after the CAR test started (t(20) = 5.07, p < 0.001). Some Con mice (n = 11) never jumped off from the platform. (D): the number of jumps during the 15 min CAR test showed that PNE mice jump from the platform more frequently than Con mice (t(20) = 2.515, p < 0.05). (E): the picture represents the top view of the Y-maze test. (F): the total arm entries are shown and indicate that the activity level was not altered by prenatal exposure to nicotine (PNE: n = 10, Con: n = 10, t(18) = 0.039, p > 0.1). (G): the percentage of spontaneous alternation was decreased in the PNE mice compared to the control mice (t(18) = 2.52, p < 0.05). Each bar represents the mean ± SEM; ns = not statistically significant, and * p < 0.05 and *** p < 0.001 was determined by using Student’s t-test.
Figure 3
Figure 3
Labeling body parts of a single mouse using DeepLabCut and tracking the trajectory of the freely moving mouse. (A): DeepLabCut was used to label seven key points of the mouse during the open-field test, consisting of the nose (green), the left ear (purple), the right ear (blue), the left side of the trunk (grey), the right side of the trunk (orange), the body center (light green), and the base of the tail (red). These points were labeled by a human experimenter (training data) and the network was trained using the training data. (B): the graph shows the percentage of mislabeled frames in the video proceeded by different parameters to construct a network in DeepLabCut (F(6,28) = 16.09, p < 0.001). (C): the position of the mouse was estimated as the center of mass of the total parts of the mouse body labeled by DeepLabCut, and the trajectory of the mouse is shown. The trajectory of the control (black, n = 12) and PNE (red, n = 12) mice every 10 min is shown. (D): the travel distance of the control and PNE mice was not different in all the periods (0–10 min: t(22) = 1.44, p > 0.1; 10–20 min: t(22) = 0.03, p > 0.1; 20–30 min: t(22) = 1.01, p > 0.1). (E): the length of time during which the mice stayed in the center part of the open-field arena is shown. Control mice stayed in the center part longer during the 10-to-20 min period (0–10 min: t(22) = 0.85, p > 0.1; 10–20 min: t(22) = 2.61, p < 0.05; 20–30 min: t(22) = 1.34, p > 0.1), indicating that the control mice became accustomed sooner than PNE mice. ns = not statistically significant, * p < 0.05 and **** p < 0.0001 determined by using Student’s t-test.
Figure 4
Figure 4
Machine-learning-based classification of mouse behaviors using SimBA achieved a detection of behaviors similar to human experimenters. (A): the scheme of the machine-learning-based classification of mouse behavior by using SimBA is shown. After the mouse pose estimation using DeepLabCut, pose features were extracted. A human experimenter defined behaviors in the video through manual classification on SimBA to define the training data. The training data were used to classify the mouse behaviors with supervised machine learning. The trained network was used to detect the behaviors of the mice in the video. We analyzed grooming (shown in (D,E)) and rearing (shown in (F,G)) behaviors in this study. (B): DLC/SimBA analysis did not detect significant changes in travel distance in each period (0–10 min: t(22) = 0.016, p > 0.1; 10–20 min: t(22) = 0.71, p > 0.1; 20–30 min: t(22) = 0.81, p > 0.1). (C): the decrease in the time spent in the center in PNE mice (n = 12) was detected by DLC/SimBA, in comparison with Con mice (n = 12; 0–10 min: t(22) = 0.58, p > 0.1; 10–20 min: t(22) = 2.55, p < 0.05; 20–30 min: t(22) = 0.62, p > 0.1). (D): the total frequency of grooming in the open-field test is shown and the frequency of grooming was decreased in PNE mice (t(2) = 4.60, p < 0.05). (E): the time spent grooming showed a decrease by PNE (t(2) = 4.48, p < 0.05). (F): the total frequency of rearing behaviors decreased in the PNE mice (t(2) = 5.85, p < 0.05). (G): the duration of rearing behavior did not change (t(2) = 1.75, p > 0.1). ns = not statistically significant, * p < 0.05, by using Student’s t-test.
Figure 5
Figure 5
The pose estimation of two C57BL/6J mice in the open-field arena by using DeepLabCut allows us to track the trajectory of the mice. (A): the picture shows the top view of the social interaction test in the open-field arena with juvenile and older subject mice. (B): the graph shows the percentage of mislabeled frames in the video of the juvenile interaction test proceeded by different parameters to construct a network in DeepLabCut (F(6,28) = 1.998, p < 0.05). (C): the traces show the trajectory of the juvenile (green) and the control subject (black) mice in the open-field arena. (D): the traces show the trajectory of the juvenile (green) and the PNE subject (red) mice in the open-field arena. (E): the total travel distance of the juvenile mouse model is shown. The open bar represents the data when the juvenile mouse model was with the control subject mouse model (n = 12), and the red bar represents those with the PNE subject mouse model (open bar, n = 12, t(22) = 2.03, p = 0.06). (F): the duration of time the juvenile mice stayed in the center of the arena is shown (red bar, n = 12, t(22) = 0.52 p > 0.1). (G): the total distance of the subject mouse model is shown. The data of the control (open bar, n = 12) and PNE (red bar, n = 12) mouse models are shown (t(22) = 1.27, p > 0.1). (H): the duration of time the subject mouse model stayed in the center of the arena is shown (t(22) = 0.13, p > 0.1). Asterisk (* p < 0.05) was examined with ANOVA Turkey’s post hoc test. No statistical significance (ns, p > 0.05) was detected in the travel distance or the time spent in the center when using Student’s t test.
Figure 6
Figure 6
Machine-learning-based classification of social behaviors by SimBA revealed deficits caused by PNE in mice. (A): the interval between the juvenile and subject mice was defined as the distance between the centers of mass of the seven body parts of the juvenile (green circle) and subject (red circle) mice. (B): the accumulation curve of the intervals between the juvenile and Con/PNE subject mice. The distance between the juvenile and PNE subject mice was larger than in the case of the control subject mouse model (*** p < 0.001 by using K.S. test). (C): the number of following events is smaller in the PNE mouse model (n = 12) than in the control mouse model (n = 12). The same videos were analyzed by two human experimenters (Ex1 and Ex2) and by SimBA, a machine learning algorithm (ML) (t(2) = 30.47, ** p < 0.01). (D): the durations of time spent following by both the control and PNE mouse models are shown, and this was smaller in the PNE mouse model compared to the control mouse model (t(2) = 6.05, * p < 0.05). (E): the number of sniffing behaviors is shown, and fewer sniffing behaviors were observed in the case of the PNE mouse model (t(2) = 17.33, ** p < 0.01). (F): the duration of the sniffing behaviors was shortened in PNE mice (t(2) =15.70, ** p < 0.01).
Figure 7
Figure 7
Newborn neurons in the ventral hippocampus were reduced via prenatal exposure to nicotine in mice. (A): representative pictures show histological images of newborn neurons in the dorsal hippocampus of the control (n = 8) and PNE (n = 8) mice. Newborn neurons are defined as cells positive for bromodeoxyuridine (BrdU, red) and a neuronal marker, NeuN (green). (B): pictures show the distribution of newborn neurons in the ventral hippocampus. Fewer BrdU/NeuN double positive cells were found in the ventral hippocampus of the PNE mouse model. (C): the number of newborn neurons in the dorsal hippocampus was not changed in the PNE mouse model compared to the control mouse model (t(14) = 1.33, p > 0.1). (D): the number of newborn neurons in the ventral hippocampus was significantly reduced in the PNE mouse model than in the control mouse model (t(14) = 3.53, p < 0.01). (E): the total number of newborn neurons in the entire hippocampus is shown and this was decreased in the PNE mouse model compared to the control mouse model (t(14) = 2.64, p < 0.01). Scale bar represents 100 μm (Figure 6A,B) and 50 μm (an inset of Figure 6A). ns = not statistically significant, * p < 0.05 ** p < 0.01, with Student’s t-test.

References

    1. Office of the Surgeon General (US) Office on Smoking and Health (US) The Health Consequences of Smoking: A Report of the Surgeon General. Centers for Disease Control and Prevention (US); Atlanta, GA, USA: 2004. - PubMed
    1. Wickström R. Effects of nicotine during pregnancy: Human and experimental evidence. Curr. Neuropharmacol. 2007;5:213–222. doi: 10.2174/157015907781695955. - DOI - PMC - PubMed
    1. Kline J., Stein Z.A., Susser M., Warburton D. Smoking: A risk factor for spontaneous abortion. N. Engl. J. Med. 1977;297:793–796. doi: 10.1056/NEJM197710132971501. - DOI - PubMed
    1. Haglund B., Cnattingius S. Cigarette smoking as a risk factor for sudden infant death syndrome: A population-based study. Am. J. Public Health. 1990;80:29–32. doi: 10.2105/AJPH.80.1.29. - DOI - PMC - PubMed
    1. Kataoka M.C., Carvalheira A.P.P., Ferrari A.P., Malta M.B., de Barros Leite Carvalhaes M.A., de Lima Parada C.M.G. Smoking during pregnancy and harm reduction in birth weight: A cross-sectional study. BMC Pregnancy Childbirth. 2018;18:67. doi: 10.1186/s12884-018-1694-4. - DOI - PMC - PubMed

Publication types