. 2024 Feb 4;13(3):283.
doi: 10.3390/cells13030283.

Human β-Defensin 3 Inhibition of P. gingivalis LPS-Induced IL-1β Production by BV-2 Microglia through Suppression of Cathepsins B and L

Affiliations

Human β-Defensin 3 Inhibition of P. gingivalis LPS-Induced IL-1β Production by BV-2 Microglia through Suppression of Cathepsins B and L

Erika Inoue et al. Cells. .

Abstract

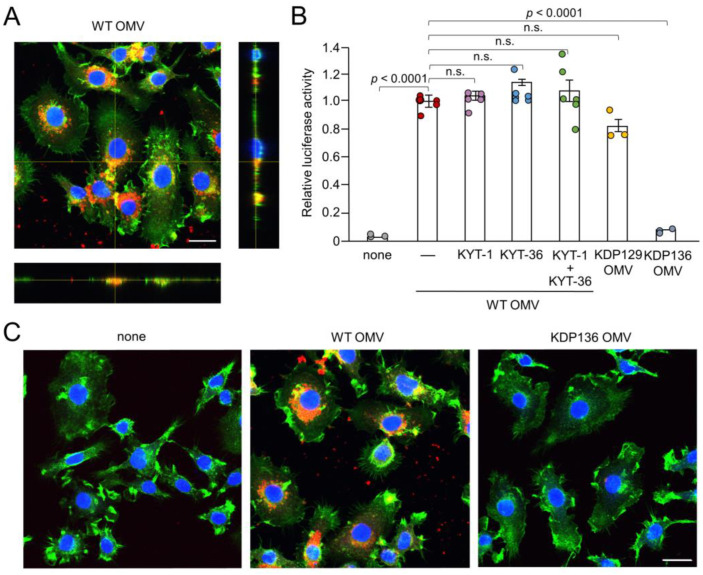
Cathepsin B (CatB) is thought to be essential for the induction of Porphyromonas gingivalis lipopolysaccharide (Pg LPS)-induced Alzheimer's disease-like pathologies in mice, including interleukin-1β (IL-1β) production and cognitive decline. However, little is known about the role of CatB in Pg virulence factor-induced IL-1β production by microglia. We first subjected IL-1β-luciferase reporter BV-2 microglia to inhibitors of Toll-like receptors (TLRs), IκB kinase, and the NLRP3 inflammasome following stimulation with Pg LPS and outer membrane vesicles (OMVs). To clarify the involvement of CatB, we used several known CatB inhibitors, including CA-074Me, ZRLR, and human β-defensin 3 (hBD3). IL-1β production in BV-2 microglia induced by Pg LPS and OMVs was significantly inhibited by the TLR2 inhibitor C29 and the IκB kinase inhibitor wedelolactonne, but not by the NLRPs inhibitor MCC950. Both hBD3 and CA-074Me significantly inhibited Pg LPS-induced IL-1β production in BV-2 microglia. Although CA-074Me also suppressed OMV-induced IL-1β production, hBD3 did not inhibit it. Furthermore, both hBD3 and CA-074Me significantly blocked Pg LPS-induced nuclear NF-κB p65 translocation and IκBα degradation. In contrast, hBD3 and CA-074Me did not block OMV-induced nuclear NF-κB p65 translocation or IκBα degradation. Furthermore, neither ZRLR, a specific CatB inhibitor, nor shRNA-mediated knockdown of CatB expression had any effect on Pg virulence factor-induced IL-1β production. Interestingly, phagocytosis of OMVs by BV-2 microglia induced IL-1β production. Finally, the structural models generated by AlphaFold indicated that hBD3 can bind to the substrate-binding pocket of CatB, and possibly CatL as well. These results suggest that Pg LPS induces CatB/CatL-dependent synthesis and processing of pro-IL-1β without activation of the NLRP3 inflammasome. In contrast, OMVs promote the synthesis and processing of pro-IL-1β through CatB/CatL-independent phagocytic mechanisms. Thus, hBD3 can improve the IL-1β-associated vicious inflammatory cycle induced by microglia through inhibition of CatB/CatL.

Keywords: BV-2 microglia; CA-074Me; Porphyromonas gingivalis; cathepsin B; human β-defensin 3; interleukin-1β; lipopolysaccharide; nuclear factor-κB; outer membrane vesicles.


Conflict of interest statement

The authors have no financial conflicts of interest to declare.

Figures

Figure 1
Figure 1
Schematic illustration of the IL-1β probe construct and effects of inhibitors for TLR4, TLR2, IKK, and NLRP3 inflammasome on the luciferase activity of the IL-1β probe in BV-2 microglia following stimulation with Pg LPS and OMVs for 1 h. (A) Nluc luciferase gene was fused with the sequence of Il1b cleaving site (Il1b 17-216). The C-terminus of the Il1b cleaving site was fused with two protein destabilization sequences (hCL1 and hPEST). The fusion gene was ligated downstream of the mouse IL-1β promoter. (B,C) The mean relative luciferase activity of the IL-1β probe induced by PgLPS (B) and OMVs (C) in the absence or presence of the TLR4 inhibitor TAK-242 or the TLR2 inhibitor C29. (D) The mean relative luciferase activity of the IL-1β probe induced by Pg LPS and OMVs in the absence or presence of IKK inhibitor wedelolactone (WDL). (E). The mean relative luciferase activity of the IL-1β probe induced by Pg LPS and OMVs in the absence or presence of the NLRP3 inflammasome inhibitor MCC950 (MCC). The data relative to the values in Pg LPS or OMV-treated cells are presented as the mean ± SE of three independent experiments.
Figure 2
Figure 2
Phagocytosis of OMVs by BV-2 microglia and possible involvement of gingipains in OMV-induced IL-1β production. (A) CLSM images of BV-2 microglia after treatment with Cy5-labelled OMVs for 1 h prepared from wild-type strain (WT OMV). F-actin and nuclei were visualized with Acti-stain 488 phalloidin (green) and Hoechst 33342 (blue), respectively. Bottom and right rectangular panels represent z-stack images. Scale bar = 20 μm. (B) The mean relative luciferase activity of the IL-1β probe induced by OMVs for 1 h after pharmacological and genetic inhibition of gingipains. KYT-1: Rgp inhibitor; KYT-136: Kgp inhibitor; KDP129: OMVs prepared from Kgp mutant strain; KDP136: OMVs prepared from Rgp and Kgp mutant strains. The data relative to the values in WT OMV-treated cells are presented as the mean ± SE of three-six independent experiments. (C) CLSM images of BV-2 microglia after treatment with Cy5-labelled OMVs (red) prepared from wild-type (WT OMV) and gingipain-null mutant KDP136 strains for 1 h. F-actin and nuclei were visualized with Acti-stain 488 phalloidin (green) and Hoechst 33342 (blue), respectively. Scale bar = 20 μm.
Figure 3
Figure 3
Effects of pharmacological and genetic inhibition of CatB on IL-1β production by BV-2 microglia following stimulation with Pg LPS and OMVs. (A,B) The mean relative luciferase activity of the IL-1β probe induced in BV-2 microglia following treatment with Pg LPS (A) and OMVs (B) after treatment with hBD3 (1 μM), CA-074Me (10 μM) or ZRLR (10 μM). The data are presented as the mean ± SE of 3-6 independent experiments. (C) The mean values of CatB intensity, which were detected by the immunoblot shown, were measured in Nluc reporter BV-2 microglia (Nluc BV-2) and Nluc reporter CatB-knockdown BV-2 microglia (CatB-KD Nluc BV-2) and normalized against the signal of GAPDH. The data are presented as the mean ± SE of three independent experiments, and the p-value was calculated using Student’s t-test. (D) The mean luciferase activity (RLU) of the IL-1β probe induced by Pg LPS or OMV in CatB-KD Nuc BV-2 microglia. The data are presented as the mean ± SE of 3 independent experiments.
Figure 4
Figure 4
Enzymatic activities of CatB and CatL visualized using the cell-permeable, fluorescently labeled substrates, z-Arg-Arg-cresyl violet and z-Phe-Arg-cresyl violet, respectively, in the absence (none) and presence of CA-074Me (10 μM) or ZRLR (10 μM). Scale bar = 40 μm.
Figure 5
Figure 5
Effects of hBD3 and CA-074Me on nuclear NF-κB p65 translocation following stimulation with Pg LPS and OMVs. (A) Immunofluorescent CLSM images of BV-2 microglia after treatment with Pg LPS or OMVs in the absence or presence of hBD3 (1 μM) or CA-074Me (30 μM). Nuclear NF-κB p65 translocation was visualized by immunohistochemical staining (red). Nuclei were stained blue by Hoechst 33342 (blue). Scale bar = 40 μm. (B) The typical cells were analyzed by line plot profile to show the cytosol and nuclear NF-κB p65 translocation. The fluorescence intensity of NF-κB p65 and Hoechst 33342 in the cells traversed by white lines in (A) was indicated by red and blue lines, respectively.
Figure 6
Figure 6
Effects of hBD3 and CA-074Me on the degradation of IκBα after stimulation with Pg LPS and OMVs. (A) The protein level of IκBα in BV-2 microglia after stimulation with Pg LPS (10 μg/mL) for 30 min in the presence or absence of hBD3 (1 μM) or CA-074Me (30 μM). (B) The mean values of the IκBα intensity shown in (A) were measured and normalized against the signal of β-actin. The data relative to the values in untreated cells are presented as the mean ± SE of three–five independent experiments. (C) The protein level of IκBα in BV-2 microglia after stimulation with OMVs (150 μg/mL) for 10 min in the presence or absence of hBD3 (1 μM) or CA-074Me (30 μM). (D) The mean values of the IκBα intensity shown in (C) were measured and normalized against the signal of β-actin. The data relative to the values in untreated cells are presented as the mean ± SE of three independent experiments.
Figure 7
Figure 7
Prediction of hBD3 binding to CatB. (A) Structural model of hBD3-bound CatB generated using AlphaFold. The hBD3 model, presented as a ribbon, binds to the molecular surface of CatB. Amino acids are colored based on their pLDDT score. (B) PAE plots of the hBD3 and CatB complex model. (C) Binding of hBD3 to the active cleft formed on the molecular surface of CatB. The surface representation of CatB is shown in gray, except for the S1, S3, and S1’ sites, which are shown in light magenta; the S2 and S2’ sites, which are shown in magenta; and Cys29, which is shown in yellow. The hBD3 model, presented as a ribbon, is colored cyan. The figures were drawn using the PyMOL software program [33].
Figure 8
Figure 8
Prediction of hBD3 binding to CatL. (A) Structural model of hBD3-bound CatL generated using AlphaFold. The hBD3 model, presented as a ribbon, binds to the molecular surface of CatL. Amino acids are colored based on their pLDDT score. (B) Binding of hBD3 to the active cleft formed on the molecular surface of CatL. The surface representation of CatL is shown in gray, except for S1 and S1’sites, which are shown in light magenta; the S2 and S2’ sites, which are shown in magenta; and Cys25, which is shown in yellow. The hBD3 model, presented as a ribbon, is colored cyan. (C) PAE plots of the hBD3 and CatL complex model. The figures were drawn using the PyMOL software program [33].

References

    1. McGeer P.L., McGeer E.G. The amyloid cascade-inflammatory hypothesis of Alzheimer’s disease: Implications for therapy. Acta Neuropathol. 2013;126:479–497. doi: 10.1007/s00401-013-1177-7. - DOI - PubMed
    1. McGeer P.L., Rogers J., McGeer E.G. Inflammation, anti-inflammatory agents, and Alzheimer’s disease: The last 22 years. J. Alzheimer’s Dis. 2016;54:853–857. doi: 10.3233/JAD-160488. - DOI - PubMed
    1. Sarlus H., Heneka M.T. Microglia in Alzheimer’s disease. J. Clin. Investig. 2017;127:3240–3249. doi: 10.1172/JCI90606. - DOI - PMC - PubMed
    1. Kaneko N., Kurata M., Yamamoto T., Morikawa S., Masumoto J. The role of interleukin-1 in general pathology. Inflamm. Regen. 2019;39:12. doi: 10.1186/s41232-019-0101-5. - DOI - PMC - PubMed
    1. Lopez-Castejon G., Brough D. Understanding the mechanism of IL-1β secretion. Cytokine Growth Factor Rev. 2011;22:189–195. doi: 10.1016/j.cytogfr.2011.10.001. - DOI - PMC - PubMed

Publication types

MeSH terms

LinkOut - more resources