. 2024 Feb 9;81(1):80.
doi: 10.1007/s00018-024-05115-4.

The human OPA1delTTAG mutation induces adult onset and progressive auditory neuropathy in mice

Affiliations

The human OPA1delTTAG mutation induces adult onset and progressive auditory neuropathy in mice

Corentin Affortit et al. Cell Mol Life Sci. .

Abstract

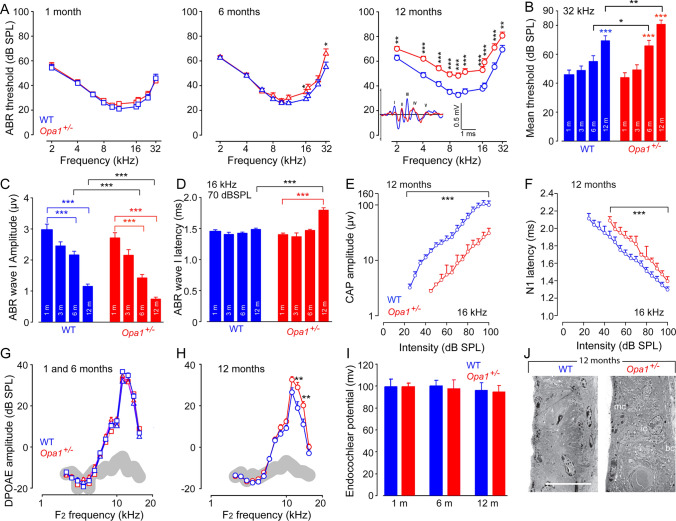
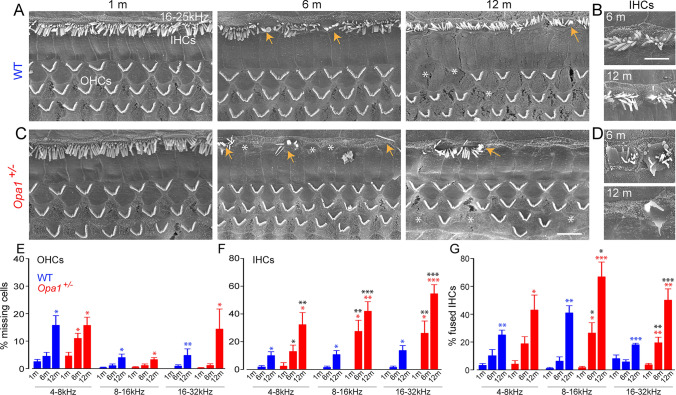
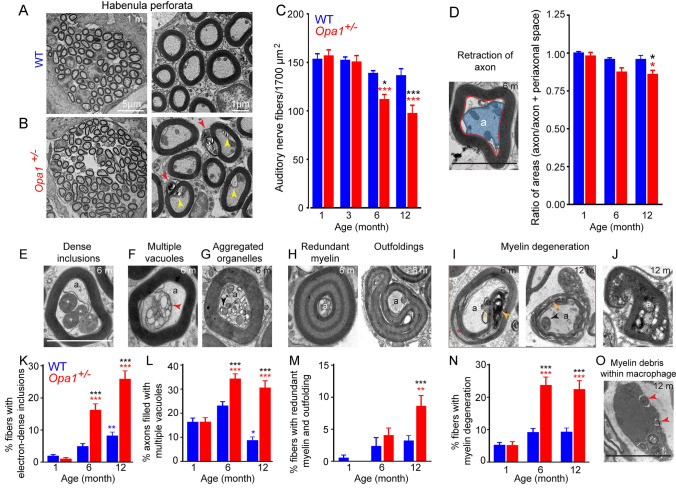
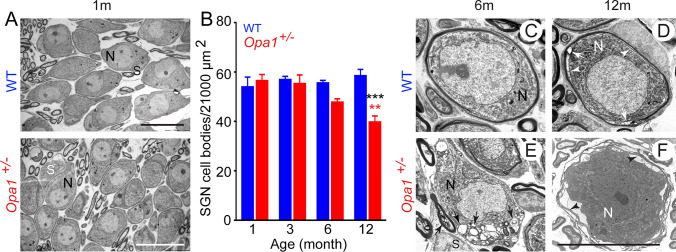
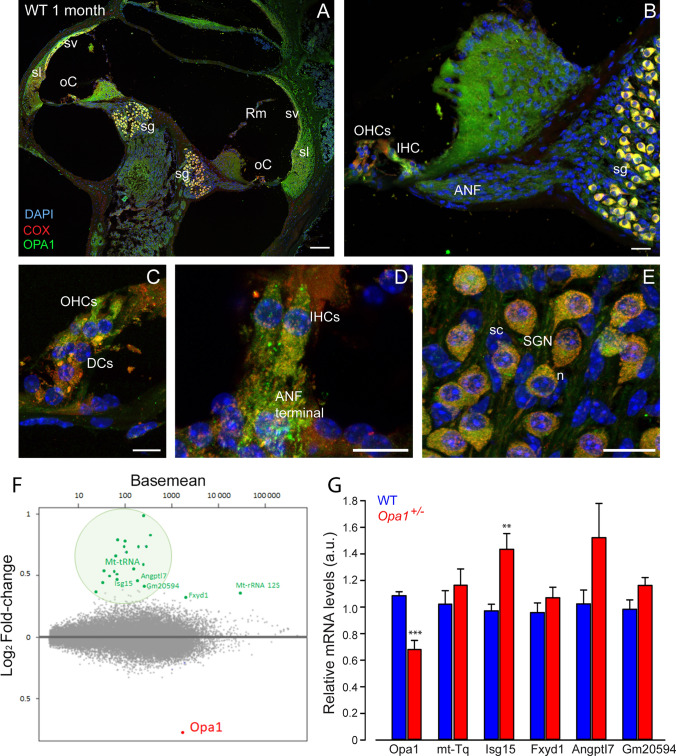
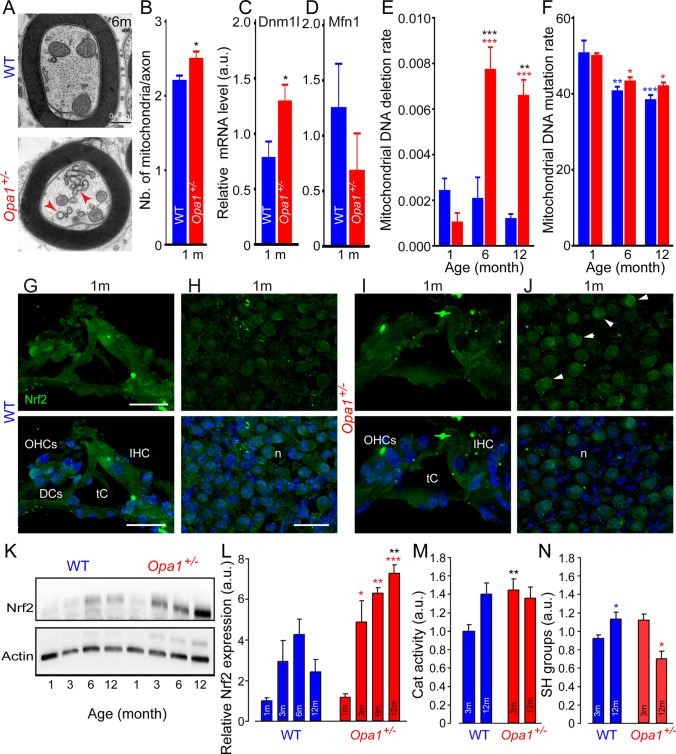
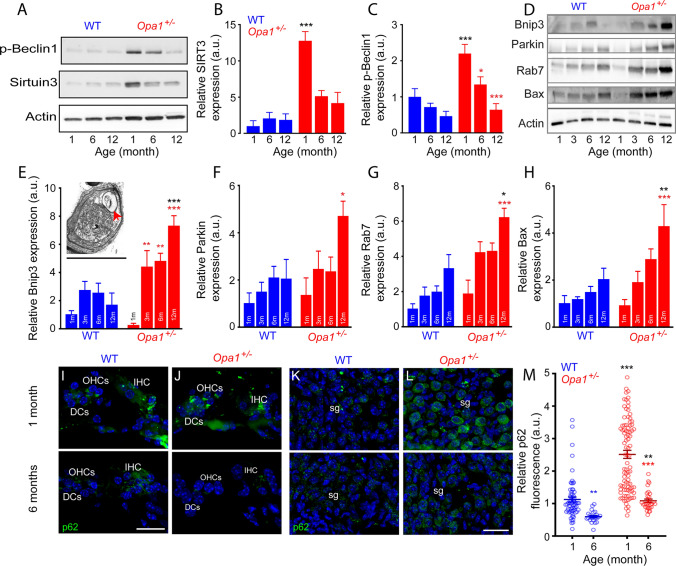
Dominant optic atrophy (DOA) is one of the most prevalent forms of hereditary optic neuropathies and is mainly caused by heterozygous variants in OPA1, encoding a mitochondrial dynamin-related large GTPase. The clinical spectrum of DOA has been extended to a wide variety of syndromic presentations, called DOAplus, including deafness as the main secondary symptom associated to vision impairment. To date, the pathophysiological mechanisms underlying the deafness in DOA remain unknown. To gain insights into the process leading to hearing impairment, we have analyzed the Opa1delTTAG mouse model that recapitulates the DOAplus syndrome through complementary approaches combining morpho-physiology, biochemistry, and cellular and molecular biology. We found that Opa1delTTAG mutation leads an adult-onset progressive auditory neuropathy in mice, as attested by the auditory brainstem response threshold shift over time. However, the mutant mice harbored larger otoacoustic emissions in comparison to wild-type littermates, whereas the endocochlear potential, which is a proxy for the functional state of the stria vascularis, was comparable between both genotypes. Ultrastructural examination of the mutant mice revealed a selective loss of sensory inner hair cells, together with a progressive degeneration of the axons and myelin sheaths of the afferent terminals of the spiral ganglion neurons, supporting an auditory neuropathy spectrum disorder (ANSD). Molecular assessment of cochlea demonstrated a reduction of Opa1 mRNA level by greater than 40%, supporting haploinsufficiency as the disease mechanism. In addition, we evidenced an early increase in Sirtuin 3 level and in Beclin1 activity, and subsequently an age-related mtDNA depletion, increased oxidative stress, mitophagy as well as an impaired autophagic flux. Together, these results support a novel role for OPA1 in the maintenance of inner hair cells and auditory neural structures, addressing new challenges for the exploration and treatment of OPA1-linked ANSD in patients.

Keywords: Deafness; Hereditary optic neuropathy; Hidden hearing loss; Inner ear; Inner hair cell; Mitochondrial homeostasis; Outer hair cell; Retina.


Conflict of interest statement

The authors declare that they have no competing interests.

Figures

Fig. 1
Fig. 1
Opa1delTTAG mutation leads to exacerbated age-related hearing loss. A Auditory brainstem response (ABR) thresholds recorded in WT and Opa1± mice aged 1, 6 and 12 months. (Insert in A) mean ABR waveforms evoked by 16-kHz tone bursts at 70-dB sound pressure level (SPL). B Mean ABR thresholds at 32 kHz recorded in in WT and Opa1± mice aged 1, 3, 6 and 12 months. C and D Mean wave-I amplitude (C) and latency (D) evoked by 16 kHz tone bursts at 70 dB sound pressure level (SPL) in WT and Opa1± mice aged 1, 3, 6 and 12 months. E and F Shown are the input–output functions of the compound action potential (CAP) and N1 latency evoked by 16 kHz tone bursts in WT and Opa1± mice aged 12 months. G and H Distortion product otoacoustic emission (DPOAE) amplitudes recorded in WT and Opa1± mice aged 1 and 6 (G), and 12 months (H). I Measurements of the endocochlear potential magnitude in WT and Opa1± mice aged 1, 6 and 12 months. All data are expressed as mean ± SEM (n = 25–40 mice per genotype and time point for ABR and DPOAE recording, n = 10 and 15 for EP and CAP recording, respectively), one-way ANOVA test was followed by Dunn’s test: *P ≤ 0.05, **P ≤ 0.01, ***P ≤ 0.001. Black asterisks, Opa1± vs. WT mice of the same age; red asterisks, older Opa1± vs. 1-month-old Opa1±; blue asterisks, older WT vs. 1-month-old WT. J Representative micrographs of transmission electron microscopy showing that the stria vascularis has a normal appearance in both WT and Opa1± mice at 12 months (MC: marginal cells, IMC: intermediate cells, BC: basal cells). Scale bar: 25 µm
Fig. 2
Fig. 2
Selective loss of IHCs in Opa1± mice. A, C Representative scanning electron microscopy from the cochlear regions coding 16-25 kHz from WT (A) and Opa1± (C) mice aged 1, 6 and 12 months. B, D Higher magnification images of representative hair bundles of the IHCs from WT (B) and Opa1± mice (D) at 6 and 12 months. Yellow arrows indicate fused hair bundles of the IHCs. White asterisks indicate missing IHCs and OHCs. Scale bars: A, C = 16 μm, B, D = 8 µm. E–G Histogram showing the percentage of missing OHCs (E) and IHCs (F), and IHCs with fused stereocilia bundles (G) in different coding regions (4–8, 8–16 and 16–32 kHz) from the cochleae of WT and Opa1± mice aged 1, 6, and 12 months. Data are expressed as mean ± SEM (n = 6 to 8 cochleae per age and genotype). One-way ANOVA test was followed by Dunn’s test. *P ≤ 0.05, **P ≤ 0.01. Black asterisks: Opa1± vs. WT mice of the same age, red asterisks: older Opa1± vs. 1-month-old Opa1±, blue asterisks: older WT vs. 1-month-old WT
Fig. 3
Fig. 3
Alterations of the auditory nerve fibers in Opa1± mice. A and B Representative micrographs of transmission electron microscopies showing the auditory nerve fibers (ANFs) in the habenula perforata from the upper basal turn of cochleae of WT (A) and Opa1± (B) mice. Scale bars = 5 and 1 µm, respectively. C Quantitative assessment of ANF density in WT and Opa1± mice aged 1, 3, 6, and 12 months (n = 3 sections per cochlea, 5 to 6 cochleae per age and genotype). Left in D Representative transmission electron micrograph of ANF from 6-month-old Opa1± mice. The blue area indicates a retracted axon; the red line delimits the region occupied by the axon + periaxonal space. Scale bar = 1 µm. Right in D Ratios of areas (axonal area/ axonal area + periaxonal space) from 200 and 400 individual fibers from 5 WT and 6 Opa1± cochleae, respectively. E–J Representative transmission electron micrographs of ANFs from 6- and 12-month-old Opa1± mice. Showing axons filled with electron dense inclusions (E), typical autophagic vacuoles (F), degraded organelles (G), ANFs with redundant myelin loops and outfoldings (H), split lamellae myelin and dense myelin debris (I), and degenerated ANF (J) (n = 3 sections per cochlea, 5 to 6 cochleae per age and genotype). Scale bar = 1 µm. KN Quantitative analysis of percentage of ANFs with electron dense bodies (K), axons filled with multiple vacuoles (L), ANFs with hypermyelination (M) and degenerating sheaths (N) (n = 200 and 400 individual fibers from 5 WT and 6 Opa1± cochleae, respectively). All data are expressed as mean ± SEM, one-way ANOVA test was followed by Dunn’s test: ***P ≤ 0.001. Black asterisks: Opa1± vs. WT mice of the same age, red asterisks: older Opa1± vs. 1-month-old Opa1±, blue asterisks: older WT vs. 1-month-old WT. O Representative transmission electron micrograph shows a macrophage containing myelin debris. Scale bar = 2.5 µm
Fig. 4
Fig. 4
Exacerbated age-related degeneration of spiral ganglion neurons in Opa1± mice. A Representative transmission electron micrographs of spiral ganglion neurons (SGNs) in WT and Opa1± mice aged 1 month. B Quantitative analysis of SGN density in WT and Opa1± mice aged 1, 3, 6, and 12 months. All data are expressed as mean ± SEM (n = 5 sections per cochlea, 4–5 cochleae per age and genotype). One-way ANOVA test was followed by Dunn’s test: *P ≤ 0.05, **P ≤ 0.01, ***P ≤ 0.001. Black asterisks: Opa1± vs. WT mice of the same age, red asterisks: older Opa1± vs. 1-month-old Opa1±, blue asterisks: older WT vs. 1-month-old WT. C–F Representative transmission electron micrographs of SGN cell bodies (N) and Schwann cells (S) from WT (C, D) and Opa1± aged 6 (C, E) and 12 (D, F) months. Black and white arrows mark vacuoles (D, E) and degenerated myelin sheaths (F). Scale bars, A = 15 µm, C–F = 2.5 µm
Fig. 5
Fig. 5
OPA1 expression and mutation induced change in gene expression in the cochlea. A, B Confocal images of transverse cryostat sections of a cochlea (A) and lower middle turn (B) from WT mice at 1 month. Sections were immuno-labeled for COX (red), and OPA1 (green) and counterstained with DAPI to label nuclei. C–E Higher magnification of the OHCs (C), IHCs (D) and spiral ganglion neurons (SGN, E). SGN cell bodies (n) are surrounded by single Schwann cell (sc). Scale bars = 15 µm. oC: organ of Corti, sv: stria vascularis, Rm: Reissner’s membrane, sl: spiral ligament, ANF: auditory nerve fiber, DCs: Deiters’ cells. All images are representative of n = 3–4 cochleae (one cochlea per mouse). F Heatmap representing differential gene expression among 15,000 expressed genes (gray dots). Analysis identified a single down-regulated mRNA (Opa1) and 23 up-regulated transcripts. Among these over-represented transcript, 18 correspond to mitochondrial tRNA, 1 to the 12S mitochondrial ribosomal RNA (mt-Rnr1) and 4 to protein-coding mRNA (n = 4 Opa1± mice and 4 control littermates at post-natal p21). G RT-qPCR validation of RNA seq data was performed for 5 Opa1± and 5 control samples. Although not reaching statistical significance for 4 of 6 differentially expressed genes, the general trend is the same than the one evidenced by RNA seq
Fig. 6
Fig. 6
Mitochondrial damage and oxidative stress in Opa1± mice. A Representative transmission electron micrographs of ANFs from 6-month-old WT and Opa1± mice. Scale bar: 0.4 µm. B The mean number of the mitochondria per axon from WT and Opa1± mice at 1 month. C, D Quantitative PCR for Dnm1L and Mfn1 transcripts relative to β-actin in whole cochlear extracts from WT and Opa1± mice aged 1 month. All data are expressed as mean ± SEM (n = 8 cochleae per sample). All experiments were performed in technical triplicate. E, F Mitochondrial DNA deletion (C) and mutation (C) rate detected in the cochleae of WT and Opa1± mice aged 1, 6, and 12 months. Data are expressed as mean ± SEM (n = 5 mice per age and genotype). G–J Confocal images of transverse cryostat sections of the organ of Corti (G, I) and spiral ganglion neurons (H, J) from WT (G, H) and Opa1± mice (I, J) at 1 months. Sections were immunolabeled for Nrf2 (green) and counterstained with DAPI to label nuclei. DCs: Deiters’ cells, tC: tunnel of Corti, n: spiral ganglion neuron. IHCs: inner hair cells, OHCs: outer hair cells. All images are representative of n = 4–5 cochleae (one cochlea per mouse) per age and genotype. Scale bars, 15 µm. K Representative Western blot analysis for Nrf2 in whole cochlear extracts from WT and Opa1± mice. β-Actin is a loading control. L Quantification of Nrf2 protein levels in WT and Opa1± mouse cochleae. M, N Catalase activity (M) and SH groups (N) in cochlear homogenates from WT and Opa1± mice. Data are expressed as mean ± SEM (Each experiment was performed with a pool of 8 cochleae per sample per age and per genotype, and in biological and technical triplicate). One-way ANOVA test was followed by Dunn’s test: *P ≤ 0.05, **P ≤ 0.01, ***P ≤ 0.001. Black asterisks: Opa1± vs. WT mice of the same age, red asterisks: older Opa1± vs. 1-month-old Opa1±, blue asterisks: older WT vs. 1-month-old WT
Fig. 7
Fig. 7
Mitophagy and autophagy. A Representative Western blot analysis for phospho-Beclin 1 (p-Beclin1) and SIRT3 in whole cochlear extracts from WT and Opa1± mice aged 1, 6, and 12 months. β-Actin is a loading control. B, C Quantification of SIRT3 and p-Beclin 1 protein levels in WT and Opa1± mouse cochleae. D Representative Western blot analysis for Bnip3, Parkin, Rab7, and Bax in whole cochlear extracts from WT and Opa1± mice aged 1, 3, 6, and 12 months. β-Actin is a loading control. Insert in E Representative transmission electron micrograph of SGN from 6-month-old Opa1± mice showing a typical autophagosome (red arrow). E–H Quantification of Bnip3 (E), Parkin (F), Rab7 (G) and Bax (H) protein levels in WT and Opa1± mouse cochleae. Data are expressed as mean ± SEM (Each experiment was performed with a pool of 8 cochleae per sample per age and per genotype, and in biological and technical triplicate). One-way ANOVA test was followed by Dunn’s test: *P ≤ 0.05, **P ≤ 0.01, ***P ≤ 0.001. Black asterisks: Opa1± vs. WT mice of the same age, red asterisks: older Opa1± vs. 1-month-old Opa1±, blue asterisks: older WT vs. 1-month-old WT. I–L Confocal images of transverse cryostat sections of the organ of Corti (I, J) and spiral ganglion neurons (K, L) from WT (I, K) and Opa1± (J, L) mice at 1 and 6 months. Sections were immuno-labeled for p62 (green) and counterstained with DAPI to label nuclei. Scale bars, 15 µm. M Semi-quantitative analysis of the p62 immunoreactivity in the SGNs of WT and Opa1± mice aged 1 and 6 months. All data are expressed as mean ± SEM (n = 70 to 90 SGNs from 3 independent cochleae per age and genotype). One-way ANOVA test was followed by Dunn’s test (**P ≤ 0.01, ***P ≤ 0.001)

References

    1. Johnston PB, Gaster RN, Smith VC, Tripathi RC. A clinicopathologic study of autosomal dominant optic atrophy. Am J Ophthalmol. 1979;88:868–875. doi: 10.1016/0002-9394(79)90565-8. - DOI - PubMed
    1. Alexander C, Votruba M, Pesch UE, Thiselton DL, Mayer S, Moore A, Rodriguez M, Kellner U, Leo-Kottler B, Auburger G, Bhattacharya SS, Wissinger B. OPA1, encoding a dynamin-related GTPase, is mutated in autosomal dominant optic atrophy linked to chromosome 3q28. Nat Genet. 2000;26:211–215. doi: 10.1038/79944. - DOI - PubMed
    1. Delettre C, Lenaers G, Griffoin JM, Gigarel N, Lorenzo C, Belenguer P, Pelloquin L, Grosgeorge J, Turc-Carel C, Perret E, Astarie-Dequeker C, Lasquellec L, Arnaud B, Ducommun B, Kaplan J, Hamel CP. Nuclear gene OPA1, encoding a mitochondrial dynamin-related protein, is mutated in dominant optic atrophy. Nat Genet. 2000;26:207–210. doi: 10.1038/79936. - DOI - PubMed
    1. Lenaers G, Neutzner A, Le Dantec Y, Juschke C, Xiao T, Decembrini S, Swirski S, Kieninger S, Agca C, Kim US, Reynier P, Yu-Wai-Man P, Neidhardt J, Wissinger B. Dominant optic atrophy: culprit mitochondria in the optic nerve. Prog Retin Eye Res. 2020 doi: 10.1016/j.preteyeres.2020.100935. - DOI - PubMed
    1. Amati-Bonneau P, Guichet A, Olichon A, Chevrollier A, Viala F, Miot S, Ayuso C, Odent S, Arrouet C, Verny C, Calmels MN, Simard G, Belenguer P, Wang J, Puel JL, Hamel C, Malthiery Y, Bonneau D, Lenaers G, Reynier P. OPA1 R445H mutation in optic atrophy associated with sensorineural deafness. Ann Neurol. 2005;58:958–963. doi: 10.1002/ana.20681. - DOI - PubMed

Supplementary concepts