. 2024 Feb 8;16(4):3257-3279.
doi: 10.18632/aging.205533. Epub 2024 Feb 8.

BubR1 controls starvation-induced lipolysis via IMD signaling pathway in Drosophila

Affiliations

BubR1 controls starvation-induced lipolysis via IMD signaling pathway in Drosophila

Mengyou Liu et al. Aging (Albany NY). .

Abstract

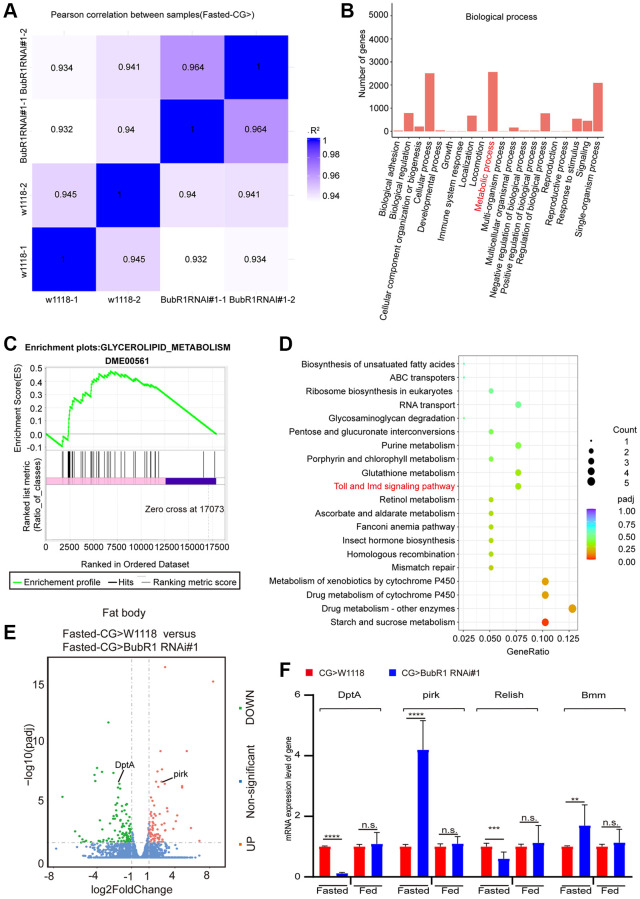
Lipolysis, the key process releasing fat acids to generate energy in adipose tissues, correlates with starvation resistance. Nevertheless, its detail mechanisms remain elusive. BubR1, an essential mitotic regulator, ensures proper chromosome alignment and segregation during mitosis, but its physiological functions are largely unknown. Here, we use Drosophila adult fat body, the major lipid storage organ, to study the functions of BubR1 in lipolysis. We show that both whole body- and fat body-specific BubR1 depletions increase lipid degradation and shorten the lifespan under fasting but not feeding. Relish, the conserved regulator of IMD signaling pathway, acts as the downstream target of BubR1 to control the expression level of Bmm and modulate the lipolysis upon fasting. Thus, our study reveals new functions of BubR1 in starvation-induced lipolysis and provides new insights into the molecular mechanisms of lipolysis mediated by IMD signaling pathway.

Keywords: Bmm; BubR1; Relish; immunity and metabolism; lipolysis; metabolic adaptation.


Conflict of interest statement

CONFLICTS OF INTEREST: The authors declare that the project was conducted in the absence of any commercial or financial relationships that could be construed as a potential conflict of interest.

Figures

Figure 1
Figure 1
BubR1 inhibits lipid metabolism degradation under starvation. (A) Representative images of Oil red O (ORO) stain of dissected fat bodies from W1118, BubR1MI01546, BubR1k03113 before and after starvation (72 h). (B) Bodipy stain of dissected fat body of W1118, BubR1MI01546/BubR1k03113 before and after starvation (72 h). Bodipy (neutral lipids; green) and Hoechst (Hoechst; blue) detected through fluorescent histochemistry. (C) The dot graph of the mean area of lipid droplets among the more than 30 ROI (region of interest) from W1118, BubR1MI01546/BubR1k03113 before and after starvation (72 h). Each dot corresponds to one ROI. (D) Quantification of total triglyceride (TAG) levels of whole flies in control and BubR1MI01546/BubR1k03113 before and after starvation (72 h). n = 9 samples. (E) The total triglyceride (TAG) levels of female flies (W1118, BubR1MI01546/BubR1k03113; r4-Gal4> W1118 and BubR1MI01546/BubR1k03113; r4-Gal4> UAS-BubR1) before and after starvation (72 h), n = 9 samples. (F) Starvation resistance of female flies in W1118, BubR1MI01546/BubR1k03113. n = 4 cohorts (total 80 flies). Data are presented as percents and SE. Scale bars represent 1000 μm (A), 10 μm (B). Without notification, Data are presented as mean and SD. Student’s t-tests were performed. *p < 0.05, **p < 0.01, ***p < 0.001, ****p < 0.0001, and Abbreviation: n.s.: non-significant represents p > 0.05.
Figure 2
Figure 2
BubR1 functions autonomously in Drosophila fat body to control lipid metabolism upon fasting. (A) The mRNA expression level of BubR1 in the fat body of wildtype before and after starvation (72 h). The ratio of each band indicates the relative amount of BubR1 normalized by rp49 expression. Results are representative of three biological repetitions. (B) The total triglyceride (TAG) levels of flies before and after starvation (72 h) with specially expressing W1118, BubR1 RNAi#1 and BubR1 RNAi#2 in the fat body driven by CG-GAL4. n = 9 samples. (C) Representative images of Oil red O (ORO) stain of dissected fat bodies from female flies before and after starvation (72 h) with specially expressing W1118, BubR1 RNAi#1 and BubR1 RNAi#2 in the fat body driven by CG-GAL4. (D) Bodipy stain of dissected carcass/fat body of flies before and after starvation (72 h) with specially expressing W1118, BubR1 RNAi#1 and BubR1 RNAi#2 in the fat body driven by CG-GAL4. Bodipy (neutral lipids; green) and Hoechst (Hoechst; blue) detected by fluorescent histochemistry. (E) Quantification of the mean area of lipid droplets among the more than 30 ROI (region of interest) from flies before and after starvation (72 h) with specially expressing W1118, BubR1 RNAi#1 and BubR1 RNAi#2 in the fat body driven by CG-GAL4. Each dot corresponds to one ROI. (F) Starvation resistance of female flies with specially expressing W1118, BubR1 RNAi#1 and BubR1 RNAi#2 in the fat body driven by CG-GAL4. n = 4 cohorts (total 80 flies). Data are presented as percents and SE. Scale bars represent 1000 μm (C), 10 μm (D). Without noted, Data are presented as mean and SD. Student’s t-tests are performed. *p < 0.05, **p < 0.01, ***p < 0.001, ****p < 0.0001, and Abbreviation: n.s.: non-significant represents p > 0.05.
Figure 3
Figure 3
BubR1 regulates lipid degradation via lipolysis mediated by IMD signaling pathway during acute starvation. (A) The Pearson correlation analysis between samples. (B) GO classification analysis of enriched genes in biological process in a pair-wise comparison of control to fat body-deficient BubR1 flies under starvation. (C) GSEA plots of ranked gene expression comparing fat body-deficient BubR1 with wild type and their positive (pink) and negative (purple) correlations for the indicated gene sets. Enrichment scores are represented as green lines, and the horizontal black bars indicate the position of the associated genes for each enrichment set. ES = 0.48, |NES| = 1.13, p < 0.05. (D) KEGG pathway enrichment analysis. KEGG pathway enrichment of up- or downregulated genes comparing fat body-deficient BubR1 and wild type under fast starvation. Both adjusted p-value and gene ratio denote the significance of the pathway. (E) Volcano plots of differentially expressed genes in a pair-wise comparison of control to fat body-deficient BubR1 flies in condition of fast starvation. (F) Relative mRNA levels of DptA, pirk, Relish and Bmm in flies with expressing W1118, BubR1 RNAi#1 and BubR1 RNAi#2 in the fat body driven by CG-GAL4 before or after starvation. The p-values were calculated from respective control by an unpaired Student’s t-test. Results are representative of three biological repetitions (mean ± SD). Student’s t-tests are performed. *p < 0.05, **p < 0.01, ***p < 0.001, ****p < 0.0001.
Figure 4
Figure 4
BubR1 suppresses lipolysis by inhibiting Relish-mediated Bmm expression upon fasting. (A) The TAG level of flies with specially expressing W1118, BubR1 RNAi#1, BubR1 RNAi#1+UAS-LacZ, UAS-Flag-Rel.68, and expressing BubR1 RNAi#1 with UAS-Flag-Rel.68 in the fat body driven by CG-GAL4 under starvation. n = 9 samples. (B) Quantification of the mean area of lipid droplets among the more than 30 ROI (region of interest) in flies under starvation with expressing W1118, BubR1 RNAi#1, UAS-Flag-Rel.68, and expressing BubR1 RNAi#1 with UAS-Flag-Rel.68 in the fat body. Each dot corresponds to one ROI. (C) Bodipy staining of flies with expressing W1118, BubR1 RNAi, UAS-Flag-Rel.68, and expressing BubR1 RNAi with UAS-Flag-Rel.68 in the fat body. Bodipy (neutral lipids; green) and Hoechst (Hoechst; blue) detected by fluorescent histochemistry. (D) The Bmm mRNA level of flies with expressing W1118, BubR1 RNAi, and expressing BubR1 RNAi with UAS-Flag-Rel.68 in the fat body via CG-GAL4. Results are representative of three biological repetitions. (E) The TAG level of flies with specially expressing W1118, BubR1 RNAi#1, BubR1 RNAi#1+UAS-LacZ and expressing BubR1 RNAi#1 with Bmm RNAi in the fat body by CG-GAL4. n = 9 samples. (F) Model of BubR1 regulating lipid metabolism under starvation. Scale bars represent 10 μm (C). Without noted, Data are presented as mean and SD. Student’s t-tests are performed. *p < 0.05, **p < 0.01, ***p < 0.001, ****p < 0.0001, and Abbreviation: n.s.: non-significant represents p > 0.05.

Similar articles

Cited by

References

    1. Toprak U, Hegedus D, Doğan C, Güney G. A journey into the world of insect lipid metabolism. Arch Insect Biochem Physiol. 2020; 104:e21682. 10.1002/arch.21682 - DOI - PubMed
    1. Frühbeck G, Méndez-Giménez L, Fernández-Formoso JA, Fernández S, Rodríguez A. Regulation of adipocyte lipolysis. Nutr Res Rev. 2014; 27:63–93. 10.1017/S095442241400002X - DOI - PubMed
    1. Grabner GF, Xie H, Schweiger M, Zechner R. Lipolysis: cellular mechanisms for lipid mobilization from fat stores. Nat Metab. 2021; 3:1445–65. 10.1038/s42255-021-00493-6 - DOI - PubMed
    1. Heier C, Kühnlein RP. Triacylglycerol Metabolism in Drosophila melanogaster. Genetics. 2018; 210:1163–84. 10.1534/genetics.118.301583 - DOI - PMC - PubMed
    1. Zechner R, Madeo F, Kratky D. Cytosolic lipolysis and lipophagy: two sides of the same coin. Nat Rev Mol Cell Biol. 2017; 18:671–84. 10.1038/nrm.2017.76 - DOI - PubMed

Publication types

LinkOut - more resources