. 2024 Mar 4;221(3):e20231519.
doi: 10.1084/jem.20231519. Epub 2024 Feb 9.

PROTAC-mediated NR4A1 degradation as a novel strategy for cancer immunotherapy

Affiliations

PROTAC-mediated NR4A1 degradation as a novel strategy for cancer immunotherapy

Lei Wang et al. J Exp Med. .

Abstract

An effective cancer therapy requires killing cancer cells and targeting the tumor microenvironment (TME). Searching for molecules critical for multiple cell types in the TME, we identified NR4A1 as one such molecule that can maintain the immune suppressive TME. Here, we establish NR4A1 as a valid target for cancer immunotherapy and describe a first-of-its-kind proteolysis-targeting chimera (PROTAC, named NR-V04) against NR4A1. NR-V04 degrades NR4A1 within hours in vitro and exhibits long-lasting NR4A1 degradation in tumors with an excellent safety profile. NR-V04 inhibits and frequently eradicates established tumors. At the mechanistic level, NR-V04 induces the tumor-infiltrating (TI) B cells and effector memory CD8+ T (Tem) cells and reduces monocytic myeloid-derived suppressor cells (m-MDSC), all of which are known to be clinically relevant immune cell populations in human melanomas. Overall, NR-V04-mediated NR4A1 degradation holds promise for enhancing anticancer immune responses and offers a new avenue for treating various types of cancers such as melanoma.


Conflict of interest statement

Disclosures: L. Wang reported grants from Sanofi during the conduct of the study; in addition, L. Wang had a patent to Modulators of Nuclear Receptor Subfamily 4 Group A Member 1 (NR4A1) and Uses Thereof issued. D.R. Shaffer reported being an employee of Sanofi, a global healthcare and pharmaceutical company, where he receives a salary and stock awards for his work. K.S.M. Smalley reported grants from Revolution Medicines outside the submitted work. D. Zhou reported grants from Sanofi during the conduct of the study; in addition, D. Zhou had a patent to US Patent Application No: 18/023,696 pending. G. Zheng reported a patent to WO2022/072094 pending. W. Zhang reported grants from Sanofi during the conduct of the study; in addition, W. Zhang had a patent to US 2023/0330237 A1 issued. No other disclosures were reported.

Figures

None
Graphical abstract
Figure 1.
Figure 1.
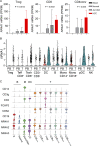
NR4A1 is elevated in several tumor-promoting immune cells within the tumor microenvironment. (A) Expression of NR4A1 in T cells from blood, normal parenchyma, adjacent normal junction, or HCC (GSE98638, six patients). (B) Violin plots showing NR4A1 expression in different immune cells from human peripheral blood (PB) or melanomas (T) (GEO: GSE121638, GSE158803, GSE121638). (C) Violin plots showing gene expression including NR4A family and lineage markers in human melanomas (GSE120575). FPKM, fragments per kilobase of transcript per million fragments mapped; M, monocyte.
Figure S1.
Figure S1.
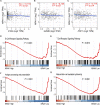
NR4A1 expression is inversely correlated with effector molecules required for T cell activation. (A–C) NR4A1 expression in transcripts per million (TPM) is inversely correlated with (A) IFNG, (B) GZMB, and (C) PRF1 gene expression in the TCGA melanoma datasets. (D–G) GSEA analysis showing the enrichment of immune activation pathways in the melanoma specimens with low NR4A1 expression. The TCGA human melanoma dataset was divided into tertiles based on NR4A1 expression. GSEA analysis was performed using the highest tertile versus the lowest tertile of NR4A1 expression. Supplementary to Fig. 1.
Figure 2.
Figure 2.
NR4A1 deletion leads to diminished tumor growth. (A–C) Primary tumor growth curve in littermates of WT or NR4A1−/− mice, including (A) MC38 colon cancer (P < 0.0001, four mice per group in one experiment); (B) Yummer1.7 melanoma (P < 0.000, eight mice per group in one experiment); and (C) B16F10 melanoma (P < 0.0001, five mice per group in one experiment). Two-way ANOVA was performed for all tumor growth curves with P values indicated.
Figure 3.
Figure 3.
The design and synthesis of NR4A1 PROTACs. (A) A docking study revealed the carboxylic acid in celastrol is a potential tethering vector for PROTAC construction. (B) The structure of synthesized PROTACs. (C and D) The initial screening of NR4A1 degradation in CHL-1 cell line. CHL-1 cells were treated with 250 nM PROTACs for 16 h and the degradation was determined by (C) immunoblotting and (D) densitometry from two experiments. Source data are available for this figure: SourceData F3.
Figure 4.
Figure 4.
NR-V04 induces NR4A1 degradation. (A) NR-V04 effectively promoted the degradation of NR4A1 in two human melanoma cell lines within 16 h, CHL-1 (DC50 = 228.5 nM) and A375 (DC50 = 518.8 nM), while simultaneously stabilizing VHL protein; two experiments. (B) Celastrol treatment did not result in any significant change in the expression level of NR4A1 in the CHL-1 cell line within 16 h; two experiments. (C) Time-dependent degradation of NR4A1. CHL-1 cells were treated with 500 nM of NR-V04 at the indicated time points; two experiments. (D) NR-V04 did not induce the degradation of NR4A2 and NR4A3; two experiments. Source data are available for this figure: SourceData F4.
Figure S2.
Figure S2.
NR-V04 induces NR4A1 degradation. (A) NR-V04 effectively promoted the degradation of NR4A1 in two more human melanoma cell lines in 16 h, including WM164 and M229, while simultaneously stabilizing VHL expression; two experiments. (B) NR-V04 effectively promoted the degradation of NR4A1 in two mouse melanoma cell lines in 16 h, including SM1 and SW1; two experiments. (C) NR-V04 did not induce the degradation of NR4A2 and NR4A3; two experiments. (D) NR-V04 induces a transient elevation of NR4A1 mRNA in short time. CHL-1 cells were treated with 500 nM of celastrol or NR-V04 at the indicated time points. RNA was prepared for reverse transcription and qPCR. ACTB was used as control; N = 4, one experiment. (E) Ternary complex formation was observed in CHL-1 cells with 16-h treatments of 500 nM NR-V04, rather than DMSO or 500 nM celastrol, as detected by PLA (63× magnification); two experiments. Bar represents 10 μm for both images. (F) NR4A1 degradation by 500 or 1,000 nM of NR-V04 for 16 h in the WT or VHL KO HEK293T cells; two experiments. A two-sided unpaired t test was performed, with P values indicated (P = 0.0104 between control and 2 h of celastrol treatment; P = 0.023 and 0.008, respectively, between control and 2 or 4 h of NR-V04 treatment). Supplementary to Figs. 4 and 5. Source data are available for this figure: SourceData FS2.
Figure 5.
Figure 5.
NR-V04 induces a ternary complex formation and mediates NR4A1 degradation through the ubiquitin-proteasome system. (A) PLA showing ternary complex formation induced by NR-V04. CHL-1 (left panels) and A375 (right panels) cells were pretreated with 0.5 μM MG132 for 10 min and then treated with DMSO, 500 nM celastrol, or 500 nM NR-V04 for 16 h. Representative images were shown for PLA assay (20× magnification); two experiments. Bar represents 50 μm for all images. (B) Co-IP experiment showing complex formation between NR4A1 and VHL by NR-V04 treatment. Co-IP was performed in NR4A1-Flag overexpressed HEK293T cells that were pretreated with 0.5 μM MG132 for 10 min, followed by 16-h treatment with DMSO or 500 nM NR-V04. NR4A1 was pulled down using an anti-Flag antibody conjugated to magnetic beads; two experiments. (C) NR-V04 induces NR4A1 degradation via VHL E3 ligase- and proteasome-dependent manner. CHL-1 cells were pretreated with 0.5 μM MG132 or 10 µM VHL 032 for 10 min, followed by 16-h treatment with DMSO or 500 nM NR-V04, three experiments. Source data are available for this figure: SourceData F5.
Figure 6.
Figure 6.
The PK and PD study of NR-V04. (A) PK parameters of NR-V04 in WT mice with three mice per group; one experiment. i.v. or IV, intraveneous injection; i.p. or IP, intraperitoneal injection; Tmax, time to drug peak comtration; Cmax, peak concentratin; AUC, area under the curve; T1/2, mean half-life; CL, clearance rate; MRT, mean residence time; Vss, steady state volume of distribution; F, fraction of bioavailability. (B) NR-V04 induces long-lasting degradation of NR4A1 in MC38 tumors. Mice bearing MC38 tumors were treated with two-dose administration of NR-V04 via i.p. (IP) injection at 1.8 mg/kg, and tumors were collected at indicated timepoints. Tumor lysates were analyzed by immunoblotting with each lane representing an individual tumor lysate; two experiments. (C) Immunoblotting showing NR4A1 degradation in MC38 tumors upon termination. MC38 tumor–bearing mice were treated with vehicle, 1.8 mg/kg NR-V04, or 0.75 mg/kg celastrol treatment (equivalent to 1.67 μmol/kg) every 4 days until experimental endpoints. Tumor tissues were collected for lysate collection and immunoblotting. Two to four biological samples per group, two experiments. Source data are available for this figure: SourceData F6.
Figure 7.
Figure 7.
NR-V04 exhibits antitumor effects in several tumor models. (A–F) Tumor-bearing mice were treated with 1.8 mg/kg NR-V04 or vehicle via i.p. injection on day 7 when tumors were palpable. The treatment was repeated every 4 days until the tumors reached the endpoint size of 2 cm in diameter. (A) NR-V04 inhibited MC38 colon adenocarcinoma growth. P < 0.0001, four mice per group, two experiments. (B) NR-V04 inhibited Yummer1.7 melanoma growth. P < 0.0001, four mice per group, two experiments. (C) NR-V04 inhibited B16F10 melanoma growth. P < 0.0001, five mice per group, two experiments. (D) NR-V04 failed to inhibit B16F10 melanoma growth in NR4A1−/− mice. P = 0.7139, five mice per group in one experiment. (E) NR-V04 failed to inhibit MC38 colon adenocarcinoma growth in NSG mice. P = 0.1293, five mice per group in one experiment. (F) NR-V04 failed to inhibit B16F10 melanoma in NSG mice. P = 0.1801, five mice per group in one experiment. Two-way ANOVA was performed for all tumor growth curves with P values indicated.
Figure S3.
Figure S3.
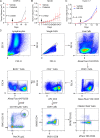
Celastrol treatment in B16F10 and MC38 models and NR-V04 treatment in Yumm1.7 model and schematic showing gating strategy for flow cytometry. (A and B) (A) B16F10 or (B) MC38 tumor–bearing mice were treated with vehicle or celastrol using the same treatment regimen as NR-V04 (Fig. 7). N = 5 for A, P = 0.0008, one experiment. N = 3 for B, P = 0.7852, one experiment. (C) Yumm1.7 (non-immunogenic Yumm cell line lineage) tumor–bearing mice were treated with vehicle or 1.8 mg/kg NR-V04. N = 8, P = 0.1175, one experiment. (D) Schematic showing gating strategy for flow cytometry of immune cell populations. Two-way ANOVA was performed for all tumor growth curves with P values indicated. Supplementary to Figs. 7 and 8.
Figure 8.
Figure 8.
Effect of NR-V04 on immune cells in the TME. (A–D) Tumor-bearing mice were treated with 1.8 mg/kg NR-V04 or vehicle via i.p. injection when tumor size reached 1 cm in diameter, with two treatments on day 1 and day 4. Tumors were collected and single cells were isolated from tissues for flow cytometry analysis. (A and B) NR-V04 treatment increases B cell percentage in the TME, but not in spleen and blood in mice inoculated with (A) B16F10, P = 0.002 (tumor), seven tumors per group, one experiment, or (B) Yumm1.6 melanomas, P = 0.0134, seven tumors per group, one experiment. (C) NR-V04 treatment increased CD8 Tem cell percentage in B16F10 melanoma. P = 0.0926 (tumor) and P = 0.0169 (spleen), seven tumors per group, two experiments. (D) NR-V04 treatment decreased m-MDSC percentage in tumor and blood, but not in spleen in B16F10 melanoma. P = 0.05 (tumor) and P = 0.0006 (blood), seven tumors per group, two experiments. (E) NR4A1 depletion induces B cell proliferation. B cells isolated from spleen were labeled with Cell Trace Violet, untreated or treated with B16F10 lysis, following with the co-treatment of DMSO, 250, or 500 nM NR-V04 for 24 h. NR4A1 degradation (left) and B cell proliferation (right) were determined by flow cytometry. P < 0.0001 (left) and P = 0.0002 (right), three biological repeats, two experiments. Representative images shown in Fig. S4, E and F. (F) NR-V04 fails to inhibit B16F10 melanoma growth in B6.129S2-Ighmtm1Cgn/J mice deficient of mature B cells. Five tumors per group, one experiment. Two-way ANOVA was performed for (F) tumor growth curve with P value indicated. Others are shown as the mean ± SD. A two-sided unpaired t test was performed, with P values indicated. NS is non-significant.
Figure S4.
Figure S4.
NR-V04 regulates B and T cells. (A) Schematic showing gating strategy for flow cytometry of B cell populations. (B) NR-V04 induces significant B cell proliferation in B16F10 tumors. B16F10 tumor-bearing mice were treated with vehicle and NR-V04 as in Fig. 8. N = 4, P = 0.0005 (B220+CD19+), P = 0.0002 (Plasmablast), P = 0.011 (IgD+IgM), P = 0.0083 (IgD+IgM+); two experiments. (C and D) Splenic B cells from WT or NR4A1−/− mice were either untreated or treated with IgM to induce B cell proliferation that was detected using flow cytometry of dilution of Cell Trace Violet; two experiments for (C) showing representative images and (D) showing all the data points. N = 3, P < 0.0001. (E and F) Splenic B cells were treated with or without B16F10 lysis stimulation in vitro and B cell proliferation was assayed similarly using flow cytometry, with or without the presence of 250 or 500 nM of NR-V04 treatment for 24 h. N = 3. Representative images showing (E) NR4A1 protein or (F) Cell Trace Violet dilution, determined by flow cytometry. Con, control, NS, non-stimulated by B16F10 lysate; two experiments. (G and H) CD8+ T cell depletion diminishes therapeutic responses of NR-V04. Yummer1.7 tumors were established similarly as in Fig. 7 B, following i.p. injection of either Rat IgG2a or anti-CD8 antibody (Clone: 53-6.7; BioXCell) at 100 µg/mouse, twice a week starting day 0 of tumor cell injection. NR-V04 treatment started on day 7 similarly. (G) Histogram showing the effective depletion of CD8 but not CD4 T cells by anti-CD8 antibody. N = 3. (H) CD8+ T cell depletion diminishes therapeutic responses of NR-V04 in the Yummer1.7 model, similarly treated as in Fig. 7 B. N = 6, P = 0.3151, one experiment. (I) NR-V04 did not significantly reduce CD8+ Texh cells in (left panel) B16F10, N = 7, P = 0.1403, and (right panel) MC38 tumor models, N = 4, P = 0.1403, from experiments shown in Fig. 7 C, and Fig. 7 A, respectively, when tumors are different in size. (J–M) NR-V04 reduces CD8+ T cell exhaustion in vitro. (J and K) Human primary T cells isolated from blood and cultured with anti-CD3/CD28 Dynabeads (bead/cell = 1:1) for 7 days, and then treated with 500 nM of NR-V04 for 48 h prior to harvesting and analyzed using flow cytometry. (J) Flow gating of human CD8+ Texh cells. (K) 500 nM of NR-V04 significantly decreased human CD8+ Texh cells. N = 4, P = 0.0002, two experiments. (L and M) Mouse OT-1 CD8+ T cells supplemented with 10 ng/ml ovalbumin daily for 7 days to induce exhaustion, following with the treatment of 500 nM NR-V04 for 48 h prior to harvesting and analyzed using flow cytometry. (L) Flow gating of mouse CD8+ OT-1 Texh cells. (M). NR-V04 significantly reduced the percentage of OT-1 CD8+ Texh cells in CD8+ T cells. N = 4, P = 0.0479, two experiments. Two-way ANOVA was performed for all tumor growth curves with P values indicated. Others are shown as the mean ± SD. A two-sided unpaired t test was performed, with P values indicated. Supplementary to Fig. 8.
Figure 9.
Figure 9.
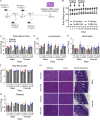
NR-V04 has minimal toxicity. (A) Schematic of the toxicity testing. Male and female mice were treated with two doses of 2 mg/kg NR-V04 and two doses of 5 mg/kg NR-V04 over 2 wk. Blood samples were collected on day 0, 7, 14, and 42 for hematology analysis, and body weight was measured twice per week. On day 42, all mice were euthanized, and tissues (kidney, liver, and small intestine) were harvested for H&E staining. (B) Mice did not experience significant weight loss with NR-V04 treatment during the 42-day period. Three biological repeats, two experiments. (C–G) Hematology analysis of different blood cell components after NR-V04 or vehicle treatment, including (C) whole blood cells, (D) lymphocytes, (E) neutrophils, (F) red blood cells, and (G) platelets. Three biological repeats, two experiments. (B–G) P > 0.05. Two-sided unpaired t test was performed. (H) NR-V04 impacts on tissue histology, including representative kidney, liver, and small intestine. Three biological repeats, one experiment. Bar represents 300 μm for all images.
Figure S5.
Figure S5.
NR-V04 has minimal toxicity. (A–F) Hematology analysis of different blood cell components after NR-V04 or vehicle treatment. NR-V04 did not cause significant changes in the hematologic profile including (A) mean platelet volume, (B) hemoglobin, (C) mean corpuscular hemoglobin, (D) mean corpuscular hemoglobin concentration, (E) hematocrit, and (F) mean corpuscular volume. N = 3, P > 0.05 for A–F, one experiment. A two-sided unpaired t test was performed, with all P values > 0.05. Supplementary to Fig. 9.

Update of

References

    1. Békés, M., Langley D.R., and Crews C.M.. 2022. PROTAC targeted protein degraders: The past is prologue. Nat. Rev. Drug Discov. 21:181–200. 10.1038/s41573-021-00371-6 - DOI - PMC - PubMed
    1. Borcherding, N., Vishwakarma A., Voigt A.P., Bellizzi A., Kaplan J., Nepple K., Salem A.K., Jenkins R.W., Zakharia Y., and Zhang W.. 2021. Mapping the immune environment in clear cell renal carcinoma by single-cell genomics. Commun. Biol. 4:122. 10.1038/s42003-020-01625-6 - DOI - PMC - PubMed
    1. Cabrita, R., Lauss M., Sanna A., Donia M., Skaarup Larsen M., Mitra S., Johansson I., Phung B., Harbst K., Vallon-Christersson J., et al. 2020. Tertiary lymphoid structures improve immunotherapy and survival in melanoma. Nature. 577:561–565. 10.1038/s41586-019-1914-8 - DOI - PubMed
    1. Carelock, M.E., Master R.P., Kim M.-C., Jin Z., Wang L., Maharjan C.K., Jua N., Kolb R., Xiao Y., Liao D., et al. 2023. Targeting intracellular proteins with cell type-specific functions for cancer immunotherapy. Life Med. 2:Inad019. 10.1093/lifemedi/lnad019 - DOI
    1. Chen, C., Li Y., Hou S., Bourbon P.M., Qin L., Zhao K., Ye T., Zhao D., and Zeng H.. 2020. Orphan nuclear receptor TR3/Nur77 biologics inhibit tumor growth by targeting angiogenesis and tumor cells. Microvasc. Res. 128:103934. 10.1016/j.mvr.2019.103934 - DOI - PubMed

MeSH terms

Substances