. 2024 Apr 1;223(4):e202305003.
doi: 10.1083/jcb.202305003. Epub 2024 Feb 9.

APOE traffics to astrocyte lipid droplets and modulates triglyceride saturation and droplet size

Affiliations

APOE traffics to astrocyte lipid droplets and modulates triglyceride saturation and droplet size

Ian A Windham et al. J Cell Biol. .

Abstract

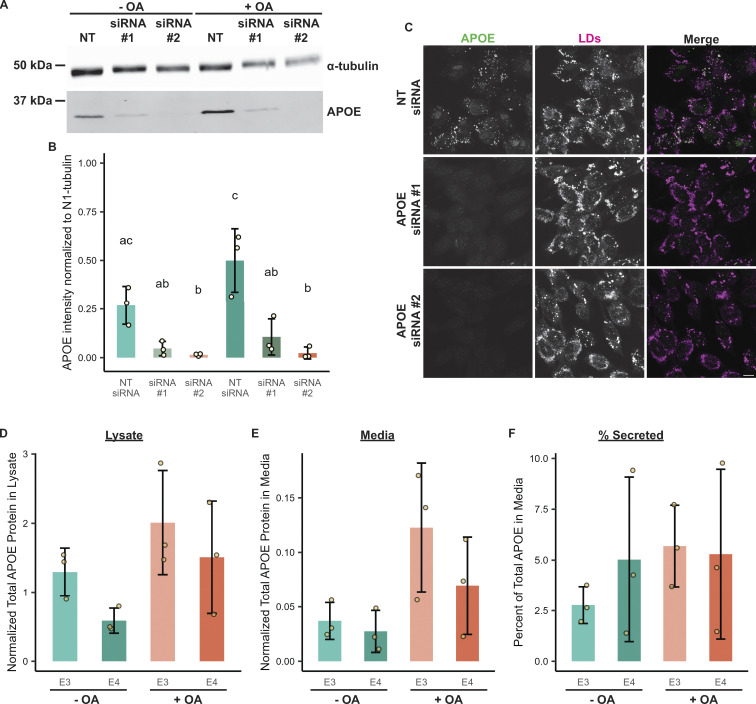
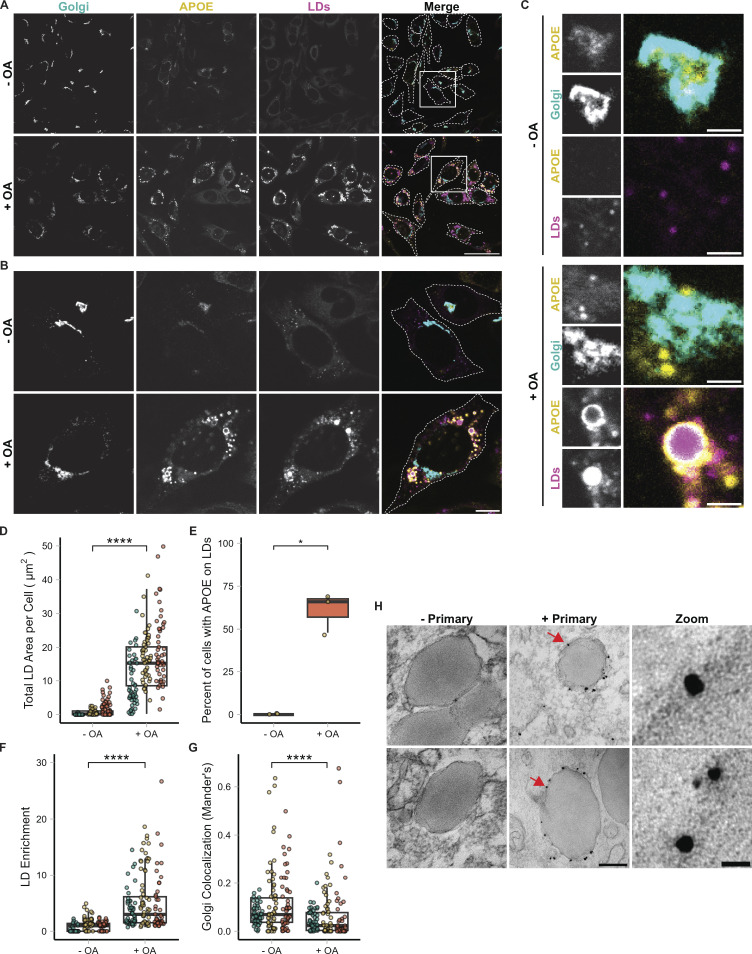
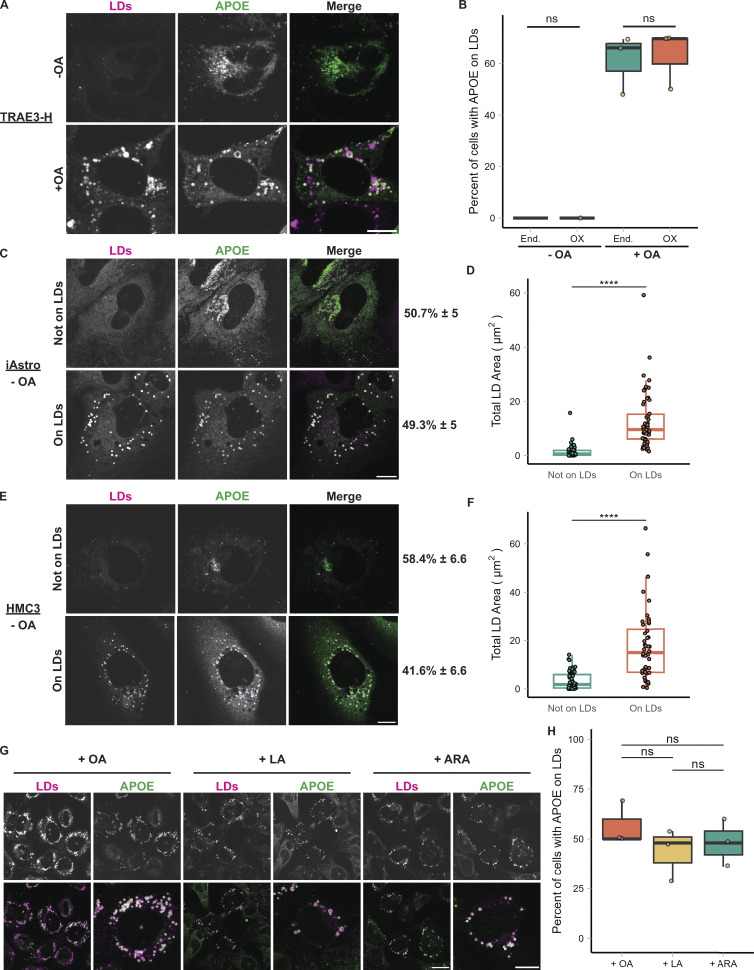
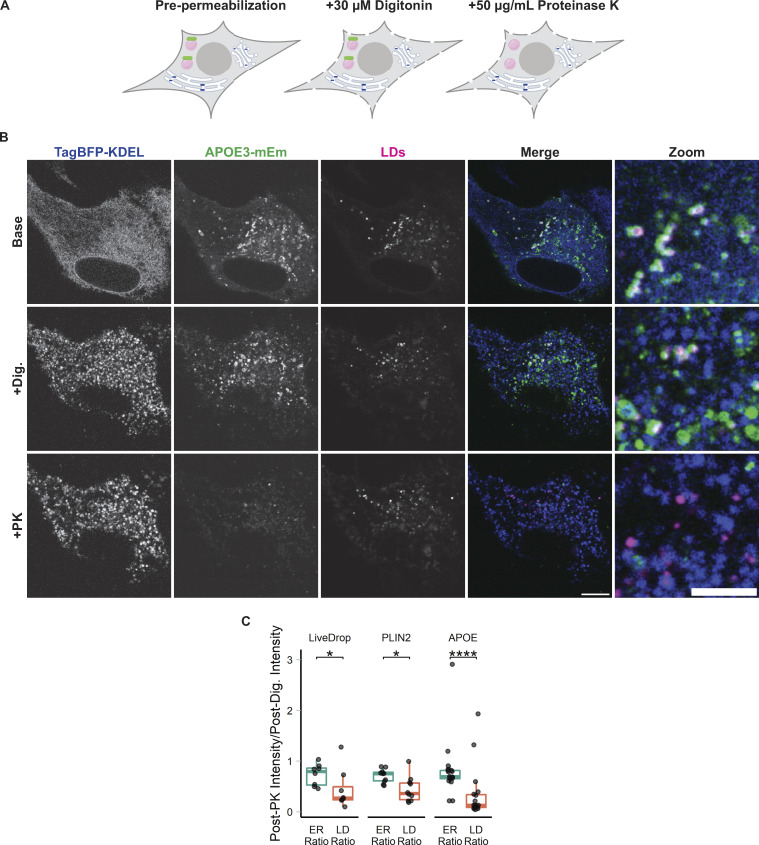
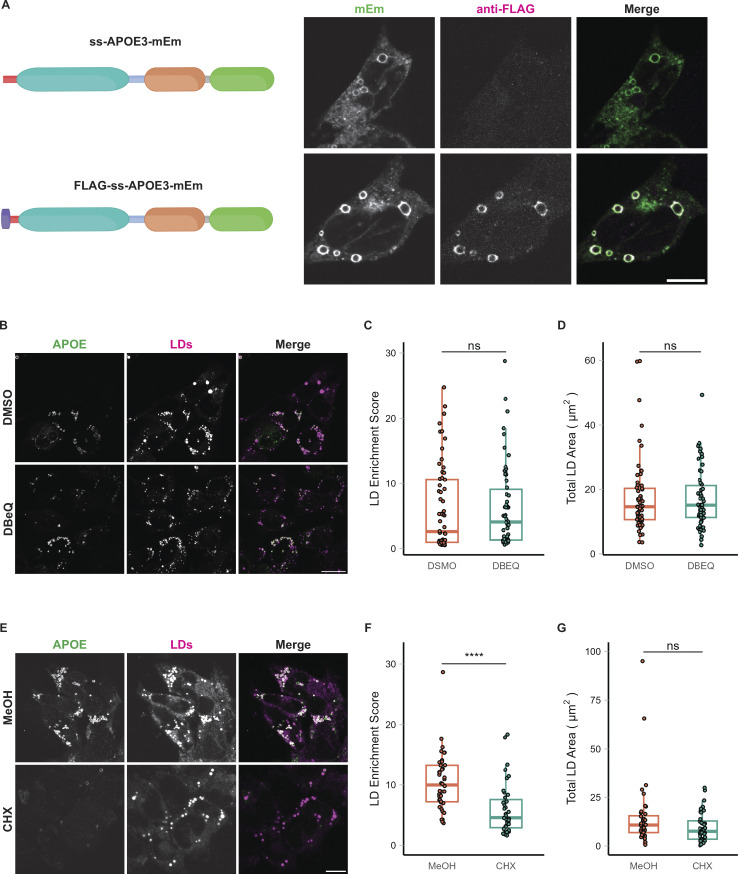
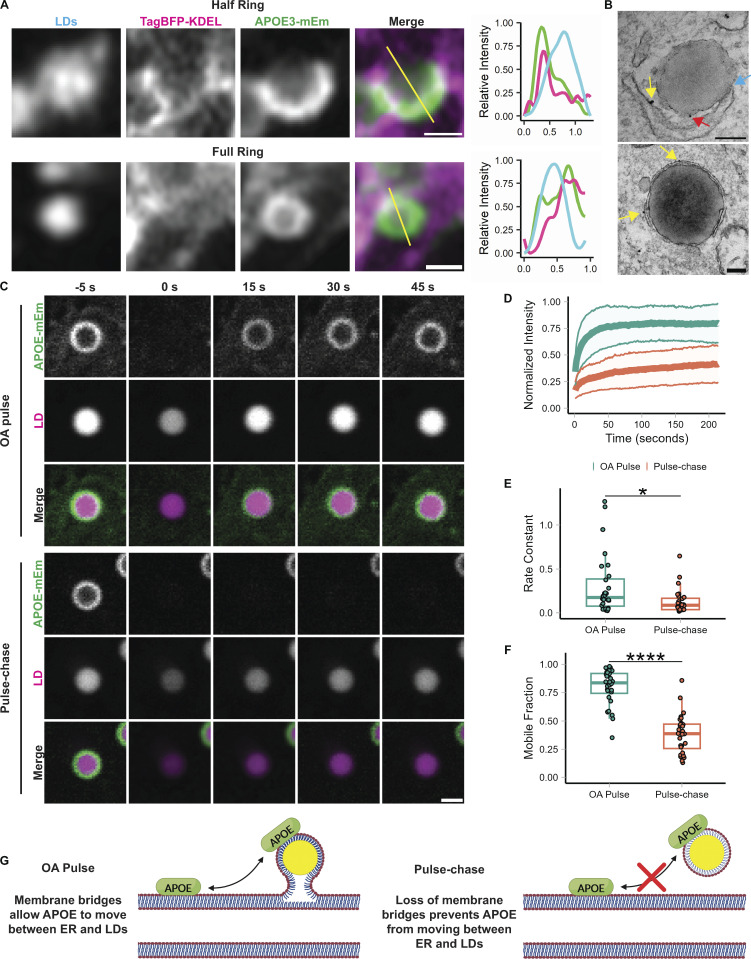
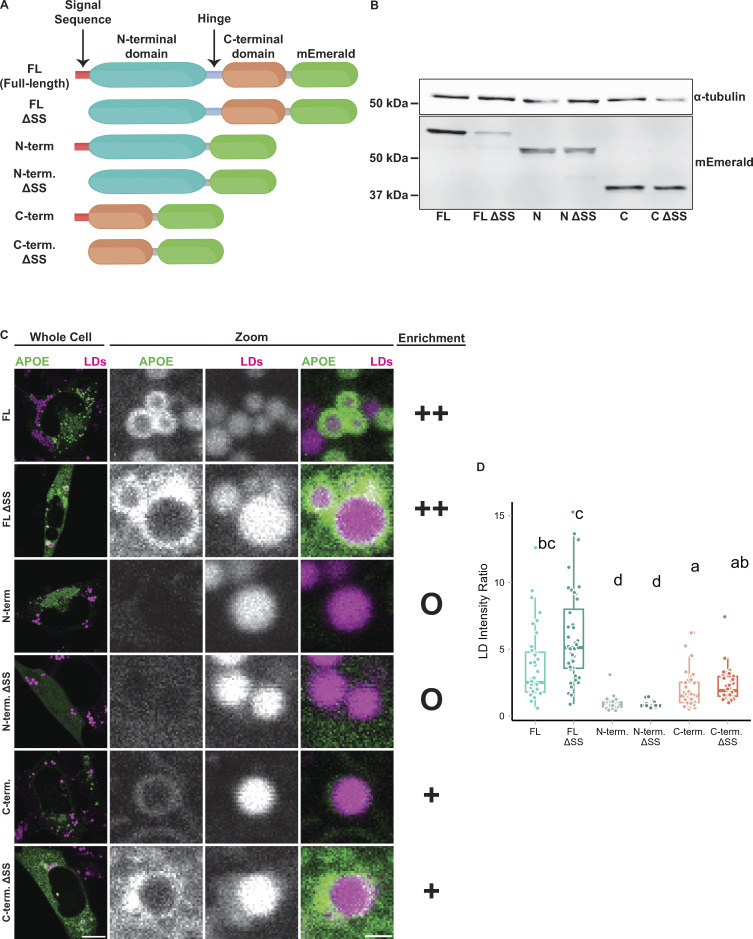
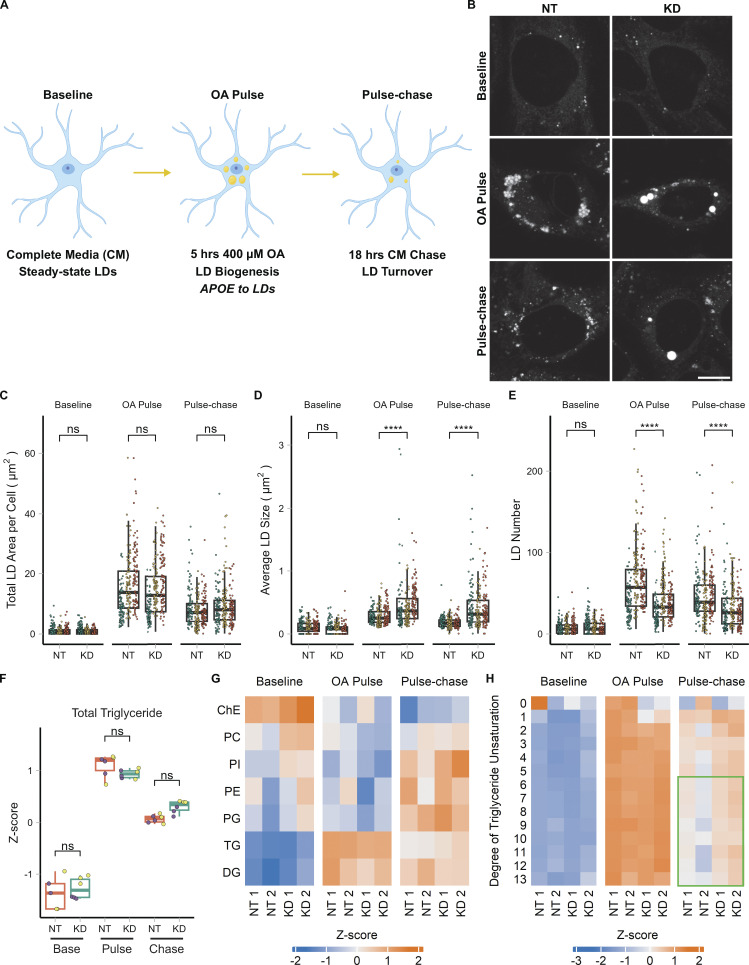
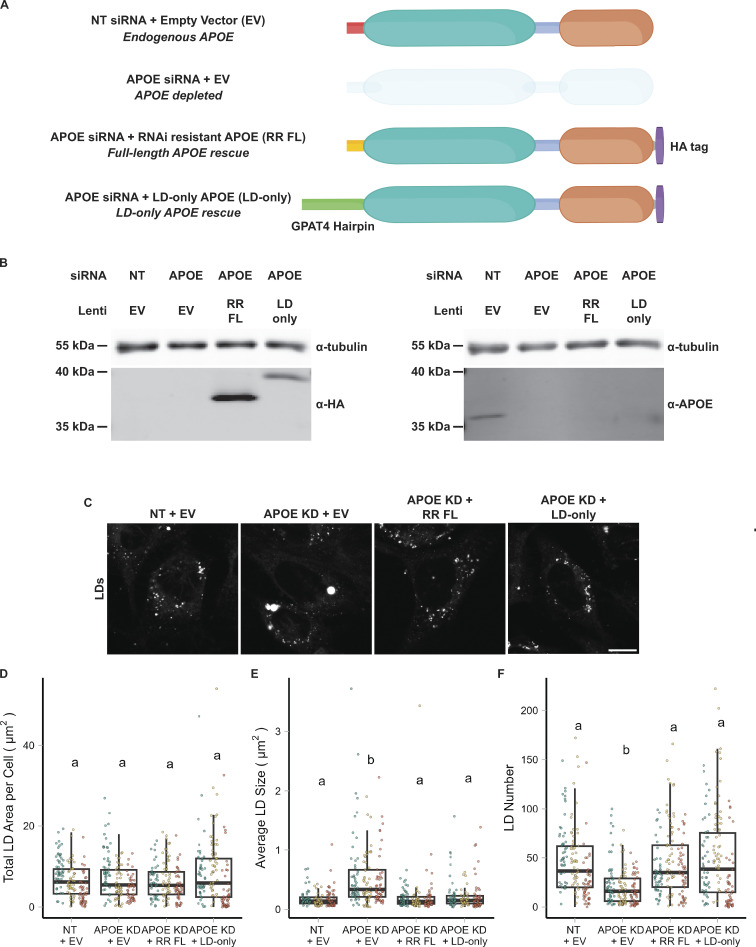
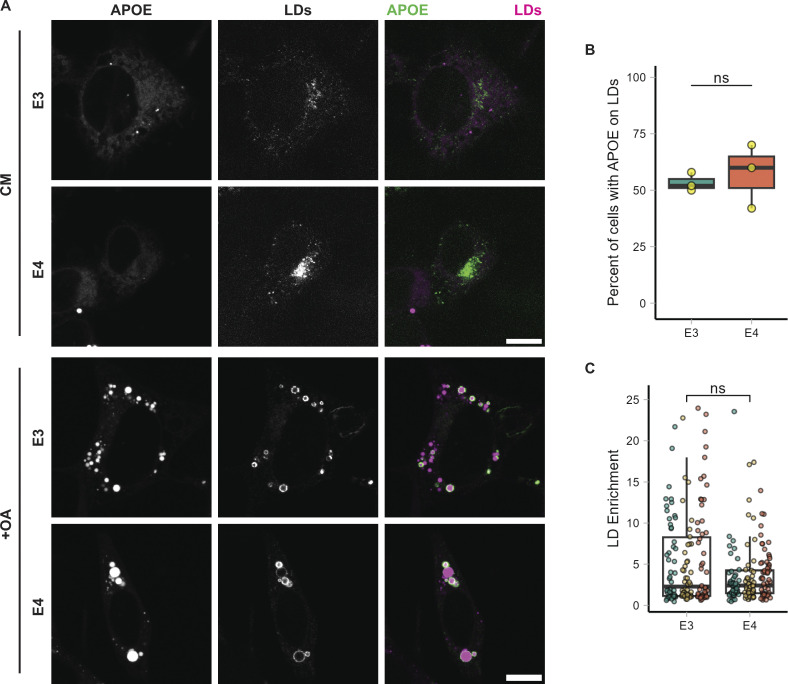
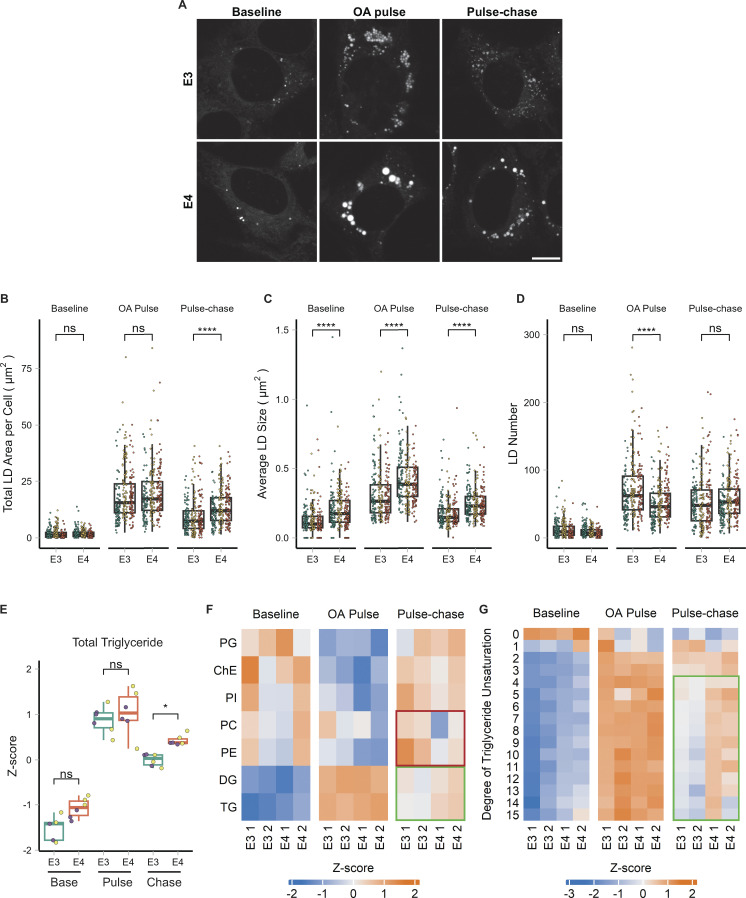
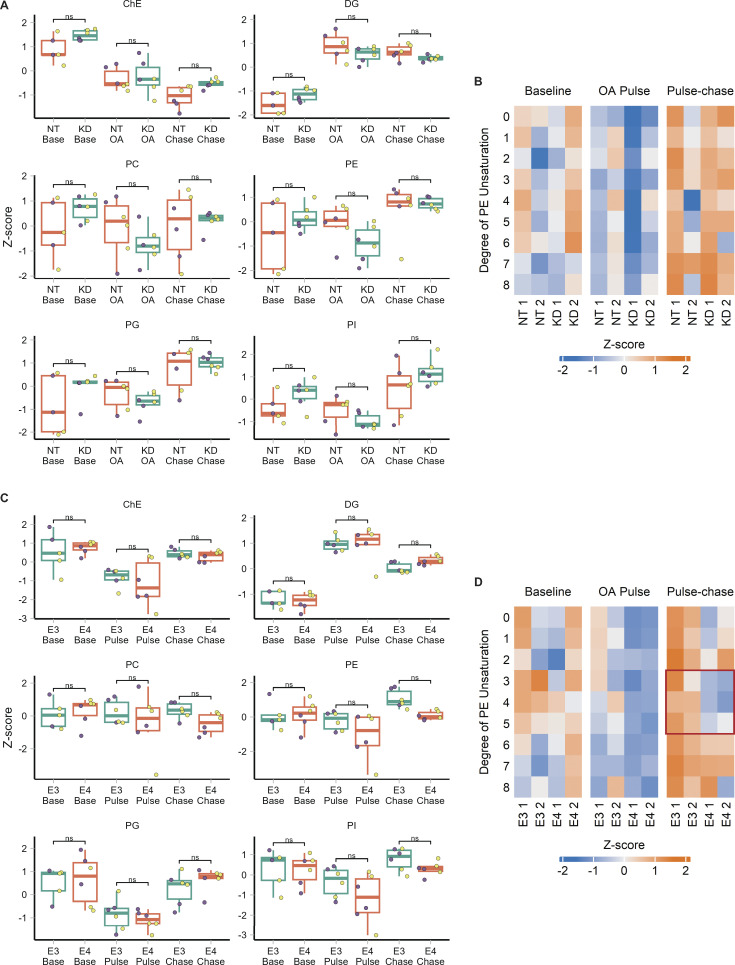
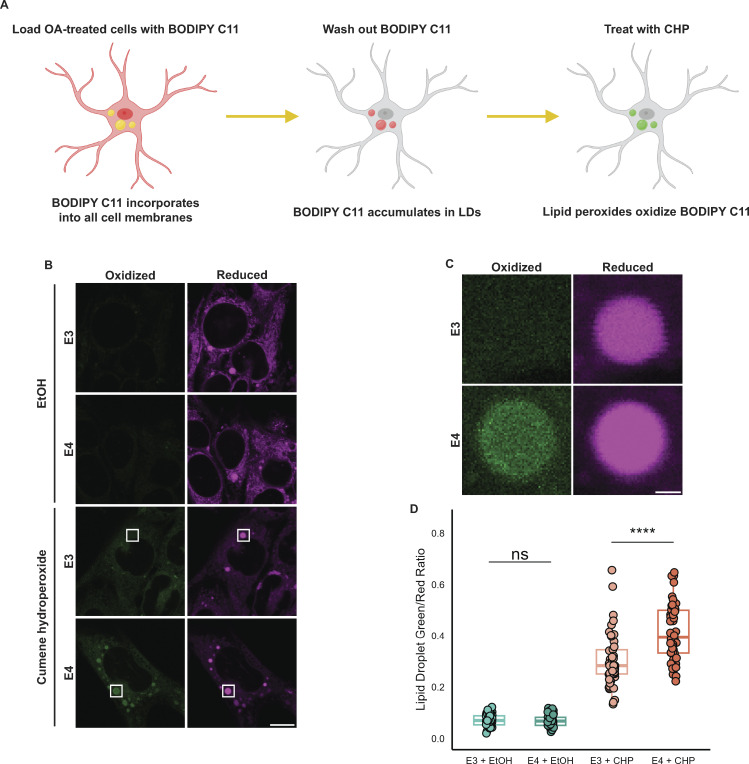
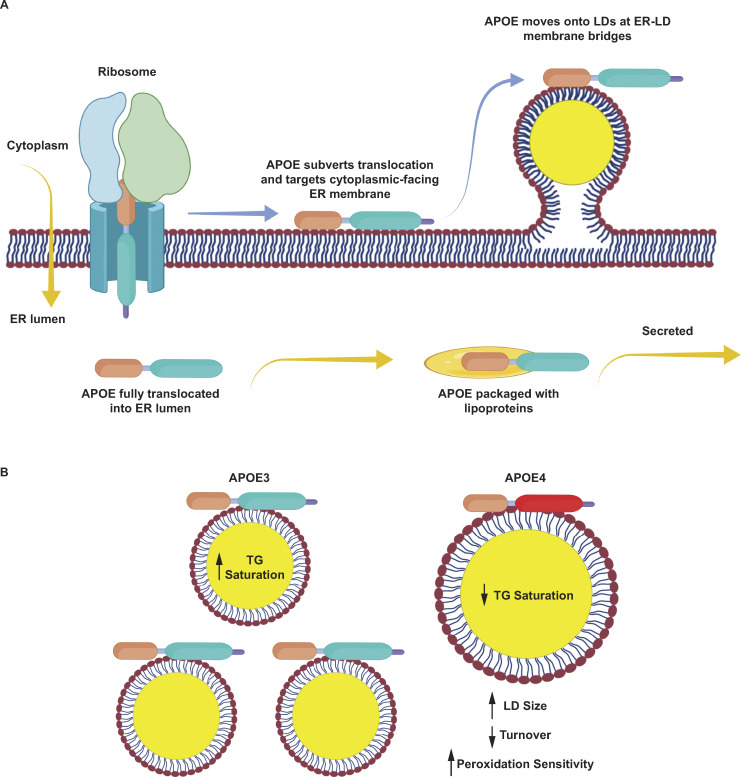
The E4 variant of APOE strongly predisposes individuals to late-onset Alzheimer's disease. We demonstrate that in response to lipogenesis, apolipoprotein E (APOE) in astrocytes can avoid translocation into the endoplasmic reticulum (ER) lumen and traffic to lipid droplets (LDs) via membrane bridges at ER-LD contacts. APOE knockdown promotes fewer, larger LDs after a fatty acid pulse, which contain more unsaturated triglyceride after fatty acid pulse-chase. This LD size phenotype was rescued by chimeric APOE that targets only LDs. Like APOE depletion, APOE4-expressing astrocytes form a small number of large LDs enriched in unsaturated triglyceride. Additionally, the LDs in APOE4 cells exhibit impaired turnover and increased sensitivity to lipid peroxidation. Our data indicate that APOE plays a previously unrecognized role as an LD surface protein that regulates LD size and composition. APOE4 causes aberrant LD composition and morphology. Our study contributes to accumulating evidence that APOE4 astrocytes with large, unsaturated LDs are sensitized to lipid peroxidation, which could contribute to Alzheimer's disease risk.


Conflict of interest statement

Disclosures: The authors declare no competing interests exist.

Figures

Figure S1.
Figure S1.
Validation of APOE antibody via siRNA-mediated knockdown and measurement of intracellular and secreted APOE ± OA. (A) Western blot of lysates of TRAE3-H cells transfected with a non-targeting siRNA or one of two different siRNAs against APOE and treated ± OA for 5 h. The antibody used to probe for endogenous APOE is the same one used for both the immunofluorescence and immunogold experiments. (B) Quantification of Western blots of APOE knockdown from three independent biological replicates. APOE siRNA #2 demonstrated ∼94% knockdown of APOE in both − and + OA conditions, and was used for subsequent loss of function studies in Figs. 5 and 6. (C) Representative confocal slices of TRAE3-H cells transfected with NT siRNA or one of two APOE siRNAs and treated with 400 µM OA for 5 h. Cells were fixed and stained for endogenous APOE with an anti-APOE antibody and for LDs with BODIPY 493/503. Little to no endogenous APOE signal was observed by immunofluorescence upon APOE knockdown. Scale bar, 10 µm. (D) Normalized total APOE protein present in TRAE3-H and TRAE4-H lysates ± 5-h OA treatment. Cells were lysed in 100 µl of lysis buffer, and APOE protein concentrations in µg/ml were measured by ELISA. The APOE concentration in µg/ml was multiplied by the total lysate volume of 0.1 ml to derive the total amount of APOE protein in the sample. These values were then normalized by dividing the corresponding total lysate protein concentration of each sample measured via Bradford assay to account for differences in cell number. N = 3 independent biological replicates. Data are expressed in bar graphs as means, and error bars represent ± standard deviation. P value calculated via Tukey’s HSD. All pairwise comparisons were statistically insignificant. (E) Normalized total APOE protein present in TRAE3-H and TRAE4-H media ± 5-h OA treatment. Cells were grown in 1 ml of media, and APOE protein concentrations in µg/ml were measured by ELISA. The APOE concentration in µg/ml was multiplied by the total media volume of 1 ml to derive the total amount of APOE protein in the sample. These values were then normalized by dividing the total lysate protein concentration of the corresponding lysate sample measured via Bradford assay to account for variations in total material. N = 3 independent biological replicates. Data are expressed in bar graphs as means and error bars represent ± standard deviation. P value calculated via Tukey’s HSD. All pairwise comparisons were statistically insignificant. (F) The percentage of APOE present in the media out of the total APOE protein present in the lysate + media. Around 5% of total APOE protein was secreted into the media after 5 h ± OA treatment in all conditions. N = 3 independent biological replicates. Data are expressed in bar graphs as means, and error bars represent ± standard deviation. P value calculated via Tukey’s HSD. All pairwise comparisons were statistically insignificant. Source data are available for this figure: SourceData FS1.
Figure 1.
Figure 1.
APOE localizes to cytoplasmic LDs in astrocytes during lipogenesis. (A) Representative fields of TRAE3-H cells untreated (− OA) or treated with 400 µM oleic acid for 5 h (+ OA). Cells were then fixed and stained for endogenous APOE with an anti-APOE antibody, an anti-GM130 antibody to label the Golgi, and LDs with BODIPY 493/503. In the merged image, APOE is yellow, GM130/Golgi is cyan, and LDs are magenta. White dotted lines outline the plasma membranes of individual cells in the field. Scale bar, 50 µm. (B) Individual cells from A (labeled by white inset boxes) show the increase in LDs and the enrichment of APOE on the LD surface upon OA loading. Scale bar, 10 µm. (C) Inset of images from B. The top panels show the colocalization of APOE with the Golgi and the lack of LD-associated APOE in untreated cells. The bottom panels show APOE coating the surface of LDs and the concomitant reduction in Golgi colocalization upon OA treatment. Scale bar, 1 µm. (D) Quantification of the total area of BODIPY 493/503-labeled LDs per cell ± OA. N = 150 cells per condition, with 50 cells from each independent experiment. Each data point represents one cell, and each color represents data collected from a separate, independent experiment. (E) Percentage of cells that have APOE on the surface of LDs ± OA. Each data point represents the percentage of 50 randomly selected cells from one independent experiment with APOE on the surface of LDs. 61.1% ± 11.5 of cells have APOE on the surface of LDs after 5 h 400 µM OA treatment. (F) Quantification of APOE enrichment on the surface of LDs in TRAE3-H cells ± OA. LD enrichment is equal to the mean intensity of APOE signal surrounding LDs divided by the mean intensity of the entire cell minus the LDs. N = 150 cells per condition, with 50 cells from each independent experiment. Each data point represents one cell, and each color represents data collected from a separate, independent experiment. (G) Quantification of colocalization of APOE with the Golgi marker GM130 as measured by the Mander’s coefficient in TRAE3-H cells ± OA. The Mander’s coefficient was calculated by dividing the area of overlap between APOE and GM130 masks by the total area of the APOE mask. N = 150 cells per condition, with 50 cells from each independent experiment. Each data point represents one cell, and each color represents data collected from a separate, independent experiment. (H) Immunogold electron micrographs of endogenous APOE in TRAE3-H cells treated with 400 µM OA for 5 h. The primary APOE antibody was included in images labeled “+ Primary,” and not included in the negative control images labeled “− Primary.” Silver-enhanced gold particles localize directly to the surface of LDs at the interface between the LD monolayer surface and the cytoplasm. Scale bars: 200 nm (left), 20 nm for zoom (right). P values for D, F, and G were calculated using a clustered Wilcoxon rank sum test via the Rosner-Glynn-Lee method. **** P < 0.0001. P value for E calculated via unpaired two-tailed t test. * P < 0.05.
Figure S2.
Figure S2.
Effect of APOE overexpression on LD targeting; targeting of APOE to LDs in iAstros and HMC3 cells and in response to multiple unsaturated fatty acids. (A) TRAE3-H cells transfected with APOE3-mEm, labeled for LDs with BODIPY 665/676, and treated ± OA. APOE3-mEm localizes to the secretory pathway in the absence of OA and shifts to LDs after OA treatment. Scale bar, 10 µm. (B) Percentage of cells that have either endogenous APOE or APOE3-mEm on the surface of LDs ± OA. Each data point represents the percentage of 35–50 randomly selected cells from one independent experiment with APOE on the surface of LDs. Data for endogenous APOE fractions are the same as in Fig. 1 E. There is no significant difference between endogenous and overexpressed APOE in the fraction of cells with APOE on LDs. (C) Representative confocal slices of induced pluripotent stem cell-derived astrocytes (iAstros) transfected with APOE3-mEm and labeled for LDs with BODIPY 665/676. Under baseline media conditions, ∼49.3% of iAstros have APOE on LDs, while 50.7% of iAstros do not have APOE on LDs. Scale bar, 10 µm. (D) Quantification of total LD area per cell in iAstros that do not exhibit APOE on LDs versus iAstros that have LD-associated APOE. LD localization of APOE correlates with LD abundance. N = 54–55 cells per condition. Data were collected and pooled from three biologically independent experiments. (E) Representative confocal slices of human microglial HMC3 cells transfected with APOE3-mEm and labeled for LDs with BODIPY 665/676. Under baseline media conditions, ∼41.6% of HMC3 cells have APOE on LDs, while 58.4% of HMC3 cells do not have APOE on LDs. Scale bar, 10 µm. (F) Quantification of total LD area per cell in HMC3 cells that do not exhibit APOE on LDs versus HMC3 cells that have LD-associated APOE. LD localization of APOE correlates with LD abundance. N = 44–54 cells per condition. Data were collected and pooled from three biologically independent experiments. (G) TRAE3-H cells loaded with oleic acid (OA), linoleic acid (LA), or arachidonic acid (ARA), fixed, and stained for endogenous APOE and LDs with BODIPY 493/503. Each fatty acid stimulated LD biogenesis and APOE trafficking to LDs in TRAE3-H cells. Scale bar, 20 µm (field), 10 µm (single cell). (H) Percentage of TRAE3-H cells loaded with OA, LA, or ARA with APOE on the surface of LDs. Each data point represents the percentage of 50 randomly selected cells from one independent experiment with APOE on the surface of LDs. There is no significant difference in APOE trafficking among the different fatty acid loading conditions. P values for B and P values for D and F were calculated using a Wilcox rank sum test. **** P <0.0001.
Figure 2.
Figure 2.
LD-associated APOE is exposed to the cytoplasm. (A) Cartoon schematic of the fluorescence protease protection (FPP) assay to test the topology of fluorescently tagged proteins in live cells. Cells are treated with 30 µM digitonin for 1 min, which selectively permeabilizes the plasma membrane but not the internal membranes. After permeabilization, cells are treated with 50 µg/ml proteinase K (PK), which enters the permeabilized plasma membrane and degrades all cytoplasmic-facing fluorophores (green). Because the ER membrane is not permeabilized, proteinase K does not enter into the ER lumen and ER lumen-facing fluorophores are retained (blue). (B) Representative confocal slices of FPP performed on primary cortical rat astrocytes (− OA) transiently transfected with APOE3-mEm, the ER marker TagBFP2-KDEL, and labeled for LDs with BODIPY 665/676. After digitonin permeabilization and PK treatment, APOE signal on the surface of LDs was lost, but the luminal ER marker fluorescence was retained. A Gaussian filter with a radius of 1 pixel was applied to all images to improve visibility for print. Scale bars: 10 µm (left), 5 µm for zoom (right). (C) Quantification of the FPP assay demonstrated in A and B. The fluorescence intensity of the indicated marker after PK treatment was divided by its fluorescence intensity just before PK treatment. For the “ER ratio,” the mean intensity of TagBFP2-KDEL within the entire cell was measured before and after PK treatment. For the “LD ratio,” the mean fluorescence intensity of the indicated LD protein (APOE, PLIN2, or LiveDrop) surrounding BODIPY 665/676-labeled LDs was measured before and after PK treatment. Ratios close to 1 indicate minimal loss of signal after proteinase K treatment, as observed with the ER marker TagBFP2-KDEL. Lower ratios indicate loss of fluorescence upon PK treatment. N = 8–18 cells per condition, collected from three independent experiments. *P < 0.05, **** P < 0.0001. Dig., 30 µM digitonin. PK, +50 µg/ml Proteinase K. P values were calculated via the Wilcoxon rank sum test and Bonferonni-corrected for multiple comparisons.
Figure S3.
Figure S3.
LD-associated APOE retains its signal peptide and is not retrotranslocated from the ER. (A) Construct design and representative confocal slices of TRAE3-H cells transfected with APOE3-mEm or FLAG-SS-APOE3-mEm and treated with 400 µM OA for 5 h. Cells were then fixed and stained for the FLAG tag with an anti-FLAG antibody. Fluorescence signal on the surface of LDs is positive for both FLAG and mEmerald, indicating that LD-associated APOE retains its N-terminal signal peptide. By contrast, APOE in the secretory pathway is mEm positive but does not stain for FLAG, indicating that the pool of APOE in the secretory pathway is properly processed. Scale bar, 10 µm. (B) Representative confocal slices of TRAE3-H treated with 400 µM OA for 5 h together with 0.1% DMSO vehicle or 10 µM DBeQ. Cells were then fixed and stained for endogenous APOE with an anti-APOE antibody and labeled for LDs with BODIPY 493/503. In the merged image, APOE is in green and LDs are in magenta. Scale bar, 20 µm. (C) The LD enrichment fraction from B was calculated as described in Fig. 1. There is no significant difference in LD enrichment upon DBeQ-treatment, indicating that p97-dependent retrotranslocation is not required for LD-targeting of APOE. (D) Quantification of the total area of BODIPY 493/503-labeled LDs per cell from B. There is no significant difference in the total LD area per cell after DBeQ treatment, indicating that DBeQ does not measurably impact OA-induced LD biogenesis. (E) Representative confocal slices of TRAE3-H slices treated with 400 µM OA for 5 h together with 0.1% MeOH vehicle or 100 µg/ml cycloheximide. Cells were then fixed and stained for endogenous APOE with an anti-APOE antibody and labeled for LDs with BODIPY 493/503. In the merged image, APOE is in green, and LDs are in magenta. Scale bar, 10 µm. (F) The LD enrichment fraction from E was calculated as described in Fig. 1. There is a significant reduction in APOE on LDs upon cycloheximide treatment, suggesting that LD-associated APOE is newly translated. (G) Quantification of the total area of BODIPY 493/503-labeled LDs per cell from E. There is also no significant difference in the total LD area per cell after cycloheximide treatment, indicating that cycloheximide does not measurably impact OA-induced LD biogenesis. (B–G) N = 50 cells per condition. Data were collected and pooled from three biologically independent experiments. Scale bars, 10 µm. ns, P > 0.05, **** P < 0.0001. P values were calculated using a Wilcox rank sum test.
Figure 3.
Figure 3.
APOE targets LDs from the ER. (A) Representative frames from fast Airyscan movies showing the localization of LD-associated APOE relative to the ER after 4 h of treatment with 400 µM OA in TRAE3-H cells. Cells were transfected with APOE3-mEm and the ER marker TagBFP2-KDEL and labeled for LDs with BODIPY 665/676. In the merged images, the ER is in magenta and APOE is in green. The yellow lines across the merged images indicate the line of pixels used to create the linescan graphs to the right of the images. In the linescan graphs, the relative fluorescence intensity of BODIPY 665/676-labeled LDs is in cyan, APOE3-mEm is green, and the ER is magenta. Two different localization patterns were observed: “half rings,” in which APOE partially covers the LD surface and colocalizes with the ER, and “full rings,” where APOE fully encloses the surface of the LD and only partially colocalizes with the ER. Scale bars, 500 nm. (B) Immunogold electron micrographs of endogenous APOE localization at membrane contact sites between the ER and LDs in TRAE3-H cells treated with 400 µM OA for 5 h. The blue arrow points to a direct membrane contact between the ER and an LD. Yellow arrows mark APOE localized to the cytoplasmic face of the ER membrane. The red arrow marks APOE localized to the cytoplasmic surface of the LD. Scale bars, 200 nm. (C) Representative frames from confocal FRAP movies of APOE3-mEm on the surface of BODIPY 665/676-labeled LDs in primary rat cortical astrocytes during an OA pulse (200 µM OA for 4 h) or an OA pulse-chase (200 µM OA for 4 h followed by 2 h chase in complete media—OA). APOE fluorescence was bleached at the 0 s timepoint. Scale bar, 1 µm. (D) Normalized intensity of APOE signal within the bleach ROI over time, with t = 0 s denoting the time at which APOE was bleached. The bold center line is the mean normalized intensity, and the upper and lower bounds of the ribbon represent ± standard deviation (SD). N = 28 cells per condition, collected from three independent experiments. (E) Comparison of the rate constant of recovery k between OA pulse and pulse-chase conditions. The rate constant was derived by fitting each recovery curve to the equation y = C (1 - ekt). N = 28 cells per condition, collected from three independent experiments. * P < 0.05. (F) Comparison of the mobile fraction between OA pulse and pulse-chase conditions. The mobile fraction was derived by fitting each recovery curve to the equation y = C (1 - ekt), where C is equal to the asymptote of the curve i.e., the mobile fraction. N = 28 cells per condition, collected from three independent experiments. **** P < 0.0001. P values were calculated via the Wilcoxon rank-sum test. (G) Schematic illustrating interpretation of the results of the FRAP experiment. When APOE on the LD is bleached during the OA pulse, it recovers very rapidly with a high mobile fraction. This indicates that bleached APOE on the LD is rapidly exchanged for unbleached APOE. After a short washout, LD-associated APOE recovers slowly or not at all, indicating that unbleached APOE molecules are unable to replace bleached ones on the LD. We hypothesize LD-APOE exchanges with APOE on the cytoplasmic face of the ER via membrane bridges during OA loading. These bridges are reduced or lost after OA washout, preventing exchange of APOE between LDs and the ER.
Figure 4.
Figure 4.
The C-terminal domain is required for LD targeting of APOE. (A) Schematic of the APOE truncation constructs used in this experiment. (B) Western blot of lysates from TRAE3-H cell transfected with the indicated APOE truncation construct. Each construct was expressed and appeared at the expected molecular weight. Predicted molecular weights for each construct are as follows: FL: 63.94 kD, ΔSS FL: 62.03 kD, N: 51.83 kD, ΔSS N: 49.92 kD, C: 39.28 kD, C ΔSS: 37.36 kD. (C) Representative confocal slices of TRAE3-H cells transfected with the indicated construct, stained for LDs with BODIPY 665/676, and treated with 400 µM OA for 5 h. “O” denotes no enrichment of signal on the LD surface, “+” indicates partial enrichment, and “++” indicates full enrichment. (D) Quantification of LD targeting of each construct. The LD intensity ratio was calculated by dividing the mean mEm fluorescence intensity on LDs by the mean mEm fluorescence intensity of the rest of the cell. Letters indicate pairwise significance groups. Conditions denoted with the same letter have no statistically significant difference. N = 40 cells per condition. Each data point represents one cell. Data were collected and pooled from three independent experiments. P-values were calculated via Dunn’s Test for pairwise multiple comparisons. FL, full-length APOE. N-term., N-terminal domain of APOE. C-term., C-terminal domain of APOE. ΔSS, construct has the N-terminal signal peptide deleted. Source data are available for this figure: SourceData F4.
Figure 5.
Figure 5.
APOE modulates LD size distribution and triglyceride saturation. (A) Cartoon outlining the OA pulse-chase assay used in this figure, as well as Fig. 7. TRAE3-H cells are treated with 400 µM OA for 5 h to induce LD biogenesis. This is followed by a chase in unsupplemented complete media (CM) for 18 h, during which LDs are catabolized. Imaging and untargeted lipidomics were performed on cells at the baseline, OA pulse, and pulse-chase timepoints. (B) Representative TRAE3-H cells transfected with non-targeting (NT) or APOE (KD) siRNA, stained for LDs with BODIPY 493/503, and imaged live at each timepoint of the OA pulse-chase assay. Scale bar, 10 µm. (C–E) Quantification of LD parameters in NT or APOE KD cells at each timepoint of the OA pulse-chase assay. (C) Total LD area was measured as the area of the entire LD mask per cell in µm2. (D) Average LD size was calculated as the mean LD area per cell in µm2. (E) Number of LDs per cell. Each data point represents one cell, and each color represents data collected from a separate, independent experiment. N = 90 cells per genotype, timepoint, and independent experiment. ns P > 0.05, **** P < 0.0001. P values were calculated using a clustered Wilcox rank sum test via the Rosner–Glynn–Lee method and Bonferonni-corrected for multiple comparisons. (F) Comparison of total triglyceride between NT and APOE KD cells. Lipidomics data were collected from two independently performed experiments which each used three separate plates of cells as technical replicates. Each data point denotes a single technical replicate, and the dot colors indicate data collected from the same independently performed experiment. There is no significant difference in the abundance of triglyceride between NT and APOE KD at any timepoint. ns P > 0.05. P values were calculated using the Wilcox rank sum test and Bonferonni-corrected for multiple comparisons. (G) Heatmap showing the relative abundance of measured lipid classes at each timepoint of the assay. Heatmap values were derived from the means of three technical replicates from two independently performed experiments (shown as separate columns) for each condition. Means were then grouped by lipid class and Z-score normalized. ChE, cholesterol ester; PC, phosphatidyl choline; PI, phosphatidylinositol; PE, phosphatidyl ethanolamine; PG, phosphatidylglycerol; TG, triacylglycerol; DG, diacylglycerol. (H) Heatmap of the abundance of triglyceride species separated by their degree of unsaturation at each timepoint of the assay. Heatmap values were derived from the means of three technical replicates from two independently performed experiments (shown as separate columns) for each condition. Means were grouped by lipid class and Z-score normalized. The green box frames lipid species enriched in APOE KD.
Figure 6.
Figure 6.
LD-associated APOE modulates LD size. (A) Cartoon illustrating the conditions used in the APOE rescue experiment. Endogenous APOE3 protein is present in cells transfected with a non-targeting siRNA. APOE protein is depleted upon APOE knockdown. The siRNA used to knock down APOE targets the mRNA sequence encoding the N-terminal signal peptide. The RNAi-resistant full-length APOE (RR FL) rescue construct consists of APOE3 with synonymous mutations in the signal peptide that impart resistance to the APOE siRNA. The LD-only APOE construct has the signal sequence removed, making it insensitive to the APOE siRNA, and replaced with the hairpin domain of the LD protein GPAT4. This version of APOE only targets LDs and never enters the ER lumen. (B) Western blot of lysates of TRAE3-H cells transfected with the indicated siRNA and transduced with the indicated lentivirus. The same samples were run on two separate SDS-PAGE gels, with 10 µg of total protein loaded into each well. Gels were transferred and then blotted with anti-HA or an anti-APOE antibody together with an anti-tubulin antibody. Both the RR FL and LD-only APOE constructs were expressed in an endogenous APOE knockdown background. Moreover, the HA tag obstructs the epitope of the APOE antibody, allowing endogenous APOE and exogenous, HA-tagged APOE to be distinguished. (C) Representative confocal slices of cells transfected with non-targeting siRNA or APOE siRNA and transduced with an empty vector control, RR FL APOE, or LD-only APOE. Cells were subjected to an OA pulse-chase as described in Fig. 5A, fixed, and stained for LDs with BODIPY 493/503. Scale bar, 10 µm. (D–F) Quantification of LD parameters for the conditions described in A after an OA pulse-chase assay. (D) Total LD area was measured as the area of the entire LD mask per cell in µm2. (E) Average LD size was calculated as the mean LD area per cell in µm2. (F) Number of LDs per cell. Each data point represents one cell, and each color represents data collected from a separate, independent experiment. N = 60 cells per condition and independent experiment. ns P > 0.05, **** P < 0.0001. P values were calculated using a clustered Wilcox rank sum test via the Rosner–Glynn–Lee method and Bonferonni-corrected for multiple comparisons. Source data are available for this figure: SourceData F6.
Figure S4.
Figure S4.
Targeting to LDs is unaffected in APOE4. (A) Representative confocal images of TRAE3-H cells or TRAE4-H cells with or without 5 h of OA loading. Cells were fixed and stained for endogenous APOE with anti-APOE antibody and for LDs with BODIPY 493/503. In merged images, APOE is in green, and LDs are in magenta. Scale bars, 10 µm. CM, complete media. +OA, 400 µM OA for 5 h. (B) Percentage of TRAE3-H or TRAE4-H cells with APOE on the surface of LDs after 5 h of OA. Each data point is the percentage of cells from 10 random fields of view with APOE on LDs in one experiment. APOE localization to LDs was determined qualitatively. N = 3 biologically independent experiments with 50 cells per experiment. ns, P >0.05. P value was calculated using an unpaired, two-sample t test. (C) LD enrichment fraction of TRAE3-H or TRAE4-H cells treated with OA for 5 h. LD enrichment fraction was calculated as described in Fig. 1. N = 50 cells per condition and experiment. Each data point represents one cell, and each color represents data collected from a separate, independent experiment. These are the same cells used in B, but LD enrichment was measured using an unbiased quantitative method rather than being assessed qualitatively. ns, P > 0.05. P value was calculated using a clustered Wilcox rank sum test via the Rosner–Glynn–Lee method.
Figure 7.
Figure 7.
APOE4 promotes large LDs with highly unsaturated triglyceride and impaired turnover. (A) Representative confocal slices of TRAE3-H or TRAE4-H cells labeled for LDs with BODIPY 493/503 and imaged live at each timepoint of the OA pulse-chase assay described in Fig. 5 A. Scale bar, 10 µm. (B–D) Quantification of LD parameters in TRAE3-H or TRAE4-H cells at each timepoint of the OA pulse-chase assay. (B) Total LD area was measured as the area of the entire LD mask per cell in µm2. (C) Average LD size was calculated as the mean LD area per cell in µm2. (D) Number of LDs per cell. Each data point represents one cell, and each color represents data collected from a separate, independent experiment. N = 90 cells per genotype, timepoint, and independent experiment. ns P > 0.05, **** P < 0.0001. P values were calculated using a clustered Wilcox rank sum test via the Rosner-Glynn-Lee method and Bonferonni-corrected for multiple comparisons. (E) Comparison of total triglyceride between TRAE3-H and TRAE4-H cells. Lipidomics data were collected from two independently performed experiments, which each used three separate plates of cells as technical replicates. Each data point denotes a single technical replicate, and the dot colors (purple and yellow) indicate data collected from the same independently performed experiment. There is significantly more total triglyceride in E4 cells at the pulse-chase timepoint. * P < 0.05, ns P > 0.05. P values were calculated using the Wilcox rank sum test and Bonferonni-corrected for multiple comparisons. (F) Heatmap showing the relative abundance of measured lipid classes at each timepoint of the assay. Heatmap values are derived from the means of three technical replicates from two independently performed experiments (shown as separate columns) for each condition. Means were then grouped by lipid class and Z-score normalized. The green box frame lipid species that are enriched in E4, while the red box frames lipid species enriched in E3. PG, phosphatidylglycerol; ChE, cholesterol ester; PI, phosphatidylinositol; PC, phosphatidyl choline; PE, phosphatidyl ethanolamine; DG, diacylglycerol; TG, triacylglycerol. (G) Heatmap of the abundance of triglyceride species separated by their degree of unsaturation at each timepoint of the assay. Heatmap values were derived from the means of three technical replicates from two independently performed experiments (shown as separate columns) for each condition. Means were grouped by lipid class and Z-score normalized. The green box frames lipid species enriched in E4.
Figure S5.
Figure S5.
Untargeted lipidomics data of other lipid species from APOE knockdown and APOE3 versus APOE4 experiments. (A) Comparison of the total abundance of other major lipid classes between non-targeting (NT) and APOE knockdown (KD) cells at each timepoint. Lipidomics data were collected from two independently performed experiments which each used three separate plates of cells as technical replicates. Each data point denotes a single technical replicate, and the dot colors indicate data collected from the same independently performed experiment. There is no significant difference in the total abundance of any other major lipid classes between NT and APOE KD at any timepoint. ns P > 0.05. P values were calculated using the Wilcox rank sum test and Bonferonni-corrected for multiple comparisons. ChE, cholesterol ester; DG, diacylglycerol; PC, phosphatidyl choline; PE, phosphatidyl ethanolamine; PG, phosphatidylglycerol; PI, phosphatidylinositol. (B) Heatmap of the abundance of phosphatidylethanolamine (PE) species in NT versus APOE KD cells separated by their degree of unsaturation at each timepoint of the assay. Heatmap values are derived from the means of three technical replicates from two independently performed experiments (shown as separate columns) for each condition. Means were grouped by lipid class and Z-score normalized. (C) Comparison of the total abundance of other major lipid classes between APOE3 and APOE4 cells at each timepoint. Lipidomics data were collected from two independently performed experiments which each used three separate plates of cells as technical replicates. Each data point denotes a single technical replicate, and the dot colors indicate data collected from the same independently performed experiment. Other than TG, there is no significant difference in the total abundance of any major classes between E3 and E4 at any timepoint. (D) Heatmap of the abundance of PE species in E3 versus E4 cells separated by their degree of unsaturation at each timepoint of the assay. Heatmap values were derived from the means of three technical replicates from two independently performed experiments (shown as separate columns) for each condition. Means were grouped by lipid class and Z-score normalized. The red box frames lipid species enriched in E3.
Figure 8.
Figure 8.
APOE4 LDs are more sensitive to lipid peroxidation. (A) Schematic of a BODIPY C11-based assay for measuring the lipid peroxidation sensitivity of LDs. Cells are first subjected to an OA pulse-chase as described in Fig. 5 A, washed with HBSS, and then loaded with 2 µM BODIPY C11 in HBSS for 30 min. After 30 min, BODIPY C11-containing HBSS is replaced with C11-free HBSS, and cells are incubated for 2 h, during which time BODIPY C11 incorporates into LDs. Cells are then treated with 0.2% ethanol vehicle (EtOH) or 200 µM cumene hydroperoxide (CHP) for 2 h and subsequently imaged. (B) Representative confocal slices showing TRAE3-H or TRAE4-H cells labeled with BODIPY C11 and treated with either 0.2% EtOH or 200 µM cumene hydroperoxide as described in A. The magenta channel shows reduced BODIPY C11 fluorescence, and the green channel shows the fluorescence of BODIPY C11 oxidized by lipid peroxides. Scale bar, 10 µm. (C) Inset of B shows the difference in peroxidation of LDs between E3 and E4 cells. Scale bar, 1 µm. (D) Quantification of peroxidation in LDs in E3 or E4 cells treated with EtOH or CHP. The ratio was calculated by dividing the mean fluorescence intensity of green (oxidized) BODIPY C11 fluorescence in the LD mask divided by the mean intensity of red (reduced) BODIPY C11 fluorescence. ns P > 0.05, **** P < 0.0001. N = 50 cells per condition. Each data point represents one cell. Data were collected and pooled from three independent experiments. P values were calculated via the Wilcoxon rank-sum test and Bonferonni-corrected for multiple comparisons.
Figure 9.
Figure 9.
APOE targets cytoplasmic LDs via the ER and modulates LD composition and size. Schematic of our model of LD-associated APOE trafficking and function. (A) Normally, APOE is translocated into the lumen of the ER, where it assembles with nascent lipoprotein particles and is secreted. Under conditions that stimulate LD biogenesis, APOE subverts translocation via an unknown mechanism (retaining its signal peptide) and localizes to the cytoplasmic face of the ER membrane. It then moves onto LDs via membrane bridges between LDs and the ER. (B) On LDs, APOE is required to maintain triglyceride saturation and a dispersed LD size phenotype. In APOE4 cells, LDs are larger, accumulate highly unsaturated triglycerides, have impaired turnover, and are more sensitive to lipid peroxidation. We hypothesize that defects in the function of LD-associated APOE4 promote lipid dishomeostasis and sensitize astrocytes to stress, which could facilitate the progression of Alzheimer’s pathology.

Update of

Similar articles

Cited by

References

    1. Alzheimer, A. 1907. Über Eine eigenartige Erkrankung der Hirnrinde. Allgemeine Zeitschrift für Psychiatrie und psychisch-Gerichtliche Medizin. 64:146–148.
    1. Alzheimer, A., Stelzmann R.A., Schnitzlein H.N., and Murtagh F.R.. 1995. An English translation of Alzheimer’s 1907 paper, “Uber eine eigenartige Erkankung der Hirnrinde”. Clin. Anat. 8:429–431. 10.1002/ca.980080612 - DOI - PubMed
    1. Arbaizar-Rovirosa, M., Pedragosa J., Lozano J.J., Casal C., Pol A., Gallizioli M., and Planas A.M.. 2023. Aged lipid-laden microglia display impaired responses to stroke. EMBO Mol. Med. 15:e17175. 10.15252/emmm.202217175 - DOI - PMC - PubMed
    1. Astarita, G., Jung K.-M., Vasilevko V., Dipatrizio N.V., Martin S.K., Cribbs D.H., Head E., Cotman C.W., and Piomelli D.. 2011. Elevated stearoyl-CoA desaturase in brains of patients with Alzheimer’s disease. PLoS One. 6:e24777. 10.1371/journal.pone.0024777 - DOI - PMC - PubMed
    1. Bersuker, K., Peterson C.W.H., To M., Sahl S.J., Savikhin V., Grossman E.A., Nomura D.K., and Olzmann J.A.. 2018. A proximity labeling strategy provides insights into the composition and dynamics of lipid droplet proteomes. Dev. Cell. 44:97–112.e7. 10.1016/j.devcel.2017.11.020 - DOI - PMC - PubMed

Publication types

MeSH terms