. 2024 Feb 9;20(2):e1011535.
doi: 10.1371/journal.ppat.1011535. eCollection 2024 Feb.

SARS-CoV-2 Nsp1 cooperates with initiation factors EIF1 and 1A to selectively enhance translation of viral RNA

Affiliations

SARS-CoV-2 Nsp1 cooperates with initiation factors EIF1 and 1A to selectively enhance translation of viral RNA

Ranen Aviner et al. PLoS Pathog. .

Abstract

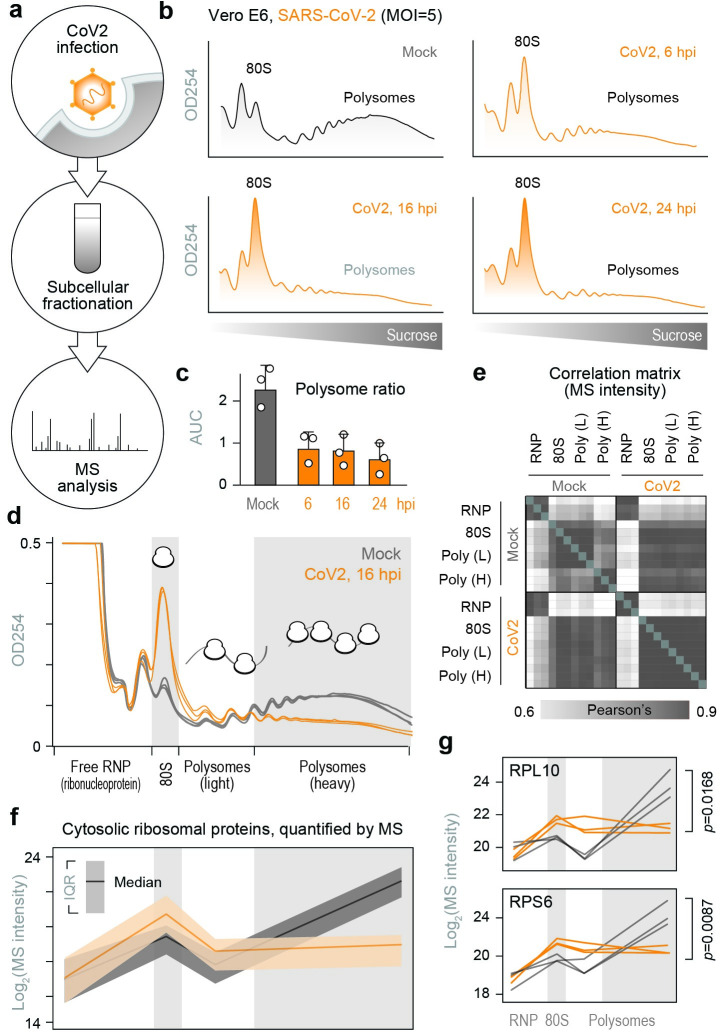
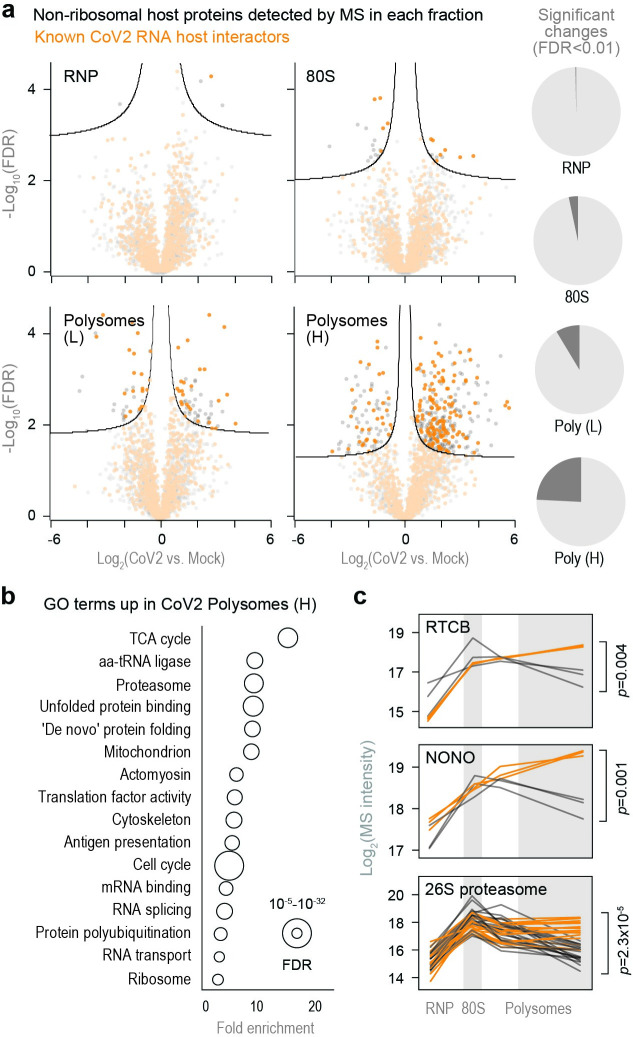
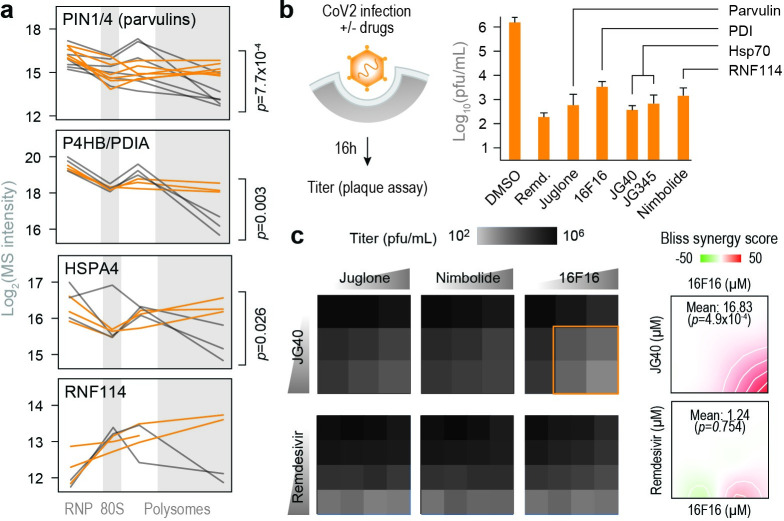
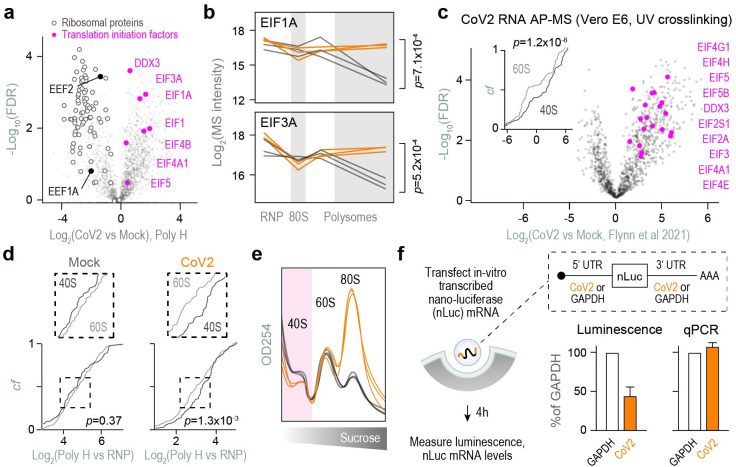
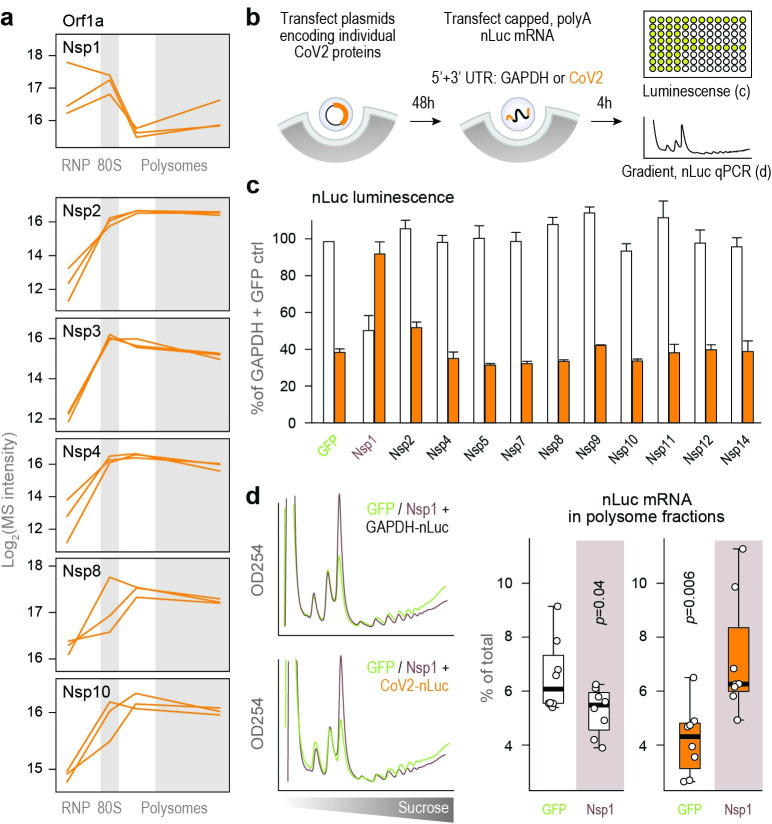
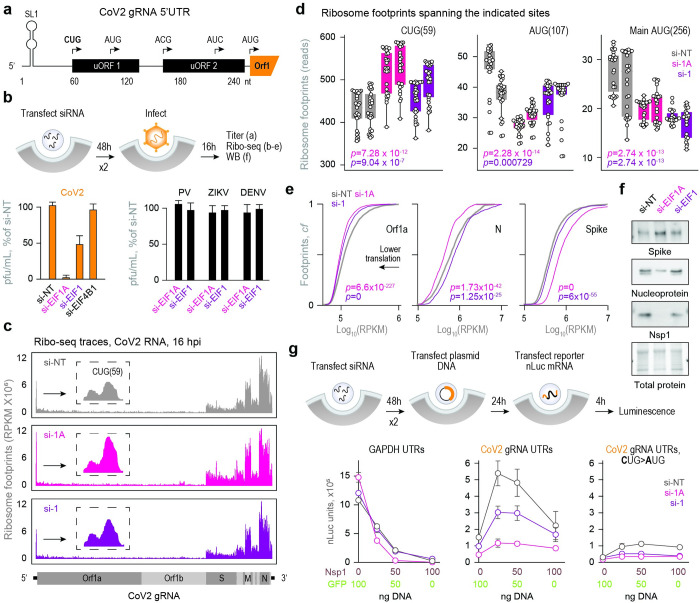
A better mechanistic understanding of virus-host dependencies can help reveal vulnerabilities and identify opportunities for therapeutic intervention. Of particular interest are essential interactions that enable production of viral proteins, as those could target an early step in the virus lifecycle. Here, we use subcellular proteomics, ribosome profiling analyses and reporter assays to detect changes in protein synthesis dynamics during SARS-CoV-2 (CoV2) infection. We identify specific translation factors and molecular chaperones that are used by CoV2 to promote the synthesis and maturation of its own proteins. These can be targeted to inhibit infection, without major toxicity to the host. We also find that CoV2 non-structural protein 1 (Nsp1) cooperates with initiation factors EIF1 and 1A to selectively enhance translation of viral RNA. When EIF1/1A are depleted, more ribosomes initiate translation from a conserved upstream CUG start codon found in all genomic and subgenomic viral RNAs. This results in higher translation of an upstream open reading frame (uORF1) and lower translation of the main ORF, altering the stoichiometry of viral proteins and attenuating infection. Replacing the upstream CUG with AUG strongly inhibits translation of the main ORF independently of Nsp1, EIF1, or EIF1A. Taken together, our work describes multiple dependencies of CoV2 on host biosynthetic networks and proposes a model for dosage control of viral proteins through Nsp1-mediated control of translation start site selection.


Conflict of interest statement

The authors have declared that no competing interests exist.

Figures

Fig 1
Fig 1. Subcellular proteomics of CoV2 infected cells.
(a) To identify host biosynthetic networks involved in CoV2 infection, we infected Vero cells with SARS-CoV-2 USA/WA1/2020 at MOI = 5, lysed them, fixed the clarified lysates with formaldehyde and fractionated on 10–50% sucrose gradients. Crosslinking was reversed and protein content was analyzed by liquid chromatography tandem mass-spectrometry (LC-MS/MS). (b-c) Global protein synthesis is persistently attenuated during infection. Cells infected as above were lysed, fixed with formaldehyde and fractionated on 10–50% sucrose gradients with continuous monitoring of rRNA absorbance (b). Ratio of polysomes to sub-polysomes, calculated as the area under the curve (AUC) of relevant fractions. Shown are means±SD of 3 independent replicates (c). (d) Cells were infected and fractionated as above, in triplicates, and protein content was extracted from fractions containing free small (40S) and large (60S) ribosomal subunits (free RNP); 80S monosomes; and two polysome fractions (“Light” and “Heavy”). Each line reflects a single replicate, and fractions pooled for MS are indicated at bottom. (e) Correlation matrix of all host proteins identified by MS in each of the pooled fractions from either CoV2-infected or control cells. (f) Median and interquartile range (IQR) of all cytosolic ribosomal proteins quantified by MS in each pooled fraction from all 3 replicates. (g) Line plots of individual ribosomal proteins quantified by MS in each pooled fraction. Each line represents a single replicate. P, two-tailed Student’s t-test p-value of differences in indicated protein abundance in heavy polysome fractions.
Fig 2
Fig 2. CoV2 infection remodels host biosynthetic complexes.
(a) Pairwise comparisons of differences in individual protein abundance upon CoV2 infection of Vero cells, in each pooled fraction, as quantified by MS. Right, proportion of proteins showing statistically significant differences (FDR<0.05, S0 = 0.1) between infected and control cells. (b) Gene Ontology terms enriched in heavy polysome fractions from infected versus control cells. (c) Line plots of individual proteins quantified by MS in each fraction. Each line represents a single replicate. P, two-tailed Student’s t-test p-value.
Fig 3
Fig 3. Remodeling of biosynthetic complexes reveals druggable host targets for antiviral therapies.
(a) Line plots of individual proteostasis factors quantified by MS in each fraction. Each line represents a single replicate. P, two-tailed Student’s t-test p-value. (b) Cells were infected with CoV2 at MOI = 0.5. Drugs were added at the start of infection, and titers were determined by plaque assays at 16 hours post-infection. Shown are means±SD of 3 independent replicates. Remdesivir, 5 μM; Juglone, 4 μM; 16F16, 2 μM; JG40, 5 μM; JG345, 5 μM; Nimbolide, 1 μM. (c) Cells were infected as above and treated with the indicated drug combinations. JG40, 0, 2.5, 5 μM; Remdesivir, 0, 2.5, 5, 10 μM; Juglone, 0, 0.25, 0.5, 1 μM; Nimbolide, 0, 0.25, 0.5, 1 μM; 16F16 0, 1, 2, 4 μM. Heatmaps (left) show means of 3 independent replicates. Bliss synergy plots (right) report on combination treatment with 16F16 and either JG40 or remdesivir. Higher values indicate synergistic effects.
Fig 4
Fig 4. Translation initiation on CoV2 gRNA is non-optimal.
(a) Pairwise comparisons of individual protein abundance in the heavy polysome fractions. Ribosomal proteins and translation elongation factors are depleted, whereas translation initiation factors are enriched. (b) Line plots of individual translation initiation factors quantified by MS in each fraction. Each line represents a single replicate. P, two-tailed Student’s t-test p-value. (c) Translation initiation factors are highly represented in the CoV2 RNA interactome. Shown are pairwise comparisons of individual host protein abundance, quantified by MS, that specifically interact with either genomic or subgenomic CoV2 RNA during infection. Inset, cumulative distribution plots of 40S and 60S ribosomal protein interaction with CoV2 RNA. P, Mann-Whitney p-value. (d) Heavy polysome fractions contain more 40S ribosomal proteins in infected cells. Shown are cumulative distribution plots of 40S and 60S ribosomal proteins in heavy polysome fractions from infected and uninfected cells, across three replicates. P, Mann-Whitney p-value. (e) rRNA absorbance profiles from Fig 1D, showing lower abundance of free 40S subunits during CoV2 infection. (f) Translation initiation from CoV2 5’ untranslated region (UTR) is less efficient than GAPDH 5’UTR. mRNA encoding for nano-luciferase (nLuc) flanked by 5’ and 3’UTRs of either CoV2 (orange) or GAPDH (white) was transcribed in vitro, capped/polyadenylated, and transfected into Vero cells. At 4 hours post-transfection, luminescence was measured in parallel with qPCR using oligonucleotides specific to nLuc. Shown are means±SD of 3 independent replicates.
Fig 5
Fig 5. Nsp1 promotes translation initiation on CoV2 gRNA.
(a) Line plots of individual viral proteins quantified by MS in each fraction. Each line represents a single replicate. (b) Vero cells were transfected with plasmids encoding for individual CoV2 proteins. At 48 hours post-transfection, cells were transfected with nLuc mRNA flanked by either CoV2 (orange) or GAPDH (white) UTRs. At 4 hours post-second transfection, cells were subjected to either luminescence measurements or sucrose gradients coupled to qPCR of nLuc mRNA. (c) nLuc luminescence. Shown are means±SD of 3 independent replicates. (d) Cells transfected, as above, with either GFP or Nsp1 followed by GAPDH-nLuc or CoV2-nLuc mRNA, were lysed and fractionated on 10–50% sucrose gradients with continuous monitoring of rRNA. The content of nLuc mRNA in each fraction was determined by qPCR. Left, rRNA absorbance profiles. Right, percent of GAPDH-nLuc or CoV2-nLuc mRNA found in polysome fractions of sucrose gradients. Shown are qPCR measurements of 4 polysome fractions from 2 independent gradients. P, two-tailed Student’s t-test p-value.
Fig 6
Fig 6. Nsp1 promotes accurate start codon usage through EIF1/1A.
(a) Diagram of elements in CoV2 gRNA 5’UTR involved in translation. SL1, stem-loop 1. uORF1 and uORF2 can both be translated from two different start codons. (b) Vero cells were transfected with siRNAs targeting initiation factors 1A, 1, and 4B, compared to non-targeting (NT) controls. At 48h the same transfection was repeated. At 48h after the second transfection, cells were infected with either CoV2 (orange, left) polio (PV), Zika (ZIKV) or dengue (DENV) viruses (black, right) at MOI = 0.5. Viral titers were determined by plaque assays. Shown are means±SD of 4 independent replicates. (c) Vero cells were transfected with siRNA as above, infected with CoV2 at MOI = 5, and subjected to ribosome profiling analysis at 16 hpi. Traces show ribosome footprints on CoV2 RNA. Insets, ribosome footprints on nucleotides 20–80 of the gRNA. Representative of 2 independent replicates. (d) Ribosome footprints spanning 13 nt upstream and 12 nt downstream of the indicated start codons. Each bar represents a single biological replicate. P, Wilcoxon ranked-sum p-value. (e) Cumulative fraction plots of ribosome footprints on Orf1a, Spike and Nucleocapsid (N) open reading frames. Combined analysis of two independent replicates. P, Wilcoxon ranked-sum p-value. A shift of the curve to the left reflects lower ribosome occupancy and therefore lower translation. (f) Vero cells transfected with siRNA and infected as in (b) were subjected to immunoblot analysis of whole cell lysates using antibodies against CoV2 Spike, Nucleoprotein and Nsp1. Shown are representative blots of 4 independent repeats. (g) Vero cells were transfected with siRNA as above, followed by combined plasmid transfections of GFP and Nsp1 at the indicated amounts. The same total amount of DNA was used for each transfection. At 24 hours, cells were transfected again with nLuc mRNA flanked by UTRs from either GAPDH (left panel), CoV2 gRNA (middle panel) or CoV2 gRNA with CUG(59) mutated to AUG (right panel). At 4 hours post-second transfection, cells were subjected to luminescence measurements. Shown are means±SD of 3 independent replicates.

Similar articles

Cited by

References

    1. Rozman B, Fisher T, Stern-Ginossar N. Translation—A tug of war during viral infection. Mol Cell. 2022. doi: 10.1016/j.molcel.2022.10.012 - DOI - PubMed
    1. Aviner R, Frydman J. Proteostasis in Viral Infection: Unfolding the Complex Virus–Chaperone Interplay. Cold Spring Harb Perspect Biol. 2020;12: a034090. doi: 10.1101/cshperspect.a034090 - DOI - PMC - PubMed
    1. Gordon DE, Jang GM, Bouhaddou M, Xu J, Obernier K, White KM, et al.. A SARS-CoV-2 protein interaction map reveals targets for drug repurposing. Nature. 2020;583: 459–468. doi: 10.1038/s41586-020-2286-9 - DOI - PMC - PubMed
    1. White KM, Rosales R, Yildiz S, Kehrer T, Miorin L, Moreno E, et al.. Plitidepsin has potent preclinical efficacy against SARS-CoV-2 by targeting the host protein eEF1A. Science (80-). 2021;371: 926–931. doi: 10.1126/science.abf4058 - DOI - PMC - PubMed
    1. Aviner R, Li KH, Frydman J, Andino R. Cotranslational prolyl hydroxylation is essential for flavivirus biogenesis. Nature. 2021;596: 558–564. doi: 10.1038/s41586-021-03851-2 - DOI - PMC - PubMed