. 2024 May 2;84(9):1410-1425.
doi: 10.1158/0008-5472.CAN-23-1183.

Single-Cell Analysis Identifies NOTCH3-Mediated Interactions between Stromal Cells That Promote Microenvironment Remodeling and Invasion in Lung Adenocarcinoma

Affiliations

Single-Cell Analysis Identifies NOTCH3-Mediated Interactions between Stromal Cells That Promote Microenvironment Remodeling and Invasion in Lung Adenocarcinoma

Handan Xiang et al. Cancer Res. .

Abstract

Cancer immunotherapy has revolutionized the treatment of lung adenocarcinoma (LUAD); however, a significant proportion of patients do not respond. Recent transcriptomic studies to understand determinants of immunotherapy response have pinpointed stromal-mediated resistance mechanisms. To gain a better understanding of stromal biology at the cellular and molecular level in LUAD, we performed single-cell RNA sequencing of 256,379 cells, including 13,857 mesenchymal cells, from 9 treatment-naïve patients. Among the mesenchymal cell subsets, FAP+PDPN+ cancer-associated fibroblasts (CAF) and ACTA2+MCAM+ pericytes were enriched in tumors and differentiated from lung-resident fibroblasts. Imaging mass cytometry revealed that both subsets were topographically adjacent to the perivascular niche and had close spatial interactions with endothelial cells (EC). Modeling of ligand and receptor interactomes between mesenchymal and ECs identified that NOTCH signaling drives these cell-to-cell interactions in tumors, with pericytes and CAFs as the signal receivers and arterial and PLVAPhigh immature neovascular ECs as the signal senders. Either pharmacologically blocking NOTCH signaling or genetically depleting NOTCH3 levels in mesenchymal cells significantly reduced collagen production and suppressed cell invasion. Bulk RNA sequencing data demonstrated that NOTCH3 expression correlated with poor survival in stroma-rich patients and that a T cell-inflamed gene signature only predicted survival in patients with low NOTCH3. Collectively, this study provides valuable insights into the role of NOTCH3 in regulating tumor stroma biology, warranting further studies to elucidate the clinical implications of targeting NOTCH3 signaling.

Significance: NOTCH3 signaling activates tumor-associated mesenchymal cells, increases collagen production, and augments cell invasion in lung adenocarcinoma, suggesting its critical role in remodeling tumor stroma.


Figures

None
Graphical abstract
Figure 1. A, Overview of the study design and analytic framework. B, UMAP of cells from 9 donors colored by cell types. Top right, cells in ANT tissues; bottom right, cells in tumors (T). Annotations for each cluster were identified by canonical markers. C, Dot plot of the average expression of selected canonical markers used for cluster annotation.
Figure 1.
A, Overview of the study design and analytic framework. B, UMAP of cells from 9 donors colored by cell types. Top right, cells in ANT tissues; bottom right, cells in tumors (T). Annotations for each cluster were identified by canonical markers. C, Dot plot of the average expression of selected canonical markers used for cluster annotation.
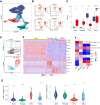
Figure 2. A, UMAPs of mesenchymal cells colored by subclusters. B, UMAPs color-coded by the relative expression of marker genes used for subcluster annotation. C, Boxplot visualizing the relative fractions of each mesenchymal subcluster to all mesenchymal populations in T (red) and ANT (blue). The statistical significance was determined using a Wilcoxon rank-sum test. D, Representative flow cytometry plots of EPCAM−, CD45−, CD31− mesenchymal cells from the MRC008 tumor stained for FAP and MCAM (top) and FAP and PDPN (bottom). E, Heat map visualizing the relative expression of differentially expressed genes among the four mesenchymal subtypes. Expression of each gene is normalized by rows. Columns are grouped by cluster annotation of each cell. F, Heat map visualizing the correlation between the average expression of mesenchymal subset fingerprints (columns) and expression of canonical marker genes or established signatures (rows) in the LUAD samples of the Collaboration dataset. G, Violin plots visualizing the differential expression of CAF subset fingerprints among the four mesenchymal subtypes. Left, iCAF; right, myCAF. **, P < 0.01; ***, P < 0.001; ****, P < 0.0001.
Figure 2.
A, UMAPs of mesenchymal cells colored by subclusters. B, UMAPs color-coded by the relative expression of marker genes used for subcluster annotation. C, Boxplot visualizing the relative fractions of each mesenchymal subcluster to all mesenchymal populations in T (red) and ANT (blue). The statistical significance was determined using a Wilcoxon rank-sum test. D, Representative flow cytometry plots of EPCAM, CD45, CD31 mesenchymal cells from the MRC008 tumor stained for FAP and MCAM (top) and FAP and PDPN (bottom). E, Heat map visualizing the relative expression of differentially expressed genes among the four mesenchymal subtypes. Expression of each gene is normalized by rows. Columns are grouped by cluster annotation of each cell. F, Heat map visualizing the correlation between the average expression of mesenchymal subset fingerprints (columns) and expression of canonical marker genes or established signatures (rows) in the LUAD samples of the Collaboration dataset. G, Violin plots visualizing the differential expression of CAF subset fingerprints among the four mesenchymal subtypes. Left, iCAF; right, myCAF. **, P < 0.01; ***, P < 0.001; ****, P < 0.0001.
Figure 3. A, Representative images of the hematoxylin and eosin (H&E), TTF-1, and p63 IHC staining of an LSCC sample. Scale bar, 100 μm. One hematoxylin and eosin staining was done per tumor cross section. B, Representative IMC images of a LUAD sample stained with indicated antibodies. Scale bar, 100 μm. C, IMC image with a cell segmentation mask as indicated by cell segmentation lines. D, Cell phenotypes from 7 LUAD samples shown in the heat map were determined by normalized median epitome expression of stained antibodies. E, Waterfall plots showing the percentage of images, in which each cluster significantly interacts or avoids interactions with cluster 8, 7, or 16. Significance was determined by a permutation test (P < 0.01). Numbers on top of each bar indicate the exact value of percentage of significant images.
Figure 3.
A, Representative images of the hematoxylin and eosin (H&E), TTF-1, and p63 IHC staining of an LSCC sample. Scale bar, 100 μm. One hematoxylin and eosin staining was done per tumor cross section. B, Representative IMC images of a LUAD sample stained with indicated antibodies. Scale bar, 100 μm. C, IMC image with a cell segmentation mask as indicated by cell segmentation lines. D, Cell phenotypes from 7 LUAD samples shown in the heat map were determined by normalized median epitome expression of stained antibodies. E, Waterfall plots showing the percentage of images, in which each cluster significantly interacts or avoids interactions with cluster 8, 7, or 16. Significance was determined by a permutation test (P < 0.01). Numbers on top of each bar indicate the exact value of percentage of significant images.
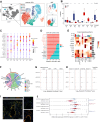
Figure 4. A, Left, UMAP highlighting lymphatic ECs and vascular ECs. Middle, vascular ECs colored by cell subclusters. Top right, cells in ANT tissues; bottom right, cells in T tissues. B, Boxplot visualizing the relative fractions of each endothelial subcluster to all vascular EC populations in T (red) and ANT (blue). The statistical significance was calculated using a Wilcoxon rank-sum test. C, The average expression of marker genes used for EC subcluster labeling. D, Bar chart visualizing significant cell–cell contact signaling pathways between mesenchymal cells and ECs generated using CellChat, where the relative strength in T was colored in red and ANT was in green, and labels were colored in red if the signal was significantly enriched in T comparing to ANT, or green if significantly enriched in ANT. The pathways are ranked on the basis of their differences of relative information flow between T and ANT. E, Heat map visualizing the relative signaling strengths of significant T-enriched pathways in D among endothelial and mesenchymal cells generated using CellChat. The top bar plot represents the total signaling strength of all displayed signaling pathway in each cell group. The right gray bar plot shows the total signaling strength of all displayed cell groups in each signaling pathway. F, Chord diagram visualizing the information flow strength of NOTCH signaling pathway from ECs to mesenchymal cells. The chords were color-coded by the signal senders or receivers of represented ligand–receptor pairs. NOTCH3 expressed by pericytes is shown to be the dominant receptor. G, Forest plot visualizing the significances of NOTCH pathway receptor expression enrichment in mesenchymal cells among leave-one-donor-out iterations. The interquartile range of Benjamini–Hochberg Padj values is shown. If there was no significant enrichment between T and NAT before removing any donors, the data points would be omitted. The red dash lines represent P = 0.05. H, Forest plots visualizing the significances of NOTCH pathway ligands expression enrichment in ECs among leave-one-donor-out iterations. I, Immunofluorescent imaging of a tumor sample from the scRNA-seq cohort. NOTCH3 staining, green; MCAM staining, orange; DAPI nuclei staining, blue. Scale bar, 100 μm. White arrow, MCAM+NOTCH3+ cells. J, Boxplots showing the log10 expression of NOTCH receptor genes between T and ANT LUAD samples in TCGA. For genes with significantly different expression between T and ANT (Wilcoxon rank sum test, Benjamini–Hochberg Padj < 0.05), the receiver operating characteristic – area under the curve (ROC-AUC) values were calculated and are in red (T-enriched) or green (ANT-enriched). *, P < 0.05; **, P < 0.01; ***, P < 0.001.
Figure 4.
A, Left, UMAP highlighting lymphatic ECs and vascular ECs. Middle, vascular ECs colored by cell subclusters. Top right, cells in ANT tissues; bottom right, cells in T tissues. B, Boxplot visualizing the relative fractions of each endothelial subcluster to all vascular EC populations in T (red) and ANT (blue). The statistical significance was calculated using a Wilcoxon rank-sum test. C, The average expression of marker genes used for EC subcluster labeling. D, Bar chart visualizing significant cell–cell contact signaling pathways between mesenchymal cells and ECs generated using CellChat, where the relative strength in T was colored in red and ANT was in green, and labels were colored in red if the signal was significantly enriched in T comparing to ANT, or green if significantly enriched in ANT. The pathways are ranked on the basis of their differences of relative information flow between T and ANT. E, Heat map visualizing the relative signaling strengths of significant T-enriched pathways in D among endothelial and mesenchymal cells generated using CellChat. The top bar plot represents the total signaling strength of all displayed signaling pathway in each cell group. The right gray bar plot shows the total signaling strength of all displayed cell groups in each signaling pathway. F, Chord diagram visualizing the information flow strength of NOTCH signaling pathway from ECs to mesenchymal cells. The chords were color-coded by the signal senders or receivers of represented ligand–receptor pairs. NOTCH3 expressed by pericytes is shown to be the dominant receptor. G, Forest plot visualizing the significances of NOTCH pathway receptor expression enrichment in mesenchymal cells among leave-one-donor-out iterations. The interquartile range of Benjamini–Hochberg Padj values is shown. If there was no significant enrichment between T and NAT before removing any donors, the data points would be omitted. The red dash lines represent P = 0.05. H, Forest plots visualizing the significances of NOTCH pathway ligands expression enrichment in ECs among leave-one-donor-out iterations. I, Immunofluorescent imaging of a tumor sample from the scRNA-seq cohort. NOTCH3 staining, green; MCAM staining, orange; DAPI nuclei staining, blue. Scale bar, 100 μm. White arrow, MCAM+NOTCH3+ cells. J, Boxplots showing the log10 expression of NOTCH receptor genes between T and ANT LUAD samples in TCGA. For genes with significantly different expression between T and ANT (Wilcoxon rank sum test, Benjamini–Hochberg Padj < 0.05), the receiver operating characteristic – area under the curve (ROC-AUC) values were calculated and are in red (T-enriched) or green (ANT-enriched). *, P < 0.05; **, P < 0.01; ***, P < 0.001.
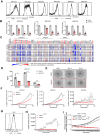
Figure 5. A, Flow cytometry plots of in vitro expanded mesenchymal cells from MRC002, 003, and 004 tumor samples stained with NOTCH3 and MCAM antibodies. Black line, antibody staining; gray line, fluorescence minus one (FMO) control. B, Relative fold changes of NOTCH pathway downstream targets in DMSO or 1 μmol/L MRK003-treated mesenchymal and endothelial cell cocultures. Paired t test was used to calculate P value. C, Heatmap of the log2-fold changes of genes encoding extracellular matrix or adhesion molecules in DMSO or 1 μmol/L MRK003-treated mesenchymal and endothelial cell cocultures from three donors. Paired t test was used to calculate P value. Red font genes, significant increases or decreases in MRK003-treated groups in at least two donors. Gray, undetectable transcripts. D, The concentration of COL1A1 in supernatants collected from DMSO or 1 μmol/L MRK003-treated mesenchymal and endothelial cell cocultures. E, Representative images of mesenchymal cell invasion in DMSO or 10 μmol/L MRK003-treated groups. F, Quantification of the largest invading area of mesenchymal cells derived from MRC002, 003, and 004 tumor samples in DMSO or 10 μmol/L MRK003-treated groups over 136 hours. Two-way ANOVA was used to calculate P value. G, Flow cytometry plot of D4A1 mesenchymal cells stained with a NOTCH3 antibody. Black line, antibody staining; gray line, fluorescence minus one control. H, Quantification of the largest invading area of D4A1 mesenchymal cells in DMSO or 10 μmol/L MRK003-treated groups over 136 hours. Two-way ANOVA was used to calculate P value. I, Quantification of integrated red intensity, representing tumor invasion signals, in largest invading areas in DMSO or 10 μmol/L MRK003-treated groups over 136 hours in H1299 and D4A1 coculture spheroids. Two-way ANOVA was used to calculate P value. At least three biological replicates were performed for each experiment. *, P < 0.05; **, P < 0.01; ***, P < 0.001; ****, P < 0.0001; n.s., not statistically significant.
Figure 5.
A, Flow cytometry plots of in vitro expanded mesenchymal cells from MRC002, 003, and 004 tumor samples stained with NOTCH3 and MCAM antibodies. Black line, antibody staining; gray line, fluorescence minus one (FMO) control. B, Relative fold changes of NOTCH pathway downstream targets in DMSO or 1 μmol/L MRK003-treated mesenchymal and endothelial cell cocultures. Paired t test was used to calculate P value. C, Heatmap of the log2-fold changes of genes encoding extracellular matrix or adhesion molecules in DMSO or 1 μmol/L MRK003-treated mesenchymal and endothelial cell cocultures from three donors. Paired t test was used to calculate P value. Red font genes, significant increases or decreases in MRK003-treated groups in at least two donors. Gray, undetectable transcripts. D, The concentration of COL1A1 in supernatants collected from DMSO or 1 μmol/L MRK003-treated mesenchymal and endothelial cell cocultures. E, Representative images of mesenchymal cell invasion in DMSO or 10 μmol/L MRK003-treated groups. F, Quantification of the largest invading area of mesenchymal cells derived from MRC002, 003, and 004 tumor samples in DMSO or 10 μmol/L MRK003-treated groups over 136 hours. Two-way ANOVA was used to calculate P value. G, Flow cytometry plot of D4A1 mesenchymal cells stained with a NOTCH3 antibody. Black line, antibody staining; gray line, fluorescence minus one control. H, Quantification of the largest invading area of D4A1 mesenchymal cells in DMSO or 10 μmol/L MRK003-treated groups over 136 hours. Two-way ANOVA was used to calculate P value. I, Quantification of integrated red intensity, representing tumor invasion signals, in largest invading areas in DMSO or 10 μmol/L MRK003-treated groups over 136 hours in H1299 and D4A1 coculture spheroids. Two-way ANOVA was used to calculate P value. At least three biological replicates were performed for each experiment. *, P < 0.05; **, P < 0.01; ***, P < 0.001; ****, P < 0.0001; n.s., not statistically significant.
Figure 6. A, Spearman correlation between global genes and NOTCH3 expression in the TCGA LUAD tumor dataset (x-axis) and collaboration LUAD tumor dataset (y-axis). NOTCH3 and COL1A1 are highlighted in red. The legend presents the correlation value of gene COL1A1 with NOTCH3 expression: 0.50 for TCGA dataset and 0.46 for Collaboration dataset. B, Dot plots of top 10 pathways enriched in KEGG or GeneGo pathways using genes with NOTCH3 correlations over 0.4(d). Colors indicate P values; sizes of the dots indicate overlap gene counts in the pathways. C–E, Cox proportional hazards analysis showing the predictivity of NOTCH genes in LUAD samples under different stromal level conditions. Genes with significant predictivities (P < 0.05) were color-coded by their HR value. Red, poor prognosis; blue, better prognosis. Black dots, nonsignificant genes. F and G, The Kaplan–Meier survival analysis depicting the prognostic value of GEP expression levels in NOTCH3- high (F) and NOTCH3-low (G) LUAD samples. A total of 1,434 LUAD samples with corresponding overall survival (OS) data in the Collaboration dataset were evenly divided into two groups by NOTCH3 expression level. HRs were derived from a Cox proportional model fit; no multiple testing. The predictivity of GEP was only sufficient in NOTCH3-low samples. H, Spearman correlation between NOTCH3 and consensus gene signatures, added to the global gene correlation, in the TCGA LUAD tumor dataset (x-axis) and Collaboration LUAD tumor dataset (y-axis). The legend shows the correlation values, with the first value representing the TCGA dataset and the second value representing the Collaboration dataset. I, Graph illustration of the interaction between mesenchymal and ECs via the NOTCH pathway in the TME. The interaction activates mesenchymal cells and leads to collagen deposition and cell invasion. (I, Created with BioRender.com.)
Figure 6.
A, Spearman correlation between global genes and NOTCH3 expression in the TCGA LUAD tumor dataset (x-axis) and collaboration LUAD tumor dataset (y-axis). NOTCH3 and COL1A1 are highlighted in red. The legend presents the correlation value of gene COL1A1 with NOTCH3 expression: 0.50 for TCGA dataset and 0.46 for Collaboration dataset. B, Dot plots of top 10 pathways enriched in KEGG or GeneGo pathways using genes with NOTCH3 correlations over 0.4(d). Colors indicate P values; sizes of the dots indicate overlap gene counts in the pathways. CE, Cox proportional hazards analysis showing the predictivity of NOTCH genes in LUAD samples under different stromal level conditions. Genes with significant predictivities (P < 0.05) were color-coded by their HR value. Red, poor prognosis; blue, better prognosis. Black dots, nonsignificant genes. F and G, The Kaplan–Meier survival analysis depicting the prognostic value of GEP expression levels in NOTCH3- high (F) and NOTCH3-low (G) LUAD samples. A total of 1,434 LUAD samples with corresponding overall survival (OS) data in the Collaboration dataset were evenly divided into two groups by NOTCH3 expression level. HRs were derived from a Cox proportional model fit; no multiple testing. The predictivity of GEP was only sufficient in NOTCH3-low samples. H, Spearman correlation between NOTCH3 and consensus gene signatures, added to the global gene correlation, in the TCGA LUAD tumor dataset (x-axis) and Collaboration LUAD tumor dataset (y-axis). The legend shows the correlation values, with the first value representing the TCGA dataset and the second value representing the Collaboration dataset. I, Graph illustration of the interaction between mesenchymal and ECs via the NOTCH pathway in the TME. The interaction activates mesenchymal cells and leads to collagen deposition and cell invasion. (I, Created with BioRender.com.)

References

    1. Myers DJ, Wallen JM. Lung adenocarcinoma. StatPearls. Treasure Island, FL;2023.
    1. Onoi K, Chihara Y, Uchino J, Shimamoto T, Morimoto Y, Iwasaku M, et al. . Immune checkpoint inhibitors for lung cancer treatment: a review. J Clin Med 2020;9:1362. - PMC - PubMed
    1. Cristescu R, Nebozhyn M, Zhang C, Albright A, Kobie J, Huang L, et al. . Transcriptomic determinants of response to pembrolizumab monotherapy across solid tumor types. Clin Cancer Res 2022;28:1680–9. - PMC - PubMed
    1. Mariathasan S, Turley SJ, Nickles D, Castiglioni A, Yuen K, Wang Y, et al. . TGFbeta attenuates tumour response to PD-L1 blockade by contributing to exclusion of T cells. Nature 2018;554:544–8. - PMC - PubMed
    1. Elyada E, Bolisetty M, Laise P, Flynn WF, Courtois ET, Burkhart RA, et al. . Cross-species single-cell analysis of pancreatic ductal adenocarcinoma reveals antigen-presenting cancer-associated fibroblasts. Cancer Discov 2019;9:1102–23. - PMC - PubMed

Publication types

MeSH terms