. 2024 Apr:70:103073.
doi: 10.1016/j.redox.2024.103073. Epub 2024 Feb 2.

Hypoxia causes trophoblast cell ferroptosis to induce miscarriage through lnc-HZ06/HIF1α-SUMO/NCOA4 axis

Affiliations

Hypoxia causes trophoblast cell ferroptosis to induce miscarriage through lnc-HZ06/HIF1α-SUMO/NCOA4 axis

Peng Tian et al. Redox Biol. 2024 Apr.

Abstract

Defects of human trophoblast cells may induce miscarriage (abnormal early embryo loss), which is generally regulated by lncRNAs. Ferroptosis is a newly identified iron-dependent programmed cell death. Hypoxia is an important and unavoidable feature in mammalian cells. However, whether hypoxia might induce trophoblast cell ferroptosis and then induce miscarriage, as well as regulated by a lncRNA, was completely unknown. In this work, we discovered at the first time that hypoxia could result in ferroptosis of human trophoblast cells and then induce miscarriage. We also identified a novel lncRNA (lnc-HZ06) that simultaneously regulated hypoxia (indicated by HIF1α protein), ferroptosis, and miscarriage. In mechanism, HIF1α-SUMO, instead of HIF1α itself, primarily acted as a transcription factor to promote the transcription of NCOA4 (ferroptosis indicator) in hypoxic trophoblast cells. Lnc-HZ06 promoted the SUMOylation of HIF1α by suppressing SENP1-mediated deSUMOylation. HIF1α-SUMO also acted as a transcription factor to promote lnc-HZ06 transcription. Thus, both lnc-HZ06 and HIF1α-SUMO formed a positive auto-regulatory feedback loop. This loop was up-regulated in hypoxic trophoblast cells, in RM villous tissues, and in placental tissues of hypoxia-treated mice, which further induced ferroptosis and miscarriage by up-regulating HIF1α-SUMO-mediated NCOA4 transcription. Furthermore, knockdown of either murine lnc-hz06 or Ncoa4 could efficiently suppress ferroptosis and alleviate miscarriage in hypoxic mouse model. Taken together, this study provided new insights in understanding the regulatory roles of lnc-HZ06/HIF1α-SUMO/NCOA4 axis among hypoxia, ferroptosis, and miscarriage, and also offered an effective approach for treatment against miscarriage.

Keywords: Hypoxia; LncRNA or lnc-HZ06; Recurrent miscarriage; SUMOylated HIF1α and NCOA4; Trophoblast cell ferroptosis.


Conflict of interest statement

Declaration of competing interest None.

Figures

Fig. 1
Fig. 1
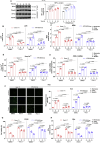
Higher levels of hypoxia and ferroptosis in unexplained RM vs HC villous tissues. (A) Western blot analysis of the protein levels of HOXA10, HIF1α, GPX4, and Ferritin in unexplained RM and HC villous tissues (n = 30), with Actin as internal standard. (B, D, F, G) The relative expression levels of each protein band were quantified and plotted in both RM and HC groups. (C) IHC analysis and relative quantification of HIF1α protein levels (brown color) in HC and unexplained RM villous tissues (n = 5). (E) Person correlation analysis of the protein levels of HIF1α and HOXA10 in unexplained RM and HC villous tissues (n = 12). (H-K) Analysis of MDA levels (H), GPx activities (I), free Fe2+ ion levels (J), and COX-2 mRNA levels (K) in unexplained RM and HC villous tissues (n = 30). (L and M) Person correlation analysis of HOXA10 protein levels with MDA levels or free Fe2+ levels in unexplained RM and HC villous tissues (n = 12). (N and O) Person correlation analysis of HIF1α protein levels with MDA levels or free Fe2+ levels in unexplained RM and HC villous tissues (n = 12). HC-health control group; RM-unexplained recurrent miscarriage group. Student's t-test analysis for (B, D, F-K). Person correlation analysis for (E, L-O). P < 0.05 was considered as significant compared with HC. (For interpretation of the references to color in this figure legend, the reader is referred to the Web version of this article.)
Fig. 2
Fig. 2
Hypoxia induced ferroptosis by promoting HIF1α/NCOA4 pathway in hypoxic trophoblast cells. (A) Western blot analysis and relative quantification of HIF1α protein levels in hypoxic Swan 71 or HTR-8/SVneo cells for 0, 3, 6, 12, or 24 h, with Tubulin as internal standard. (B-H) Analysis of cytotoxicity (B), MDA levels (C), free Fe2+ levels (D), COX-2 mRNA levels (E), ROS levels (F), cell viability (G), and GPx activity (H) in Swan 71 or HTR-8/SVneo cells treated with DMSO or ferrostatin-1 (Fer-1, 10 μM) for 2 h and then treated with normoxia, hypoxia, or Erastin (5 μM) for 12 h. (I-K) Analysis of MDA levels (I), intracellular free Fe2+ levels (J), and Ferritin protein levels (K) in Swan 71 or HTR-8/SVneo cells transfected with NC or si1-NCOA4 for 12 h and then incubated under hypoxia for 12 h. (L and M) The mRNA levels of NCOA4 and protein levels of NCOA4 and HIF1α in hypoxic Swan 71 or HTR-8/SVneo cells for 0, 3, 6, 12, or 24 h. (N-Q) The mRNA levels of NCOA4 and protein levels of NCOA4 and HIF1α in hypoxic Swan 71 or HTR-8/SVneo cells with knockdown or overexpression of HIF1α, with Tubulin as internal standard. (R) ChIP assay analysis of the levels of NCOA4 promoter region enriched by HIF1α in hypoxic Swan 71 or HTR-8/SVneo cells, with IgG as negative control; and agarose gel image of the PCR products of NCOA4 promoter region enriched by HIF1α. (S) The relative luciferase activity of HIF1α binding with wild-type (WT) or mutant (MT) HRE of NCOA4 (Table S1) in hypoxic Swan 71 or HTR-8/SVneo cells. Data in (A-S) show mean ± SD, n = 5 independent experiments. Student's t-test analysis for (A, I-S), two-way ANOVA followed by Tukey's multiple comparisons test analysis for (B-H). P < 0.05 was considered as significant difference.
Fig. 2
Fig. 2
Hypoxia induced ferroptosis by promoting HIF1α/NCOA4 pathway in hypoxic trophoblast cells. (A) Western blot analysis and relative quantification of HIF1α protein levels in hypoxic Swan 71 or HTR-8/SVneo cells for 0, 3, 6, 12, or 24 h, with Tubulin as internal standard. (B-H) Analysis of cytotoxicity (B), MDA levels (C), free Fe2+ levels (D), COX-2 mRNA levels (E), ROS levels (F), cell viability (G), and GPx activity (H) in Swan 71 or HTR-8/SVneo cells treated with DMSO or ferrostatin-1 (Fer-1, 10 μM) for 2 h and then treated with normoxia, hypoxia, or Erastin (5 μM) for 12 h. (I-K) Analysis of MDA levels (I), intracellular free Fe2+ levels (J), and Ferritin protein levels (K) in Swan 71 or HTR-8/SVneo cells transfected with NC or si1-NCOA4 for 12 h and then incubated under hypoxia for 12 h. (L and M) The mRNA levels of NCOA4 and protein levels of NCOA4 and HIF1α in hypoxic Swan 71 or HTR-8/SVneo cells for 0, 3, 6, 12, or 24 h. (N-Q) The mRNA levels of NCOA4 and protein levels of NCOA4 and HIF1α in hypoxic Swan 71 or HTR-8/SVneo cells with knockdown or overexpression of HIF1α, with Tubulin as internal standard. (R) ChIP assay analysis of the levels of NCOA4 promoter region enriched by HIF1α in hypoxic Swan 71 or HTR-8/SVneo cells, with IgG as negative control; and agarose gel image of the PCR products of NCOA4 promoter region enriched by HIF1α. (S) The relative luciferase activity of HIF1α binding with wild-type (WT) or mutant (MT) HRE of NCOA4 (Table S1) in hypoxic Swan 71 or HTR-8/SVneo cells. Data in (A-S) show mean ± SD, n = 5 independent experiments. Student's t-test analysis for (A, I-S), two-way ANOVA followed by Tukey's multiple comparisons test analysis for (B-H). P < 0.05 was considered as significant difference.
Fig. 3
Fig. 3
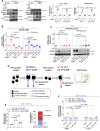
The SUMOylated HIF1α primarily performed NCOA4 transcription in hypoxic trophoblast cells. (A) The protein levels of SUMOylated HIF1α (HIF1α-SUMO) that was immunoprecipitated by HIF1α antibody in normoxic or hypoxic Swan 71 or HTR-8/SVneo cells treated with 2-D08 (50 μM), with NCOA4 protein levels in input. (B and C) The mRNA and protein levels of NCOA4 in hypoxic Swan 71 or HTR-8/SVneo cells with overexpression of HIF1α-WT (wild type) or HIF1α-MT (mutant) and treatment with 2-D08 (50 μM). (D) Scheme of ChIP-re-ChIP assays. (E) The levels of NCOA4 promoter region enriched by SUMOylated HIF1α (HIF1α-SUMO) or HIF1α in hypoxic Swan 71 cells in ChIP-re-ChIP assays. (F) The levels of NCOA4 promoter region enriched by HIF1α-SUMO in hypoxic Swan 71 cells with overexpression of HIF1α-WT or HIF1α-MT and treatment with 2-D08 (50 μM) in ChIP-re-ChIP assays. (G) Scheme of DNA pulldown assays. (H and I) The protein levels of HIF1α or HIF1α-SUMO pulled down by biotin-labeled DNA probe containing NCOA4 promoter region in hypoxic Swan 71 or HTR-8/SVneo cells in DNA pulldown assays. (J) The relative luciferase activity of HIF1α-WT or HIF1α-MT binding with HRE of NCOA4 in hypoxic Swan 71 or HTR-8/SVneo cells treated with 2-D08. Data in (A-C, E, F, I) show mean ± SD, n = 5 independent experiments. Student's t-test analysis for (E, I), Two-way ANOVA followed by Tukey's multiple comparisons test analysis for (B, C, F, J), and one-way AVOVA followed by Dunnett's multiple comparisons test analysis for (A). P < 0.05 was considered as significant difference.
Fig. 3
Fig. 3
The SUMOylated HIF1α primarily performed NCOA4 transcription in hypoxic trophoblast cells. (A) The protein levels of SUMOylated HIF1α (HIF1α-SUMO) that was immunoprecipitated by HIF1α antibody in normoxic or hypoxic Swan 71 or HTR-8/SVneo cells treated with 2-D08 (50 μM), with NCOA4 protein levels in input. (B and C) The mRNA and protein levels of NCOA4 in hypoxic Swan 71 or HTR-8/SVneo cells with overexpression of HIF1α-WT (wild type) or HIF1α-MT (mutant) and treatment with 2-D08 (50 μM). (D) Scheme of ChIP-re-ChIP assays. (E) The levels of NCOA4 promoter region enriched by SUMOylated HIF1α (HIF1α-SUMO) or HIF1α in hypoxic Swan 71 cells in ChIP-re-ChIP assays. (F) The levels of NCOA4 promoter region enriched by HIF1α-SUMO in hypoxic Swan 71 cells with overexpression of HIF1α-WT or HIF1α-MT and treatment with 2-D08 (50 μM) in ChIP-re-ChIP assays. (G) Scheme of DNA pulldown assays. (H and I) The protein levels of HIF1α or HIF1α-SUMO pulled down by biotin-labeled DNA probe containing NCOA4 promoter region in hypoxic Swan 71 or HTR-8/SVneo cells in DNA pulldown assays. (J) The relative luciferase activity of HIF1α-WT or HIF1α-MT binding with HRE of NCOA4 in hypoxic Swan 71 or HTR-8/SVneo cells treated with 2-D08. Data in (A-C, E, F, I) show mean ± SD, n = 5 independent experiments. Student's t-test analysis for (E, I), Two-way ANOVA followed by Tukey's multiple comparisons test analysis for (B, C, F, J), and one-way AVOVA followed by Dunnett's multiple comparisons test analysis for (A). P < 0.05 was considered as significant difference.
Fig. 4
Fig. 4
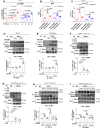
Lnc-HZ06 promoted HIF1α SUMOylation by suppressing SENP1 in hypoxic trophoblast cells. (A) RT-qPCR analysis of the relative expression levels of lnc-HZ06 in hypoxic Swan 71 or HTR-8/SVneo cells for 0, 6, 12, or 24 h. (B and C) Analysis of MDA and free Fe2+ levels in hypoxic Swan 71 or HTR-8/SVneo cells with overexpression of lnc-HZ06 and treatment with Fer-1 (10 μM) for 2 h. (D and E) The protein levels of SUMOylated HIF1α (HIF1α-SUMO) that was immunoprecipitated by identical but limited amount of HIF1α antibody in normoxic or hypoxic Swan 71 or HTR-8/SVneo cells with overexpression of lnc-HZ06, with total HIF1α protein levels in input. (F and G) The protein levels of HIF1α-SUMO that was immunoprecipitated by identical but limited amount of HIF1α antibody in hypoxic Swan 71 or HTR-8/SVneo cells with knockdown of lnc-HZ06, with total HIF1α protein levels in input. (H and I) The protein levels of HIF1α-SUMO that was immunoprecipitated by identical but limited amount of HIF1α antibody in hypoxic Swan 71 or HTR-8/SVneo cells with overexpression of lnc-HZ06 and HIF1α-WT or HIF1α-MT, with HIF1α protein levels in input. (J and K) The protein levels of HIF1α-SUMO that was immunoprecipitated by identical but limited amount of HIF1α antibody in hypoxic Swan 71 or HTR-8/SVneo cells with knockdown of SENP1. (L and M) The protein levels of HIF1α-SUMO that was immunoprecipitated by identical but limited amount of HIF1α antibody in hypoxic Swan 71 or HTR-8/SVneo cells with knockdown of SENP1 and overexpression of HIF1α-WT or HIF1α-MT in the presence of DMSO or 2-D08, with HIF1α protein levels in input. (N and O) The protein levels of SENP1 in hypoxic Swan 71 or HTR-8/SVneo cells with overexpression or knockdown of lnc-HZ06, with Tubulin as internal standard. (P and Q) The protein levels of HIF1α-SUMO that was immunoprecipitated by identical but limited amount of HIF1α antibody in hypoxic Swan 71 or HTR-8/SVneo cells with overexpression of lnc-HZ06 or co-knockdown of SENP1, with HIF1α protein levels in input. Data in (A-Q) show mean ± SD, n = 5 independent experiments. Student's t-test analysis for (A, K, N, O), One-way AVOVA followed by Tukey's multiple comparisons test analysis for (B-F, P, Q), and two-way ANOVA followed by Sidak's multiple comparisons test analysis for (G-I, L, M). P < 0.05 was considered as significant difference.
Fig. 4
Fig. 4
Lnc-HZ06 promoted HIF1α SUMOylation by suppressing SENP1 in hypoxic trophoblast cells. (A) RT-qPCR analysis of the relative expression levels of lnc-HZ06 in hypoxic Swan 71 or HTR-8/SVneo cells for 0, 6, 12, or 24 h. (B and C) Analysis of MDA and free Fe2+ levels in hypoxic Swan 71 or HTR-8/SVneo cells with overexpression of lnc-HZ06 and treatment with Fer-1 (10 μM) for 2 h. (D and E) The protein levels of SUMOylated HIF1α (HIF1α-SUMO) that was immunoprecipitated by identical but limited amount of HIF1α antibody in normoxic or hypoxic Swan 71 or HTR-8/SVneo cells with overexpression of lnc-HZ06, with total HIF1α protein levels in input. (F and G) The protein levels of HIF1α-SUMO that was immunoprecipitated by identical but limited amount of HIF1α antibody in hypoxic Swan 71 or HTR-8/SVneo cells with knockdown of lnc-HZ06, with total HIF1α protein levels in input. (H and I) The protein levels of HIF1α-SUMO that was immunoprecipitated by identical but limited amount of HIF1α antibody in hypoxic Swan 71 or HTR-8/SVneo cells with overexpression of lnc-HZ06 and HIF1α-WT or HIF1α-MT, with HIF1α protein levels in input. (J and K) The protein levels of HIF1α-SUMO that was immunoprecipitated by identical but limited amount of HIF1α antibody in hypoxic Swan 71 or HTR-8/SVneo cells with knockdown of SENP1. (L and M) The protein levels of HIF1α-SUMO that was immunoprecipitated by identical but limited amount of HIF1α antibody in hypoxic Swan 71 or HTR-8/SVneo cells with knockdown of SENP1 and overexpression of HIF1α-WT or HIF1α-MT in the presence of DMSO or 2-D08, with HIF1α protein levels in input. (N and O) The protein levels of SENP1 in hypoxic Swan 71 or HTR-8/SVneo cells with overexpression or knockdown of lnc-HZ06, with Tubulin as internal standard. (P and Q) The protein levels of HIF1α-SUMO that was immunoprecipitated by identical but limited amount of HIF1α antibody in hypoxic Swan 71 or HTR-8/SVneo cells with overexpression of lnc-HZ06 or co-knockdown of SENP1, with HIF1α protein levels in input. Data in (A-Q) show mean ± SD, n = 5 independent experiments. Student's t-test analysis for (A, K, N, O), One-way AVOVA followed by Tukey's multiple comparisons test analysis for (B-F, P, Q), and two-way ANOVA followed by Sidak's multiple comparisons test analysis for (G-I, L, M). P < 0.05 was considered as significant difference.
Fig. 5
Fig. 5
Lnc-HZ06 promoted HIF1α-SUMO-mediated NCOA4 transcription in hypoxic trophoblast cells. (A and B) The protein levels of NCOA4 in hypoxic Swan 71 or HTR-8/SVneo cells with overexpression or knockdown of lnc-HZ06. (C) The protein levels of NOCA4 in hypoxic Swan 71 or HTR-8/SVneo cells with overexpression of lnc-HZ06 and knockdown of HIF1α. (D) The protein levels of NOCA4 in hypoxic Swan 71 or HTR-8/SVneo cells with overexpression of lnc-HZ06 and HIF1α-WT or HIF1α-MT in the presence of DMSO or 2-D08. (E) The levels of NCOA4 promoter region enriched by HIF1α in hypoxic Swan 71 cells with overexpression of lnc-HZ06 in the presence of DMSO or 2-D08 in ChIP assays using identical but excessive amount of HIF1α antibody; and the agarose gel image of the PCR product of NCOA4 promoter region enriched by HIF1α. (F) The levels of NCOA4 promoter region enriched by SUMOylated HIF1α (HIF1α-SUMO) in hypoxic Swan 71 cells with overexpression of lnc-HZ06 in ChIP-re-ChIP assays. (G)The levels of NCOA4 promoter region enriched by SUMOylated HIF1α (HIF1α-SUMO) or total HIF1α in hypoxic Swan 71 cells with overexpression of lnc-HZ06 in ChIP-re-ChIP assays using identical but excessive amount of HIF1α antibody and SUMO antibody. (H) The levels of NCOA4 promoter region enriched by HIF1α-SUMO or HIF1α in hypoxic Swan 71 cells with overexpression of lnc-HZ06 in ChIP-re-ChIP assays. (I) The protein levels of HIF1α and HIF1α-SUMO pulled down by biotin-labeled DNA probe containing NCOA4 promoter region in hypoxic Swan 71 cells with overexpression of lnc-HZ06 in DNA pulldown assays. (J) The relative luciferase activity of HIF1α-SUMO bind onto NCOA4 HRE in hypoxic Swan 71 cells with overexpression of HIF1α-WT or HIF1α-MT or co-overexpression of lnc-HZ06. Data in (A-G, I, J) show mean ± SD, n = 5 independent experiments. Student's t-test analysis for (A, B), two-way ANOVA followed by Tukey's multiple comparisons test analysis for (C-G, I, J). P < 0.05 was considered as significant difference.
Fig. 6
Fig. 6
Lnc-HZ06 promoted ferroptosis by enhancing HIF1α-SUMO-mediated NCOA4 transcription in hypoxic trophoblast cells. (A-D) Analysis of MDA and free Fe2+ levels in hypoxic Swan 71 or HTR-8/SVneo cells with overexpression of lnc-HZ06 or co-knockdown of HIF1α. (E-H) Analysis of MDA and free Fe2+ levels in hypoxic Swan 71 or HTR-8/SVneo cells with overexpression of lnc-HZ06 or co-overexpression of HIF1α-WT or HIF1α-MT. (I-L) Analysis of MDA and free Fe2+ levels in hypoxic Swan 71 or HTR-8/SVneo cells with overexpression of lnc-HZ06 or co-knockdown of NCOA4. Data in (A-L) show mean ± SD, n = 5 independent experiments. Two-way AVOVA followed by Tukey's multiple comparisons test analysis for (A-L); P < 0.05 was considered as significant difference.
Fig. 7
Fig. 7
HIF1α-SUMO promoted lnc-HZ06 transcription in hypoxic trophoblast cells. (A) The RNA levels of HIF1α and lnc-HZ06 in hypoxic Swan 71 or HTR-8/SVneo cells with knockdown of HIF1α. (B) Lnc-HZ06 levels in hypoxic Swan 71 cells treated with 2-D08. (C) Lnc-HZ06 levels in hypoxic Swan 71 or HTR-8/SVneo cells with overexpression of HIF1α-WT or HIF1α-MT in the presence of DMSO or 2-D08. (D and E) The levels of lnc-HZ06 promoter region enriched by SUMOylated HIF1α (HIF1α-SUMO) in hypoxic Swan 71 or HTR-8/SVneo cells with overexpression of HIF1α-WT or HIF1α-MT in ChIP-re-ChIP assays using identical but excessive amount of HIF1α antibody and SUMO antibody. (F) The protein levels of HIF1α or HIF1α-SUMO pulled down by biotin-labeled DNA probe containing lnc-HZ06 promoter region in hypoxic Swan 71 or HTR-8/SVneo cells in DNA pulldown assays. (G) The relative luciferase activity of HIF1α on lnc-HZ06 HRE in hypoxic Swan 71 or HTR-8/SVneo cells with overexpression of HIF1α-WT or HIF1α-MT and co-treatment with 2-D08. Data in (A- G) show mean ± SD, n = 5 independent experiments. One-way AVOVA followed by Dunnett's multiple comparisons test analysis for (A), Student's t-test analysis for (B, F), two-way ANOVA followed by Tukey's multiple comparisons test analysis for (C-E, G). P < 0.05 was considered as significant difference.
Fig. 8
Fig. 8
Lnc-HZ06/HIF1α-SUMO feedback loop was up-regulated in unexplained RM vs HC villous tissues. (A) The expression levels of lnc-HZ06 in HC and unexplained RM villous tissues (each n = 30). (B) The protein levels of SUMOylated HIF1α (HIF1α-SUMO) that was immunoprecipitated by HIF1α antibody in HC and unexplained RM tissues (each n = 4) in IP assays using identical but limited amount of HIF1α antibody, with HIF1α protein levels in Input. (C-E) The mRNA and protein levels of NCOA4 in HC and RM tissues (n = 30 for mRNA, n = 12 for protein, and n = 5 for IHC assays). The relative intensity of NCOA4 protein band or NCOA4 protein (brown color) in IHC images was quantified and plotted. (F and G) Person correlation analysis of the expression levels of lnc-HZ06 and the mRNA or protein levels of NCOA4 in HC and RM villous tissues (n = 30 for mRNA and n = 12 for protein). (H) The levels of NCOA4 promoter region enriched by SUMOylated HIF1α (HIF1α-SUMO) in HC and RM villous tissues (n = 4). (I) The protein levels of HIF1α or HIF1α-SUMO pulled down by biotin-labeled DNA probe containing NCOA4 or lnc-HZ06 promoter region in HC and RM villous tissues in DNA pulldown assays (n = 4). (J and K) Person correlation analysis of the levels of lnc-HZ06 and MDA or free Fe2+ in RM and HC villous tissues (n = 30). (L) The levels of lnc-HZ06 promoter region enriched by HIF1α-SUMO in RM and HC villous tissues in ChIP-re-ChIP assays (n = 4). Data in (A-D, H, I, L) show mean ± SD, n = 5 independent experiments. Student's t-test analysis for (A, C, D, H, I, L). Pearson correlation analysis for (F, G, J, K). P < 0.05 was considered as significant difference. (For interpretation of the references to color in this figure legend, the reader is referred to the Web version of this article.)
Fig. 9
Fig. 9
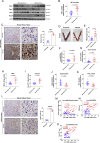
Hypoxia induced miscarriage by promoting ferroptosis in hypoxic mouse model. (A) The protein levels of murine Hif1α, Gpx4, Fth1, and Ncoa4 in placental tissues of normoxia- or hypoxia-treated pregnant mice (n = 15, 6 representatives were shown), with Actin as internal standard. (B) The relative intensity of each protein band of Hif1α in normoxia- or hypoxia-treated mouse placental tissues was quantified and plotted (n = 15). (C) IHC image and relative quantification of murine Hif1α protein levels (brown color) in normoxia- or hypoxia-treated mouse placental tissues. (D) Representative uterus morphology on gestational day 13 in normoxia- or hypoxia-treated pregnant mice with embryo absorption indicated by red arrows. (E) Average miscarriage rates in normoxia- or hypoxia-treated pregnant mice (n = 15). (F) The relative expression levels of murine lnc-Hz06 in normoxia- or hypoxia-treated mouse placental tissues (n = 15). (G-K) Analysis of the levels of Ncoa4 protein, MDA, free Fe2+, Gpx4 protein, and Fth1 protein in placental tissues of normoxia- or hypoxia-treated pregnant mice (n = 15). (L) IHC image and relative quantification of murine Ncoa4 protein levels (brown color) in placental tissues in normoxia- or hypoxia-treated pregnant mice. (M-O) Person correlation analysis of the levels of murine lnc-Hz06 and Ncoa4 protein, MDA, or free Fe2+ in placental tissues in normoxia- or hypoxia-treated pregnant mice (n = 15). (P) The protein levels of SUMOylated Hif1α (Hif1α-SUMO) that was immunoprecipitated by Hif1α antibody in placental tissues in normoxia- or hypoxia-treated pregnant mice (n = 6). (Q and S) The levels of Ncoa4 or lnc-Hz06 promoter region enriched by Hif1α-SUMO in placental tissues in normoxia- or hypoxia-treated pregnant mice in ChIP-re-ChIP assays (n = 6). (R and T) The protein levels of Hif1α and Hif1α-SUMO pulled down by biotin-labeled DNA probe containing Ncoa4 or lnc-Hz06 promoter region in placental tissues in normoxia- or hypoxia-treated pregnant mice in DNA pulldown assays (n = 6). Data in (B-L, P-T) show mean ± SD, n = 15 independent samples. Student's t-test analysis for (B, C, E, F-L, P-T). Pearson correlation analysis for (M-O). P < 0.05 was considered as significant difference. (For interpretation of the references to color in this figure legend, the reader is referred to the Web version of this article.)
Fig. 9
Fig. 9
Hypoxia induced miscarriage by promoting ferroptosis in hypoxic mouse model. (A) The protein levels of murine Hif1α, Gpx4, Fth1, and Ncoa4 in placental tissues of normoxia- or hypoxia-treated pregnant mice (n = 15, 6 representatives were shown), with Actin as internal standard. (B) The relative intensity of each protein band of Hif1α in normoxia- or hypoxia-treated mouse placental tissues was quantified and plotted (n = 15). (C) IHC image and relative quantification of murine Hif1α protein levels (brown color) in normoxia- or hypoxia-treated mouse placental tissues. (D) Representative uterus morphology on gestational day 13 in normoxia- or hypoxia-treated pregnant mice with embryo absorption indicated by red arrows. (E) Average miscarriage rates in normoxia- or hypoxia-treated pregnant mice (n = 15). (F) The relative expression levels of murine lnc-Hz06 in normoxia- or hypoxia-treated mouse placental tissues (n = 15). (G-K) Analysis of the levels of Ncoa4 protein, MDA, free Fe2+, Gpx4 protein, and Fth1 protein in placental tissues of normoxia- or hypoxia-treated pregnant mice (n = 15). (L) IHC image and relative quantification of murine Ncoa4 protein levels (brown color) in placental tissues in normoxia- or hypoxia-treated pregnant mice. (M-O) Person correlation analysis of the levels of murine lnc-Hz06 and Ncoa4 protein, MDA, or free Fe2+ in placental tissues in normoxia- or hypoxia-treated pregnant mice (n = 15). (P) The protein levels of SUMOylated Hif1α (Hif1α-SUMO) that was immunoprecipitated by Hif1α antibody in placental tissues in normoxia- or hypoxia-treated pregnant mice (n = 6). (Q and S) The levels of Ncoa4 or lnc-Hz06 promoter region enriched by Hif1α-SUMO in placental tissues in normoxia- or hypoxia-treated pregnant mice in ChIP-re-ChIP assays (n = 6). (R and T) The protein levels of Hif1α and Hif1α-SUMO pulled down by biotin-labeled DNA probe containing Ncoa4 or lnc-Hz06 promoter region in placental tissues in normoxia- or hypoxia-treated pregnant mice in DNA pulldown assays (n = 6). Data in (B-L, P-T) show mean ± SD, n = 15 independent samples. Student's t-test analysis for (B, C, E, F-L, P-T). Pearson correlation analysis for (M-O). P < 0.05 was considered as significant difference. (For interpretation of the references to color in this figure legend, the reader is referred to the Web version of this article.)
Fig. 10
Fig. 10
Knockdown of lnc-Hz06 or Ncoa4 efficiently alleviated miscarriage in hypoxia-treated pregnant mice. (A) Schematic diagram of miscarriage intervention by injecting hypoxia-treated mice with AS-Hz06 or AS-Ncoa4. (B and C) The RNA levels of murine lnc-Hz06 and Ncoa4 in placental tissues in AS-Hz06-or AS-Ncoa4-treated hypoxic pregnant mice (n = 15). (D) Representative uterus morphology on gestational day 13 in AS-Hz06-or AS-Ncoa4-treated hypoxic pregnant mice with embryo absorption indicated by red arrows. (E) Average miscarriage rates in AS-Hz06-or AS-Ncoa4-treated hypoxic pregnant mice (n = 15). (F-I) The protein levels of murine Gpx4, Fth1, and Ncoa4 in placental tissues in AS-Hz06-or AS-Ncoa4-treated hypoxic pregnant mice (n = 15), with Actin as internal standard. (J and K) The levels of MDA and free Fe2+ in placental tissues in AS-Hz06-or AS-Ncoa4-treated hypoxic pregnant mice (n = 15). (L) Lnc-HZ06 and Hif1α-SUMO formed a positive auto-regulatory feedback loop, which was up-regulated in hypoxic trophoblast cells and in RM villous tissues. Hif1α-SUMO further promoted the transcription of NCOA4 and induced trophoblast cell ferroptosis and the occurrence of RM. Data in (B, C, E, G-K) show mean ± SD, n = 5 independent experiments. Student's t-test analysis for (B, C). Two-way ANOVA followed by Tukey's multiple comparisons test for (E, G-K). P < 0.05 was considered as significant difference. (For interpretation of the references to color in this figure legend, the reader is referred to the Web version of this article.)

References

    1. Rai R., Regan L. Recurrent miscarriage. Lancet. 2006;368(9535):601–611. - PubMed
    1. Green D.M., O'Donoghue K. A review of reproductive outcomes of women with two consecutive miscarriages and no living child. J. Obstet. Gynaecol. 2019;39(6):816–821. - PubMed
    1. Basile N., Elkhatib I., Meseguer M. A strength, weaknesses, opportunities and threats analysis on time lapse. Curr. Opin. Obstet. Gynecol. 2019;31(3):148–155. - PubMed
    1. Rull K., Nagirnaja L., Laan M. Genetics of recurrent miscarriage: challenges, current knowledge, future directions. Front. Genet. 2012;3:34. - PMC - PubMed
    1. Beharier O., et al. PLA2G6 guards placental trophoblasts against ferroptotic injury. Proc. Natl. Acad. Sci. U. S. A. 2020;117(44):27319–27328. - PMC - PubMed

Further reading

    1. Mi C., et al. Lnc-HZ05 regulates BPDE-inhibited human trophoblast cell proliferation and affects the occurrence of miscarriage by directly binding with miR-hz05. Cell Biol. Toxicol. 2022;38(6):1137–1157. - PubMed
    1. Dai M., et al. BPDE, the migration and invasion of human trophoblast cells, and occurrence of miscarriage in humans: roles of a novel lncRNA-HZ09. Environ. Health Perspect. 2023;131(1) - PMC - PubMed
    1. Xu Z., et al. Lnc-HZ01 with m6A RNA methylation inhibits human trophoblast cell proliferation and induces miscarriage by up-regulating BPDE-activated lnc-HZ01/MXD1 positive feedback loop. Sci. Total Environ. 2021;776 - PubMed
    1. Liang T., et al. Novel lnc-HZ03 and miR-hz03 promote BPDE-induced human trophoblastic cell apoptosis and induce miscarriage by upregulating p53/SAT1 pathway. Cell Biol. Toxicol. 2021;37(6):951–970. - PubMed

LinkOut - more resources