. 2024 May 28;199(2):227-245.
doi: 10.1093/toxsci/kfae018.

Development of a human liver microphysiological coculture system for higher throughput chemical safety assessment

Affiliations

Development of a human liver microphysiological coculture system for higher throughput chemical safety assessment

Blanche C Ip et al. Toxicol Sci. .

Abstract

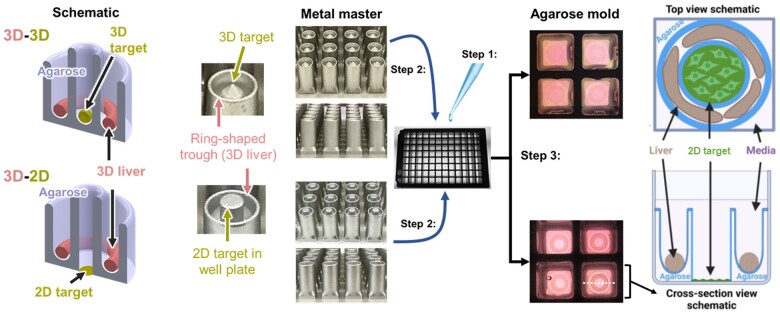
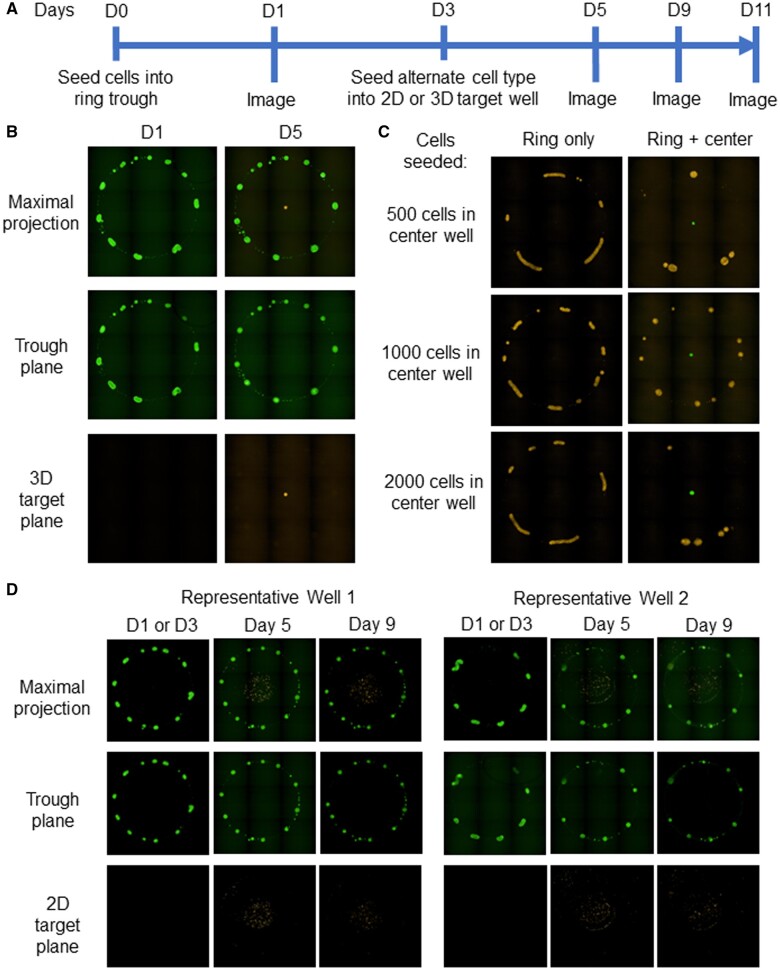
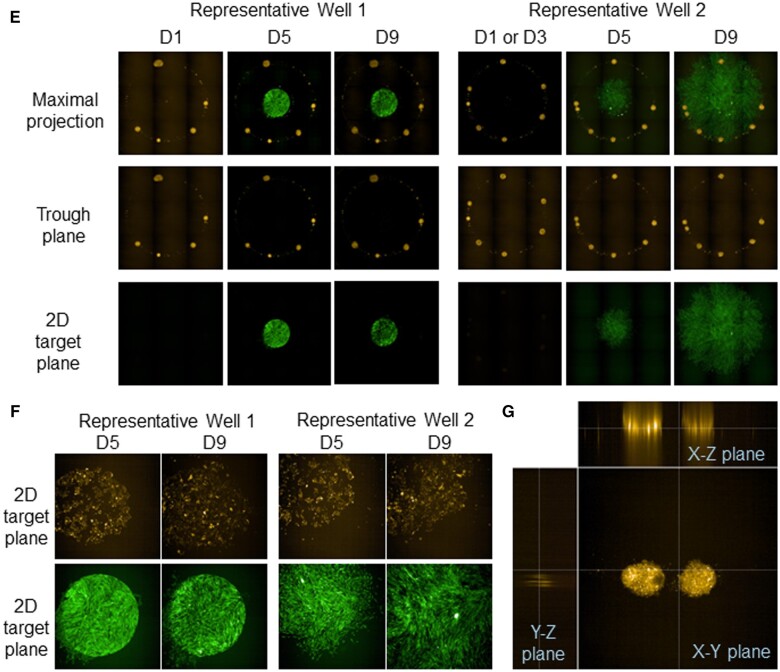
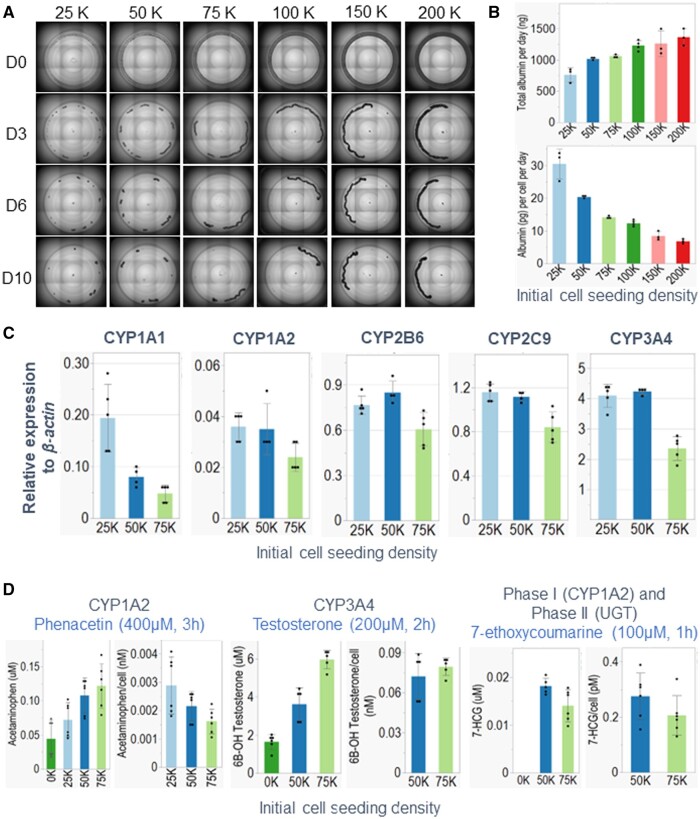
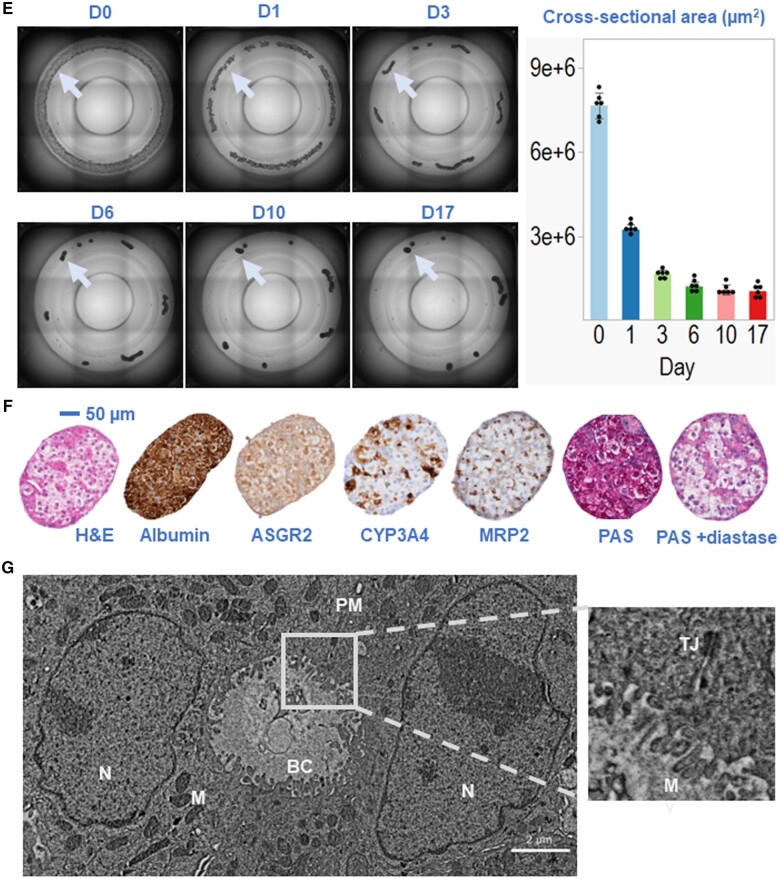
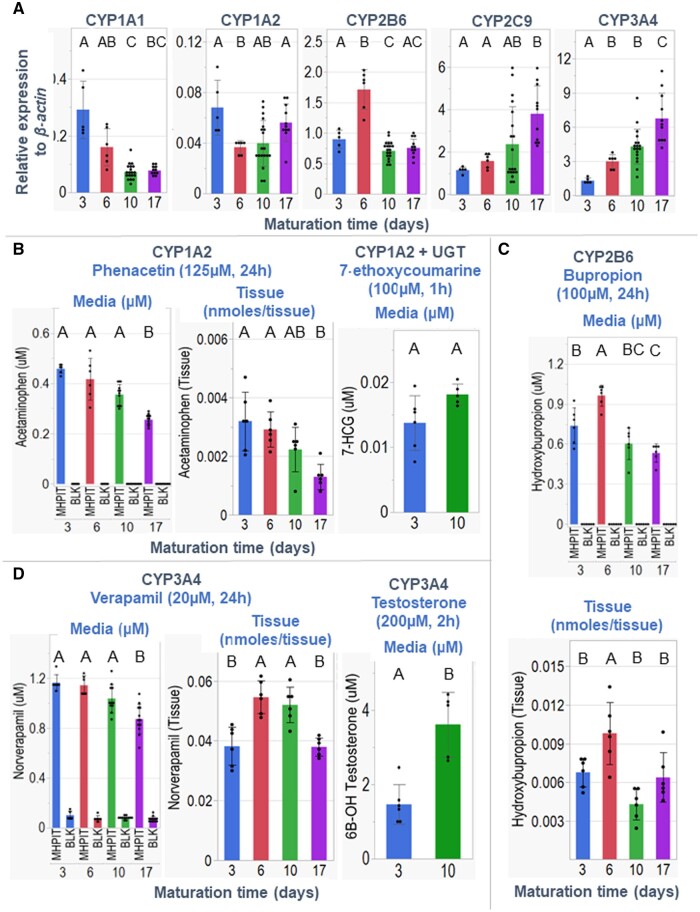
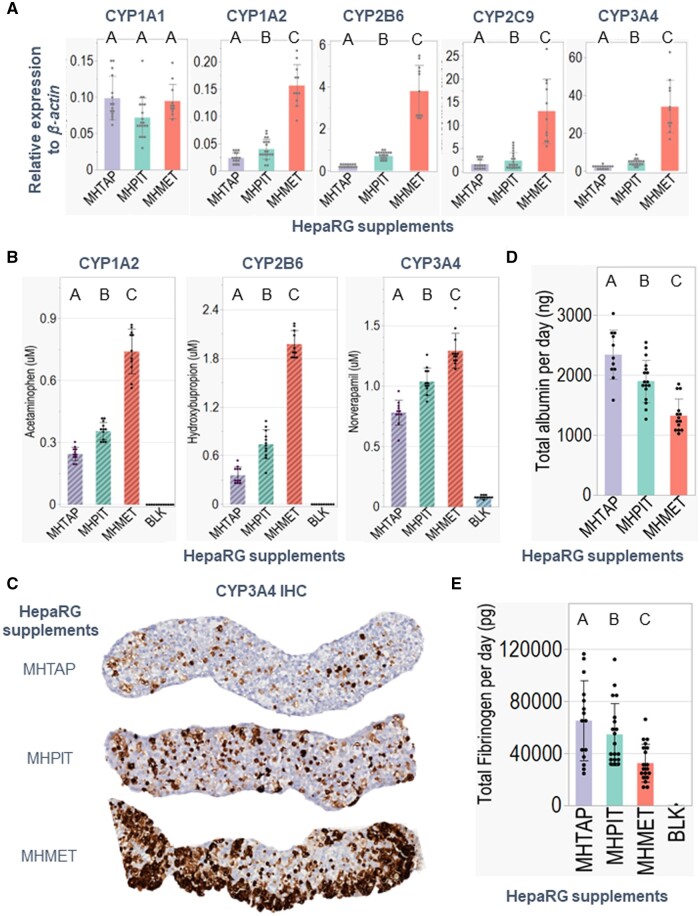
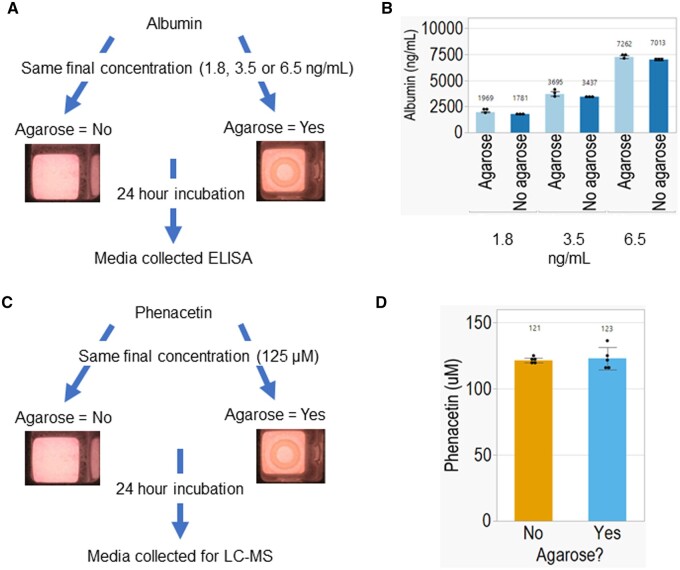
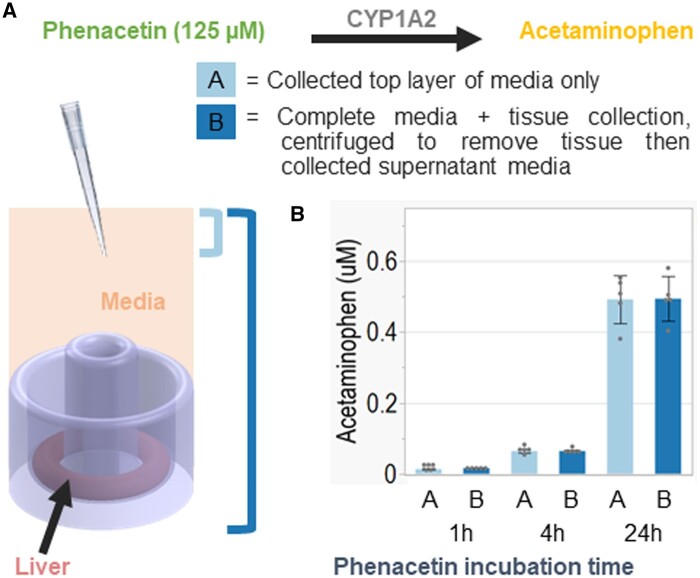
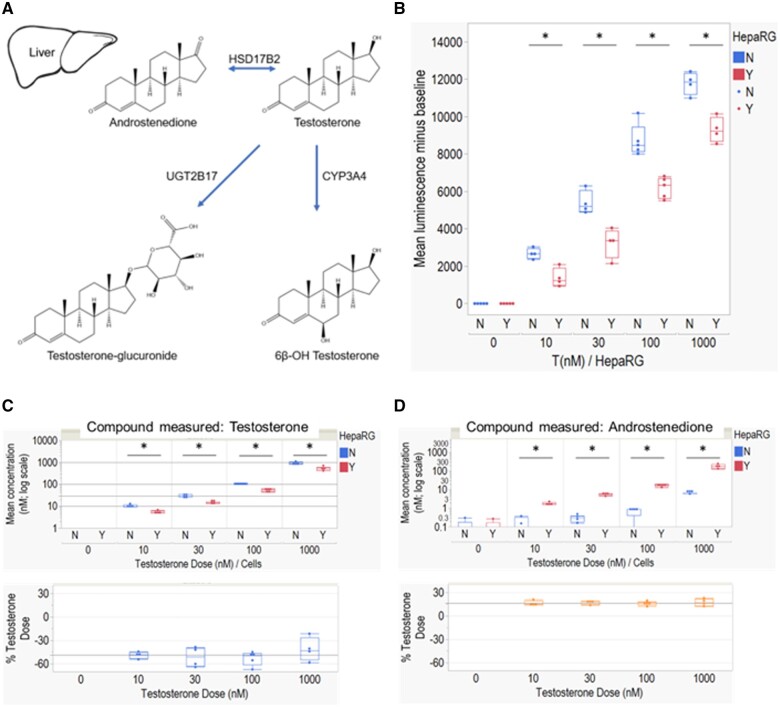
Chemicals in the systemic circulation can undergo hepatic xenobiotic metabolism, generate metabolites, and exhibit altered toxicity compared with their parent compounds. This article describes a 2-chamber liver-organ coculture model in a higher-throughput 96-well format for the determination of toxicity on target tissues in the presence of physiologically relevant human liver metabolism. This 2-chamber system is a hydrogel formed within each well consisting of a central well (target tissue) and an outer ring-shaped trough (human liver tissue). The target tissue chamber can be configured to accommodate a three-dimensional (3D) spheroid-shaped microtissue, or a 2-dimensional (2D) cell monolayer. Culture medium and compounds freely diffuse between the 2 chambers. Human-differentiated HepaRG liver cells are used to form the 3D human liver microtissues, which displayed robust protein expression of liver biomarkers (albumin, asialoglycoprotein receptor, Phase I cytochrome P450 [CYP3A4] enzyme, multidrug resistance-associated protein 2 transporter, and glycogen), and exhibited Phase I/II enzyme activities over the course of 17 days. Histological and ultrastructural analyses confirmed that the HepaRG microtissues presented a differentiated hepatocyte phenotype, including abundant mitochondria, endoplasmic reticulum, and bile canaliculi. Liver microtissue zonation characteristics could be easily modulated by maturation in different media supplements. Furthermore, our proof-of-concept study demonstrated the efficacy of this coculture model in evaluating testosterone-mediated androgen receptor responses in the presence of human liver metabolism. This liver-organ coculture system provides a practical, higher-throughput testing platform for metabolism-dependent bioactivity assessment of drugs/chemicals to better recapitulate the biological effects and potential toxicity of human exposures.

Keywords: in vitro testing; 3D coculture; HepaRG; animal alternatives; liver metabolism; toxicity testing.


Figures

Figure 1.
Figure 1.
The design and fabrication of the 2-chamber systems (3D-3D and 3D-2D) in a 96-well plate. Left panel shows schematics of the 3D-3D and the 3D-2D 2-chamber systems made out of 2% agarose mold. Both systems consist of an outer ring-shaped trough to culture the 3D liver microtissues. The 3D-3D system has a center conical well for culturing target cells as a 3D microtissue. The 3D-2D system has a center opening to the surface of the 96-well plate, where target cells can be cultured as a 2D monolayer of cells. The middle panel shows the stainless-steel master molds that are used to create the agarose 2-chamber systems in the 96-well plates. The fabrication process entails 3 main steps: Step (1) molten sterile 2% agarose is pipetted into wells; step (2) stainless-steel metal master is inverted into well plate with molten agarose; step (3) once the molten agarose has solidified, the metal master is removed and serum-free cell culture medium is added into each of the wells. The right panels are the top and cross-sectional schematic representation of the 3D-2D 2-chamber coculture system in 1 well of a 96-well plate, showing cell culture media covering both chambers, thus allowing chemical in cell culture media to diffusing through the cell culture media, as well as through the 2% agarose hydrogel. Schematics are not to scale.
Figure 2.
Figure 2.
The 2-chamber systems allow the culture of 2 different cell types isolated within their separate compartments. Experimental timeline for examining coculture capability of the 2-chamber system (A). Prostate stromal (RFP; yellow) and epithelial (EGFP; green) cells form 3D tissues that are stable over time with minimal cross-over of cell types (B, C). The size of the 3D spheroid target microtissue can be modulated by changing the number of cells seeded (C). Prostate stromal and epithelial cells successfully form both 3D tissues and 2D monolayers of cells with minimal cross-over of cell types (D, E; 2 representative wells). Two-dimensional prostate epithelial cells exhibit consistent cell morphology (D—left vs right panels, F—top-left vs top-right panels), whereas 2D prostate stromal cells are highly variable in size and shape (E—left vs right panels, F—bottom-left vs bottom-right panels). Three-dimensional tissues are readily imaged by confocal microscopy in the x, y, and z planes (G).
Figure 2.
Figure 2.
The 2-chamber systems allow the culture of 2 different cell types isolated within their separate compartments. Experimental timeline for examining coculture capability of the 2-chamber system (A). Prostate stromal (RFP; yellow) and epithelial (EGFP; green) cells form 3D tissues that are stable over time with minimal cross-over of cell types (B, C). The size of the 3D spheroid target microtissue can be modulated by changing the number of cells seeded (C). Prostate stromal and epithelial cells successfully form both 3D tissues and 2D monolayers of cells with minimal cross-over of cell types (D, E; 2 representative wells). Two-dimensional prostate epithelial cells exhibit consistent cell morphology (D—left vs right panels, F—top-left vs top-right panels), whereas 2D prostate stromal cells are highly variable in size and shape (E—left vs right panels, F—bottom-left vs bottom-right panels). Three-dimensional tissues are readily imaged by confocal microscopy in the x, y, and z planes (G).
Figure 3.
Figure 3.
Optimization of HepaRG seeding densities in 2-chamber systems. Seeding densities of HepaRGs from 25 000 to 200 000 cells per well were examined in the 2-chamber systems. A, Representative live cell brightfield images showing HepaRG cells forming 3D microtissues during culture in the 2-chamber system for 0, 3, 6, and 10 days. B, Graphical representation of total albumin secreted per day (ng) and the corrected secreted albumin per number of cells initially seeded (pg/d) after 10 days of maturation, showing that increasing cell seeding density decreased albumin secretion on a per cell basis. C, Decline in hepatic Phase I CYP enzyme gene expression of HepaRG 3D microtissues matured for 10 days when the initial seeding density increased from 50 000 to 75 000 cells per well. D, Decline in hepatic Phase I/II enzyme function of HepaRG 3D microtissues matured for 3 days (phenacetin) or 10 days (testosterone; 7-ethoxycoumarin) when the initial seeding density increased from 25 000 or 50 000 to 75 000 cells per well. E, Representative brightfield images of HepaRG 3D microtissues at an optimal seeding density of 50 000 cells per well-formed stable 3D microtissues (arrows) that compacted over the course of 17 days, as indicated by the decline in cross-sectional area of the brightfield imaged tissues. F, HepaRG microtissues (day 10) were formalin-fixed, paraffin-embedded and sectioned for histological analyses. Hematoxylin and eosin (H&E) staining shows HepaRG cells in 3D microtissues have abundant cytoplasm. Immunohistochemical staining (in brown) reveals tissue expression of albumin, asialoglycoprotein receptor (ASGR2) for glycoprotein uptake, Phase I cytochrome P450 (CYP3A4) enzyme, and multidrug resistance-associated protein 2 (MRP2) transporter for biliary excretion. Periodic acid-Schiff (PAS) stain with or without diastase enzyme that breaks down glycogen supports that HepaRG microtissues synthesize and store glycogen. G, Transmission electron microscopy (scale bar = 2 µm) showing characteristic features of mature hepatocytes; the inset is a higher magnification the tight junctional apparatus associated with the bile canaliculus. BC, bile canaliculus; M, mitochondria; Mv, microvilli; N, nucleus; PM, plasma membrane; TJ, tight junction; UGT, Phase II uridine diphosphate-glucuronosyl transferase; 7-HCG, 7-hydroxycoumarin glucuronide.
Figure 3.
Figure 3.
Optimization of HepaRG seeding densities in 2-chamber systems. Seeding densities of HepaRGs from 25 000 to 200 000 cells per well were examined in the 2-chamber systems. A, Representative live cell brightfield images showing HepaRG cells forming 3D microtissues during culture in the 2-chamber system for 0, 3, 6, and 10 days. B, Graphical representation of total albumin secreted per day (ng) and the corrected secreted albumin per number of cells initially seeded (pg/d) after 10 days of maturation, showing that increasing cell seeding density decreased albumin secretion on a per cell basis. C, Decline in hepatic Phase I CYP enzyme gene expression of HepaRG 3D microtissues matured for 10 days when the initial seeding density increased from 50 000 to 75 000 cells per well. D, Decline in hepatic Phase I/II enzyme function of HepaRG 3D microtissues matured for 3 days (phenacetin) or 10 days (testosterone; 7-ethoxycoumarin) when the initial seeding density increased from 25 000 or 50 000 to 75 000 cells per well. E, Representative brightfield images of HepaRG 3D microtissues at an optimal seeding density of 50 000 cells per well-formed stable 3D microtissues (arrows) that compacted over the course of 17 days, as indicated by the decline in cross-sectional area of the brightfield imaged tissues. F, HepaRG microtissues (day 10) were formalin-fixed, paraffin-embedded and sectioned for histological analyses. Hematoxylin and eosin (H&E) staining shows HepaRG cells in 3D microtissues have abundant cytoplasm. Immunohistochemical staining (in brown) reveals tissue expression of albumin, asialoglycoprotein receptor (ASGR2) for glycoprotein uptake, Phase I cytochrome P450 (CYP3A4) enzyme, and multidrug resistance-associated protein 2 (MRP2) transporter for biliary excretion. Periodic acid-Schiff (PAS) stain with or without diastase enzyme that breaks down glycogen supports that HepaRG microtissues synthesize and store glycogen. G, Transmission electron microscopy (scale bar = 2 µm) showing characteristic features of mature hepatocytes; the inset is a higher magnification the tight junctional apparatus associated with the bile canaliculus. BC, bile canaliculus; M, mitochondria; Mv, microvilli; N, nucleus; PM, plasma membrane; TJ, tight junction; UGT, Phase II uridine diphosphate-glucuronosyl transferase; 7-HCG, 7-hydroxycoumarin glucuronide.
Figure 4.
Figure 4.
HepaRG 3D microtissue gene expression and function are dependent on the time of HepaRG maturation. Gene expression relative to housekeeping gene β-actin (A). Metabolic function (B–D) of hepatic Phase I/II enzymes in HepaRG 3D microtissues that have matured in the ring trough for 3, 6, 10, or 17 days. CYP1A2, CYP2B6, CYP3A4, and the combined CYP1A2 + UGT functions were evaluated by incubating HepaRG 3D microtissues with phenacetin (125 µM for 24 h), bupropion (100 µM for 24 h), verapamil (20 µM for 24 h), testosterone (200 µM for 2 h), or 7-ethoxycoumarin (100 µM for 1 h), respectively. Data = mean ± SD. Student’s t test and 1-way ANOVA with post hoc Tukey HSD test, or their nonparametric equivalent, were used to examine statistical significance between maturation days. Bars that do not share the same letters are significantly different (p value ≤ .05). 7-HCG, 7-hydroxycoumarin glucuronide; UGT, Phase II uridine diphosphate-glucuronosyl transferase.
Figure 5.
Figure 5.
HepaRG microtissues can recapitulate an in vivo-like zonation of nitrogen and xenobiotic metabolisms by maturing in medium supplements with varying amounts of DMSO. Gene expression relative to housekeeping gene β-actin (A). Metabolic function of hepatic Phase I CYP enzymes (B), CYP3A4 protein expression by immunohistochemistry (C). Levels of human albumin (D) and fibrinogen (E) protein synthesis by ELISA. HepaRG 3D microtissues were matured in the ring trough for 10 days in MHTAP, MHPIT, or MHMET medium. CYP1A2, CYP2B6, and CYP3A4 function was evaluated by incubating HepaRG 3D microtissues with phenacetin (125 µM for 24 h), bupropion (100 µM for 24 h), verapamil (20 µM for 24 h), respectively. HepaRG microtissues were formalin-fixed, paraffin-embedded, and sectioned for immunostaining analyses. Data = mean ± SD. One-way ANOVA with post hoc Tukey HSD test, or their nonparametric equivalent, were used to examine statistical significance between maturation days. Bars that do not share the same letters are significantly different (p value ≤ .05).
Figure 6.
Figure 6.
The agarose mold did not alter medium constituent concentration. A, Diagram of the experimental design for examining whether agarose alters albumin concentration. B, Albumin concentrations with or without agarose in the platform are comparable after 24 h of incubation with albumin-spiked medium at 3 different final concentrations. C, Experimental design for examining whether agarose alters phenacetin concentration. D, Phenacetin concentrations of wells with or without the agarose in the platform were similar after 24 h of incubation with phenacetin-spiked medium at a final concentration of 125 µM.
Figure 7.
Figure 7.
Agarose did not alter the diffusion of compounds. A, Experimental design for examining the diffusivity of acetaminophen in the 2-chamber platform. B, Acetaminophen concentrations of the top layer of medium are identical to the concentration of the whole well after HepaRG 3D microtissues are incubated in phenacetin-spiked medium at a final concentration of 125 µM for 1, 4, or 24 .
Figure 8.
Figure 8.
HepaRG 3D microtissues metabolized testosterone and reduced testosterone-mediated activation of androgen receptor (AR). Simplified metabolic pathway of testosterone biotransformation in the liver (A). Mean luminescence minus baseline of AR-CALUX reporter cells cocultured with or without HepaRG 3D microtissues after incubation with testosterone (T) at 0, 10, 30, 100, or 1000 nM for 24 h (B). Mean media testosterone concentration in nM (top) of wells with or without HepaRG 3D microtissues after incubation with testosterone (T) at 0, 10, 30, 100, or 1000 nM for 24 h, and as % of starting testosterone doses (bottom) in wells with HepaRG (C). Mean media androstenedione concentration in nM (top) of wells with or without HepaRG 3D microtissues after incubation with testosterone (T) at 0, 10, 30, 100, or 1000 nM for 24 h, and as % of starting testosterone doses (bottom) of wells with HepaRG (D). Data = mean ± SD. Student’s t test was used to examine statistical significance for the effects of HepaRG on AR-CALUX activation and compounds in media measured by LC-MS for each of the 4 doses independently. * p <  .05. CYP3A4, cytochrome P450 family 3 member A4; HSD17B2, 17β-hydroxysteroid dehydrogenase 2; UGT2B17, UDP glucuronosyltransferase family 2 member B17.

Similar articles

Cited by

References

    1. Ahn J., Ahn J. H., Yoon S., Nam Y. S., Son M. Y., Oh J. H. (2019). Human three-dimensional in vitro model of hepatic zonation to predict zonal hepatotoxicity. J. Biol. Eng. 13, 22. - PMC - PubMed
    1. Bimboes D., Greim H. (1976). Human lymphocytes as target cells in a metabolizing test system in vitro for detecting potential mutagens. Mutat. Res. 35, 155–160. - PubMed
    1. Boutin M. E., Strong C. E., Van Hese B., Hu X., Itkin Z., Chen Y. C., LaCroix A., Gordon R., Guicherit O., Carromeu C., et al. (2022). A multiparametric calcium signal screening platform using iPSC-derived cortical neural spheroids. SLAS Discov. 27, 209–218. - PMC - PubMed
    1. Boutin M. E., Voss T. C., Titus S. A., Cruz-Gutierrez K., Michael S., Ferrer M. (2018). A high-throughput imaging and nuclear segmentation analysis protocol for cleared 3D culture models. Sci. Rep. 8, 11135. - PMC - PubMed
    1. Bull S., Langezaal I., Clothier R., Coecke S. (2001). A genetically engineered cell-based system for detecting metabolism-mediated toxicity. Altern. Lab. Anim. 29, 703–716. - PubMed

LinkOut - more resources