. 2024 Mar 13;4(3):100501.
doi: 10.1016/j.xgen.2024.100501. Epub 2024 Feb 8.

Integrative high-throughput enhancer surveying and functional verification divulges a YY2-condensed regulatory axis conferring risk for osteoporosis

Affiliations

Integrative high-throughput enhancer surveying and functional verification divulges a YY2-condensed regulatory axis conferring risk for osteoporosis

Xiao-Feng Chen et al. Cell Genom. .

Abstract

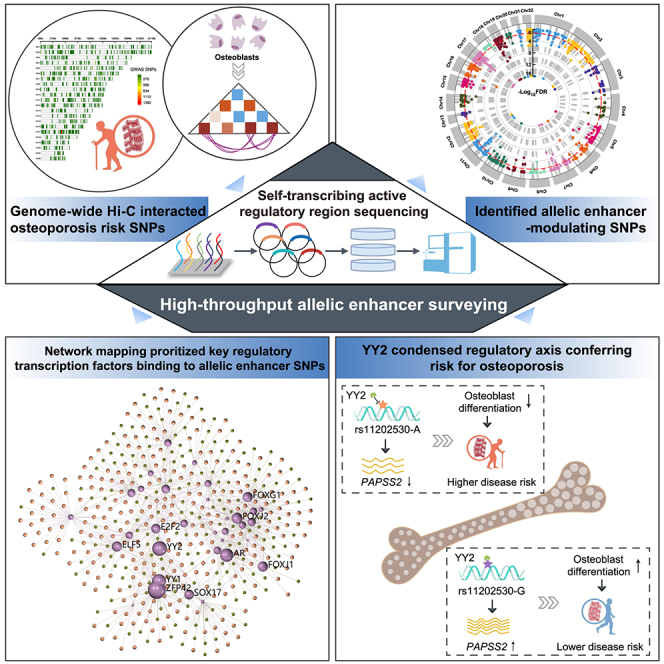
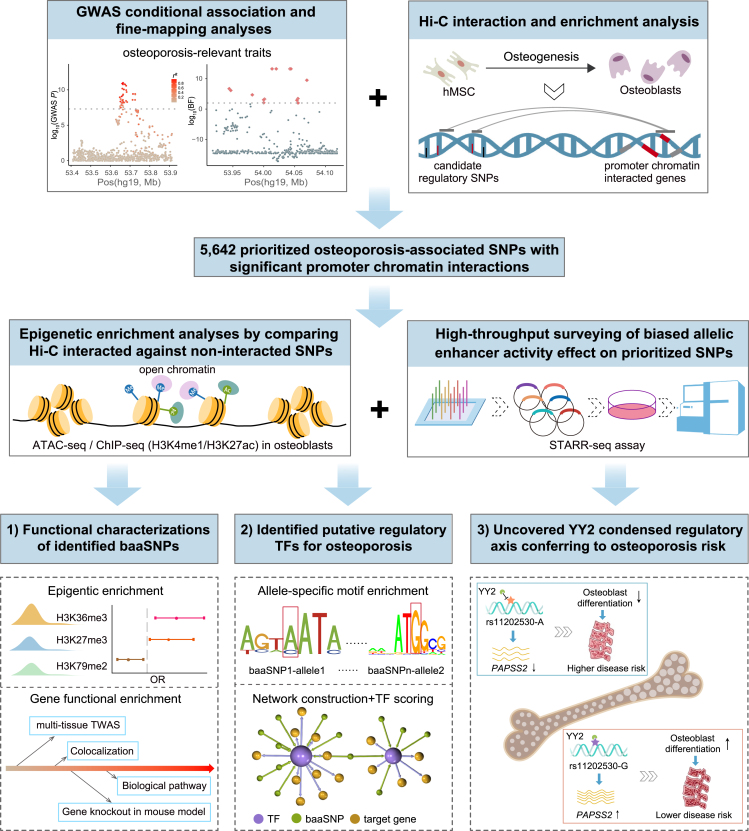
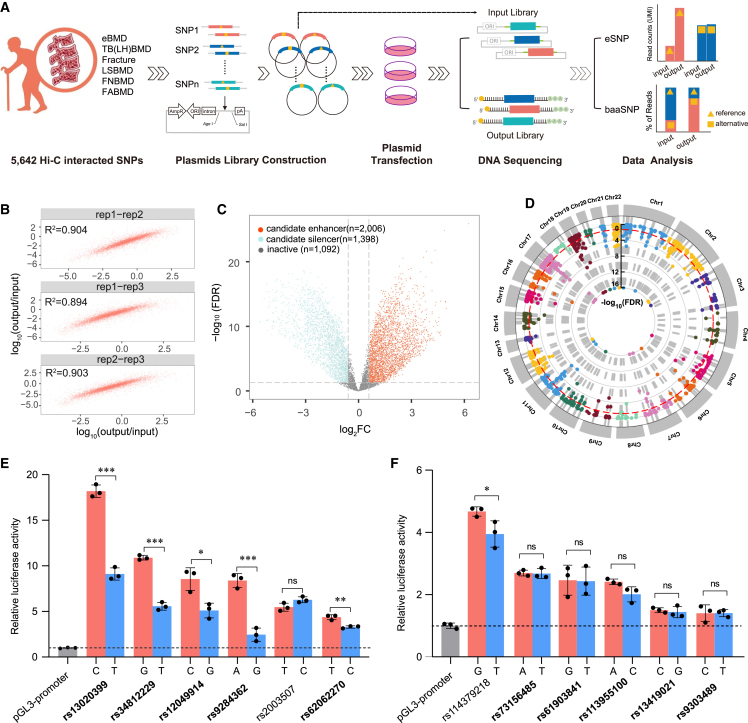
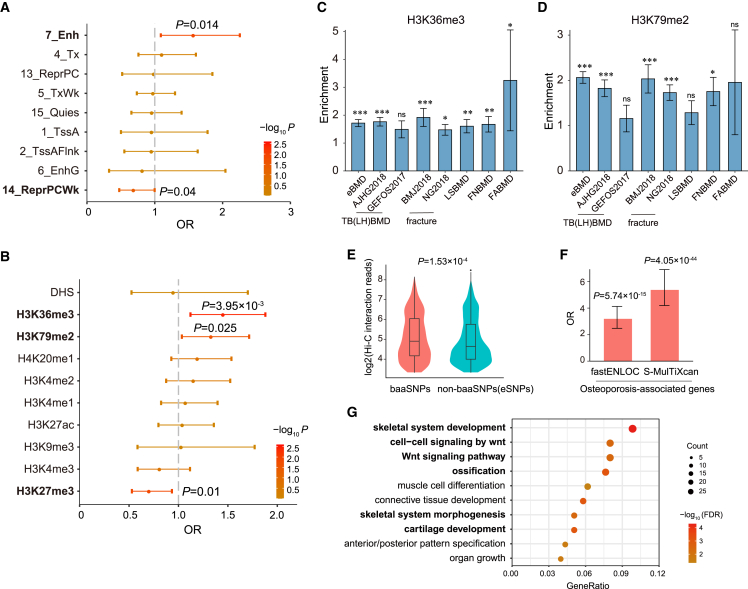
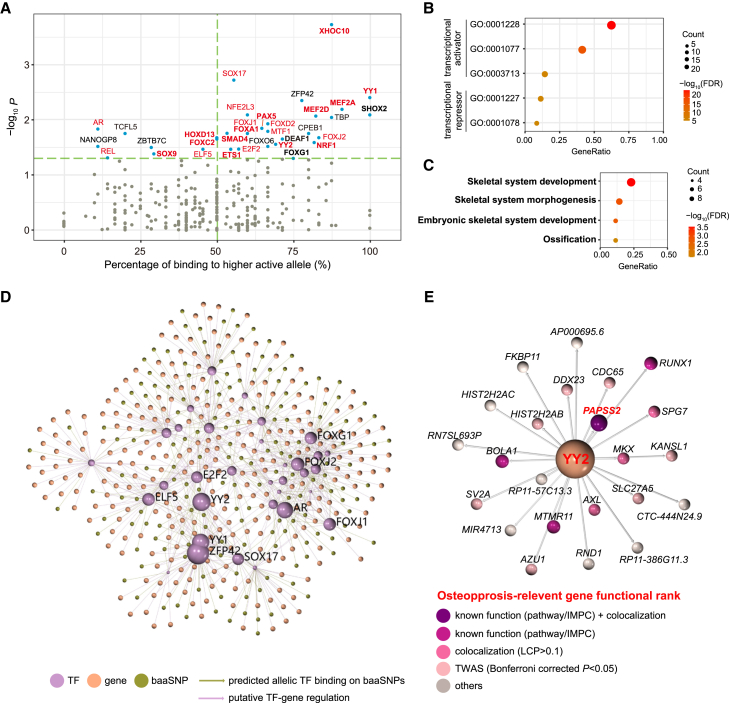
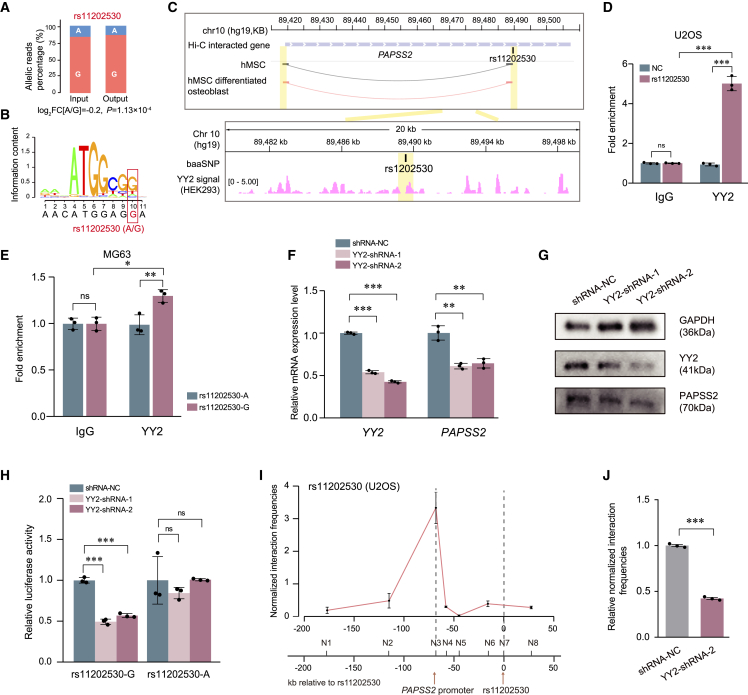
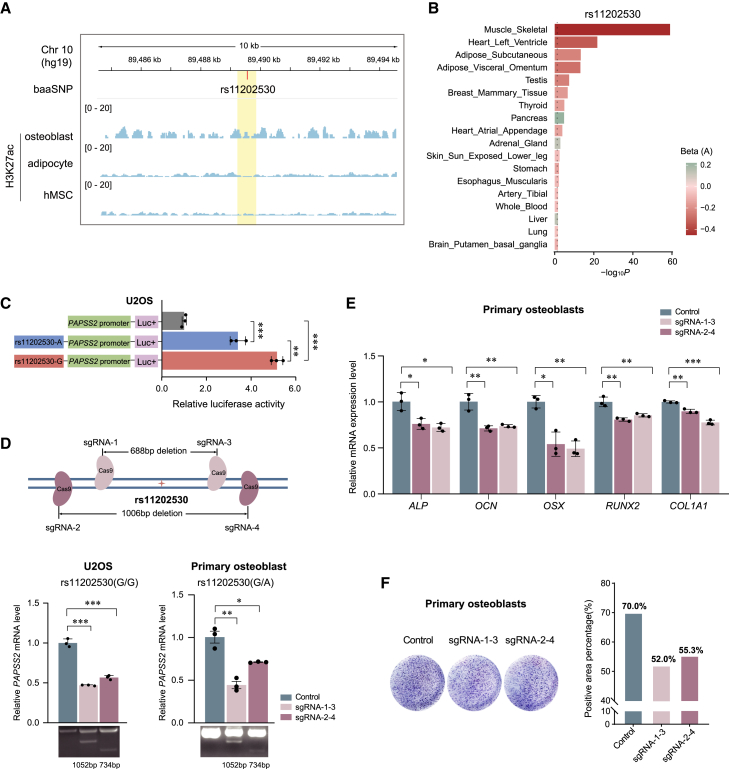
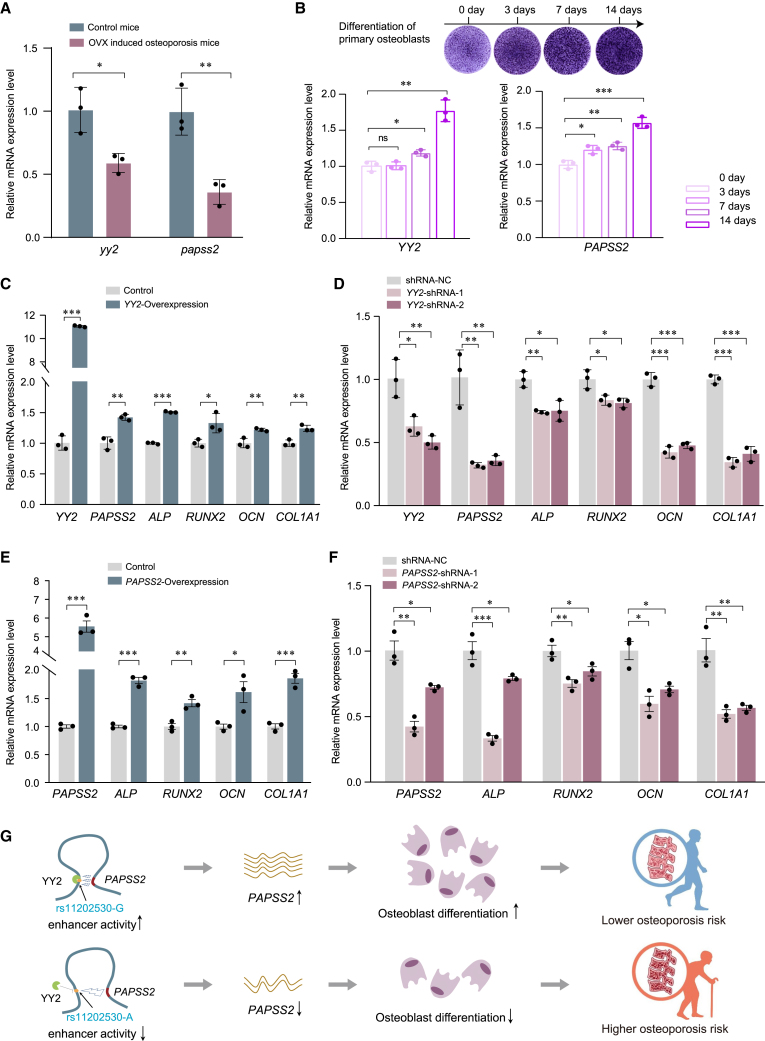
The precise roles of chromatin organization at osteoporosis risk loci remain largely elusive. Here, we combined chromatin interaction conformation (Hi-C) profiling and self-transcribing active regulatory region sequencing (STARR-seq) to qualify enhancer activities of prioritized osteoporosis-associated single-nucleotide polymorphisms (SNPs). We identified 319 SNPs with biased allelic enhancer activity effect (baaSNPs) that linked to hundreds of candidate target genes through chromatin interactions across 146 loci. Functional characterizations revealed active epigenetic enrichment for baaSNPs and prevailing osteoporosis-relevant regulatory roles for their chromatin interaction genes. Further motif enrichment and network mapping prioritized several putative, key transcription factors (TFs) controlling osteoporosis binding to baaSNPs. Specifically, we selected one top-ranked TF and deciphered that an intronic baaSNP (rs11202530) could allele-preferentially bind to YY2 to augment PAPSS2 expression through chromatin interactions and promote osteoblast differentiation. Our results underline the roles of TF-mediated enhancer-promoter contacts for osteoporosis, which may help to better understand the intricate molecular regulatory mechanisms underlying osteoporosis risk loci.

Keywords: Hi-C; PAPSS2; STARR-seq; YY2; chromatin interaction; enhancer; genetic regulatory network; osteoblast differentiation; osteoporosis; transcription factor.


Conflict of interest statement

Declaration of interests The authors declare no competing interests.

Figures

None
Graphical abstract
Figure 1
Figure 1
Schematic for the whole study design Flowchart depicts high-throughput screening for osteoporosis-associated regulatory SNPs with biased allelic enhancer activity effect (baaSNPs), followed by functional characterizations on identified baaSNPs and TF regulatory network analyses, as well as experimental decryption of YY2-condensed regulatory axis conferring risk for osteoporosis. BF: Bayes factor, Hi-C: high-throughput chromatin interaction conformation, hMSC: human mesenchymal stem cell, STARR-seq: self-transcribing active regulatory region sequencing, OR: odds ratio, TF: transcription factor.
Figure 2
Figure 2
High-throughput identification of osteoporosis-associated regulatory SNPs with allelic-biased enhancer activity effect (A) Schematization of high-throughput assessment of allelic enhancer activity effect on 5,642 promoter chromatin interaction osteoporosis-associated SNPs by STARR-seq. TB(LH)BMD: total body or total body less head BMD, FABMD: forearm BMD, FNBMD: femoral neck BMD, LSBMD: lumbar spine BMD, eBMD: quantitative heel ultrasound BMD. (B) Paired Pearson correlation of logarithmic read count ratio of input/output between three biological replications (p < 2.2 × 10−16). (C) Volcano plot displays regulatory activities for all SNP allele-containing fragments in STARR-seq assay. FC (fold change) represents expression change in output compared with input. SNP fragments with significantly reinforced (log2FC > 0.585, FDR < 0.05) or repressed expression (log2FC < −0.585, FDR < 0.05) analyzed by voom were determined as candidate enhancers (orange circle) or silencers (blue circle), respectively. The rest of the fragments were declared as inactive fragments (gray circle). (D) Circle diagrams depict significance level (–log10FDR) of allelic regulatory activity difference on SNPs showing enhancer activity on at least one allele (eSNP) analyzed by MPRAnalyze. (E and F) Dual-luciferase reporter assay measuring relative activity on six randomly selected baaSNPs (E) or six randomly selected non-baaSNPs (but eSNPs) (F) in U2OS cells. (∗p < 0.05, ∗∗p < 0.01, ∗∗∗p < 0.001, ns: not significant, two-tailed paired Student’s t test). Data are presented as mean ± standard deviation. All red bars represent the alleles that had relative higher activities in STARR-seq. SNPs with consistent measured activities in luciferase reporter assay were marked in bold.
Figure 3
Figure 3
Functional characterizations on baaSNPs and their promoter chromatin interaction genes (A and B) Comparison of percentage of baaSNPs against inactive SNPs overlying chromatin segments (HMM15) (A) or different histone peak regions (B) in osteoblast cells. Odds ratios (ORs) with 95% confidence interval were shown with significant markers marked in bold (two-sided Fisher’s exact test). (C and D) Estimates of heritability and standard errors by S-LDSC across multiple osteoporosis-relevant traits in peaks of two significantly higher enriched markers (H3K36me3, H3K79me2) in osteoblast cells in (B). Enrichment results are separated by trait (∗∗p < 0.01, ∗∗∗p < 0.001, ns: not significant). (E) Violin plot shows comparison of logarithmically significant Hi-C chromatin interaction reads linking gene promoter to baaSNPs against non-baaSNPs (Wilcoxon rank-sum test). (F) Comparison of percentage of candidate osteoporosis genetically regulatory genes supported by fastENLOC (LCP > 0.1) or S-MulTiXcan (Bonferroni corrected p < 0.05) on promoter chromatin interaction genes or all nearby genes (1,000 kb surrounding) of baaSNPs. Data are presented as mean ± standard deviation. ORs with 95% confidence interval were shown (one-sided Fisher’s exact test). (G) Bar diagram depicts top 10 significantly enriched (FDR < 0.05) Gene Ontology (GO) biological processes on promoter chromatin interaction genes of baaSNPs. Pathways related to skeletal development or osteoblast differentiation were marked in bold.
Figure 4
Figure 4
Motif enrichment and regulatory network analyses prioritized YY2 as one putative controlling TF for osteoporosis (A) Scatterplot depicts enrichment analyses of predicted allele-specific binding motifs on baaSNPs against inactive SNPs by one-sided Fisher’s exact test. The green dotted line indicated criteria for retaining nominally significant TFs (p < 0.05, OR > 1). All TFs annotated within GO molecular functions related to transcriptional activator/coactivator activity were marked in red. TFs with known roles in osteoblast differentiation or bone metabolism were marked in bold. (B) Bar diagram depicts comparison of significantly enriched GO molecular function terms related to transcriptional activator/coactivator or transcriptional repressor/corepressor on all enriched TFs in (A). (C) Bar diagram depicts selected enriched GO biological processes related to skeletal system development (FDR < 0.05) on all enriched TFs in (A). (D) Network diagram connecting baaSNPs to 33 significantly enriched TFs and their putative regulatory effecter genes. The sizes of TF nodes represent their calculated combined weighting scores (STAR Methods). Network was visualized using Graphia with top 10 highest scored TFs marked. (E) Extracted TF-gene interaction subnetwork of YY2 from (D). The colors of gene nodes represent different osteoporosis-relevant functional supports. One gene (PAPSS2) with all three types of functional support was highlighted in red.
Figure 5
Figure 5
YY2 preferentially binds to rs11202530-G to strengthen its enhancer effect on PAPSS2 expression (A) Bar shows comparison of allelic expression ratio of rs11202530 between STARR-seq output and input library samples evaluated by MPRAnalyze. (B) Graphic representation of rs11202530-G resides within YY2 DNA-binding motif predicted by FIMO from MEME Suite toolkit. (C) Comparison of significant Hi-C chromatin interactions linking rs11202530 to PAPSS2 promoter region in hMSCs or hMSC-differentiated osteoblasts or adipose tissue (no significant interaction). Genomic region surrounding rs11202530 was zoomed in with track of ChIP-seq signals on YY2 in HEK293 cell from ENCODE depicted below. (D) ChIP-qPCR results of YY2 binding at rs11202530 region in U2OS cells. Primers specifically targeting rs11202530 or RPL30 exon region (negative control [NC]) were used. The binding efficiency of YY2 is shown as fold enrichment over IgG. (E) Allele-specific ChIP-qPCR indicated allele-specific binding of YY2 binding at rs11202530 in MG63. Primers specifically targeting rs11202530-A or G were used. (F) RT-qPCR assay revealed the effect of YY2 knockdown on PAPSS2 expression by two independent shRNAs in U2OS cells. (G) Western blotting analysis showed the effect of YY2 knockdown on PAPSS2 expression in U2OS cells. GAPDH was used as loading control. (H) Dual-luciferase reporter assay comparing regulatory activity on PAPSS2 promoter inserted by rs11202530-G or rs11202530-A co-transfected with two independent shRNAs of YY2 or shRNA-NC in U2OS cells. (I) Chromosome conformation capture (3C) assay in U2OS cells. Normalized chromatin interaction frequencies between rs11202530 region as the anchor point (N7) and PAPSS2 promoter region (N4) or six other neighboring Hind III sites as negative controls (N1, N2, N3, N5, N6, and N8). (J) 3C assay shows comparison of normalized interaction frequency differences between rs11202530 region and PAPSS2 promoter region in YY2-inhibited (YY2-shRNA-2) and control (shRNA-NC) U2OS cells. Data are presented as mean ± standard deviation in (D)–(F) and (H)–(J), ∗p < 0.05, ∗∗p < 0.01, ∗∗∗p < 0.001, ns: not significant, two-tailed paired Student’s t test.
Figure 6
Figure 6
Rs11202530 acts as an allele-biased enhancer to regulate PAPSS2 expression and osteoblast differentiation (A) Comparison of H3K27ac histone modification in hMSCs or hMSC-differentiated osteoblasts or adipose tissue surrounding rs11202530. (B) Bar diagrams display all significant cis-QTL associations (p < 0.05 by linear model controlling for covariates) between genotypes of rs11202530 and PAPSS2 expression from GTEx (V8), and effect sizes are indicated by shade of colors. (C) Dual-luciferase reporter assay shows allelic-biased enhancer activity effect on rs11202530 compared with pGL3-PAPSS2-promoter in U2OS cells. Luciferase signal was computed as the ratio of firefly luciferase activity to Renilla signal, and relative activity was normalized by pGL3-PAPSS2-promoter. (D) RT-qPCR shows effect of deletion of the genomic region surrounding rs11202530 by CRISPR-Cas9 on PAPSS2 expression at mRNA level in U2OS or human primary osteoblasts isolated from healthy cancellous bone tissue (STAR Methods). The upper cartoon shows relative position of targeting sites for different pairs of sgRNAs. The bottom gel showed the deletion efficiency of two paired sgRNAs by amplifying a flanking region of 1740 bp (rs11202530) and validated the truncated short regions by PCR. (E) RT-qPCR displays effect of deletion of the genomic region surrounding rs11202530 by CRISPR-Cas9-decreased expression of osteoblast differentiation marker gene expression (ALP, OCN, OSX, RUNX2, and COL1A1) at mRNA level in human primary osteoblasts. (F) Alkaline phosphatase (ALP) staining revealed the effect of deletion of the region surrounding rs11202530 by CRISPR-Cas9 on ALP activity in human primary osteoblasts. The ALP staining results were analyzed using ImageJ software. Data are presented as mean ± standard deviation in (C)‒(E), ∗p < 0.05, ∗∗p < 0.01, ∗∗∗p < 0.001, ns: not significant, two-tailed paired Student’s t test.
Figure 7
Figure 7
YY2 may play roles in promoting human osteoblast differentiation through positive regulation of PAPSS2 (A) RT-qPCR shows comparison of Yy2 and Papss2 expression between ovariectomy (OVX)-induced osteoporosis mice (females, n = 3) and control normal mice with parietal ovarian fat tissue removed (females, n = 3). (B) RT-qPCR shows expression change of YY2 and PAPSS2 in isolated human primary osteoblasts after differentiation for 3, 7, or 14 days (STAR Methods). The upper ALP staining displays ALP activity change in osteoblasts after differentiation for different days. (C and D) RT-qPCR shows effect of YY2 overexpression (C) or knockdown (D) on PAPSS2 or expression of several osteoblast differentiation marker genes (ALP, OCN, RUNX2, and COL1A1) at mRNA level in human primary osteoblasts. (E and F) RT-qPCR shows effect of PAPSS2 overexpression (E) or knockdown (F) on expression of several osteoblast differentiation marker genes (ALP, OCN, RUNX2, and COL1A1) at mRNA level by two independent shRNAs in human primary osteoblasts. (G) Speculative regulatory model connecting different genotypes of rs11202530 to allele-preferable binding of YY2 and modified PAPSS2 expression, osteoblast differentiation, and osteoporosis risk. Data are presented as mean ± standard deviation in (A)–(F), ∗p < 0.05, ∗∗p < 0.01, ∗∗∗p < 0.001, ns: not significant, two-tailed paired Student’s t test.

Similar articles

Cited by

References

    1. Yang T.L., Shen H., Liu A., Dong S.S., Zhang L., Deng F.Y., Zhao Q., Deng H.W. A road map for understanding molecular and genetic determinants of osteoporosis. Nat. Rev. Endocrinol. 2020;16:91–103. - PMC - PubMed
    1. Trajanoska K., Morris J.A., Oei L., Zheng H.F., Evans D.M., Kiel D.P., Ohlsson C., Richards J.B., Rivadeneira F., GEFOS/GENOMOS consortium and the 23andMe research team Assessment of the genetic and clinical determinants of fracture risk: genome wide association and mendelian randomisation study. BMJ. 2018;362:k3225. - PMC - PubMed
    1. Morris J.A., Kemp J.P., Youlten S.E., Laurent L., Logan J.G., Chai R.C., Vulpescu N.A., Forgetta V., Kleinman A., Mohanty S.T., et al. An atlas of genetic influences on osteoporosis in humans and mice. Nat. Genet. 2019;51:258–266. - PMC - PubMed
    1. Zheng H.F., Forgetta V., Hsu Y.H., Estrada K., Rosello-Diez A., Leo P.J., Dahia C.L., Park-Min K.H., Tobias J.H., Kooperberg C., et al. Whole-genome sequencing identifies EN1 as a determinant of bone density and fracture. Nature. 2015;526:112–117. - PMC - PubMed
    1. Medina-Gomez C., Kemp J.P., Dimou N.L., Kreiner E., Chesi A., Zemel B.S., Bønnelykke K., Boer C.G., Ahluwalia T.S., Bisgaard H., et al. Bivariate genome-wide association meta-analysis of pediatric musculoskeletal traits reveals pleiotropic effects at the SREBF1/TOM1L2 locus. Nat. Commun. 2017;8:121. - PMC - PubMed

MeSH terms