. 2024 Mar 12;19(3):366-382.
doi: 10.1016/j.stemcr.2024.01.002. Epub 2024 Feb 8.

ALS-related p97 R155H mutation disrupts lysophagy in iPSC-derived motor neurons

Affiliations

ALS-related p97 R155H mutation disrupts lysophagy in iPSC-derived motor neurons

Jacob A Klickstein et al. Stem Cell Reports. .

Erratum in

Abstract

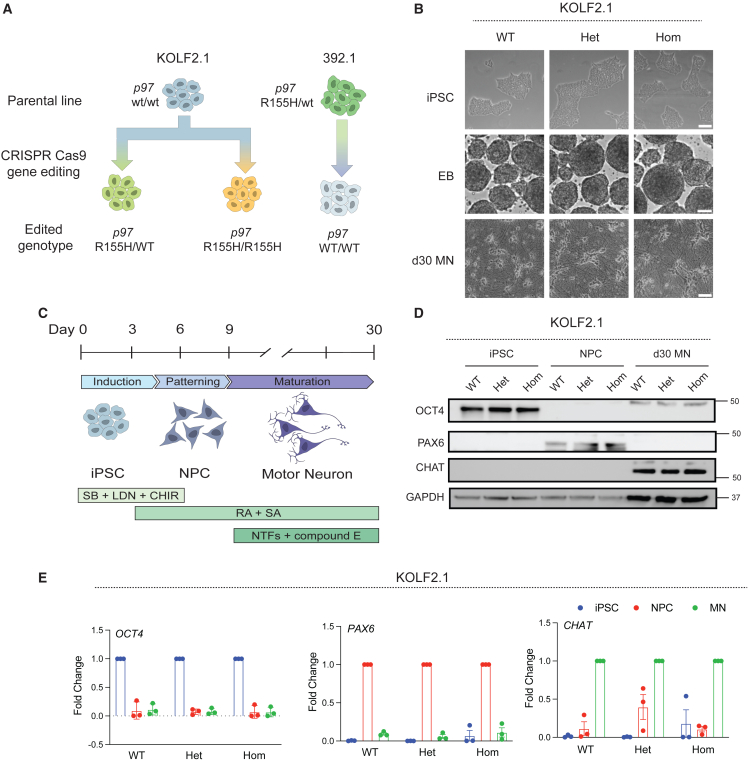
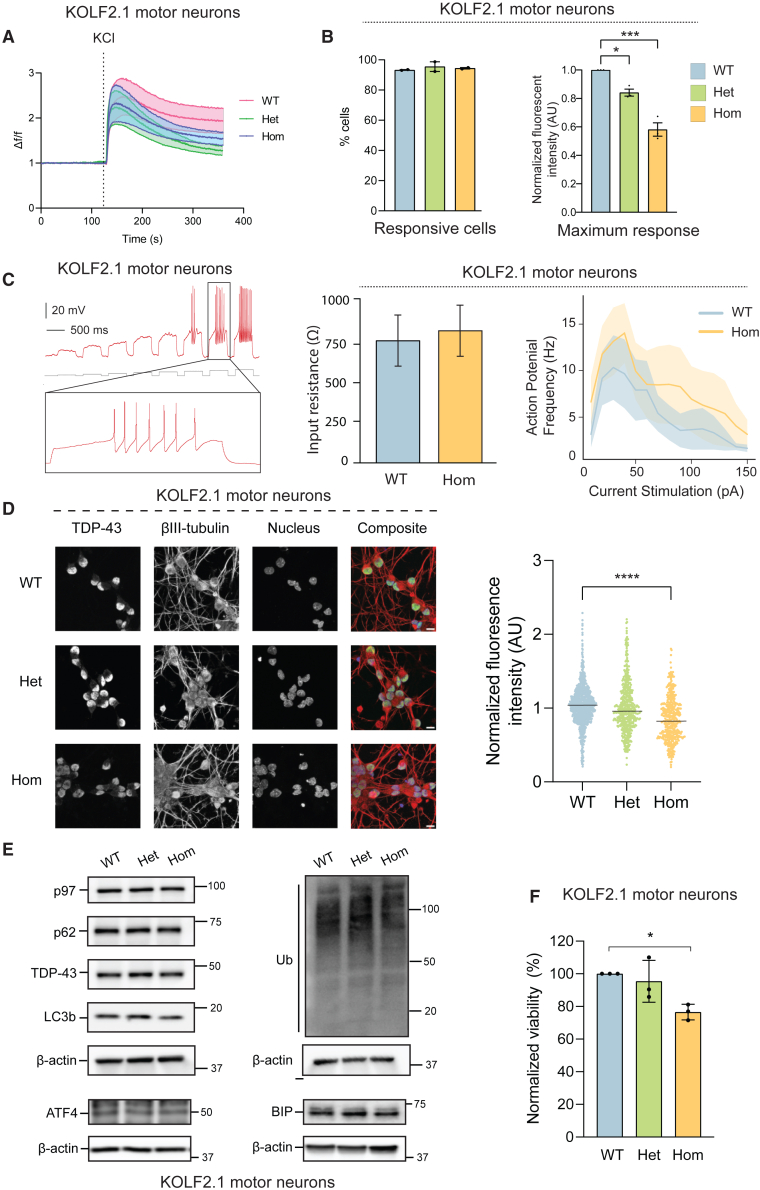
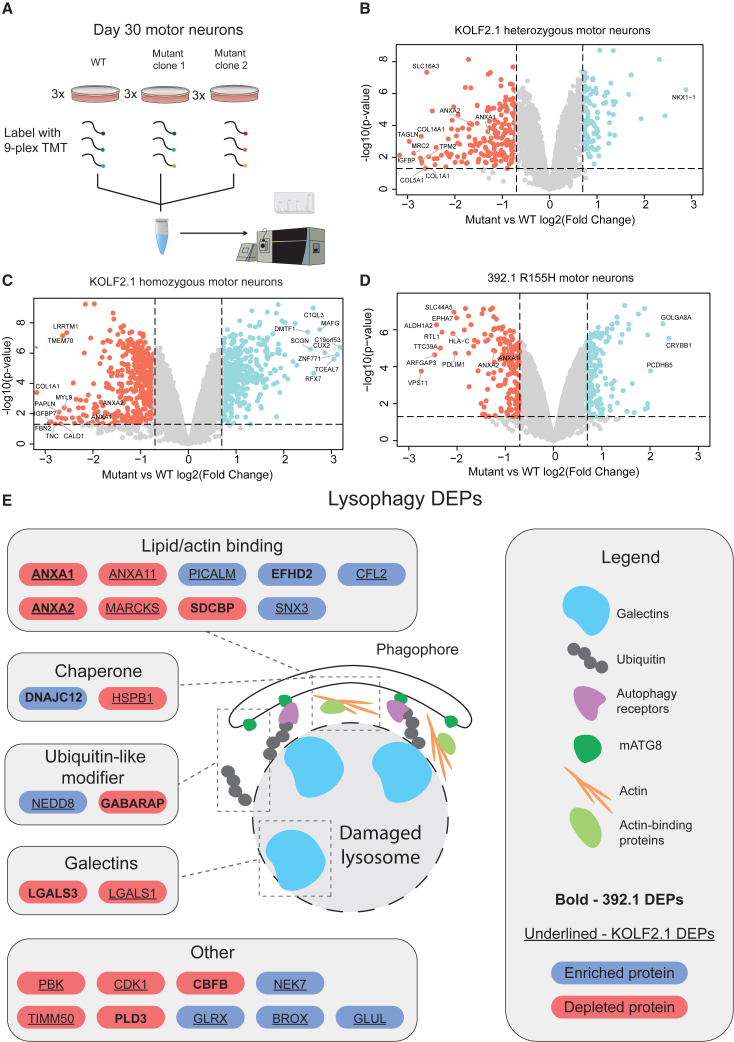
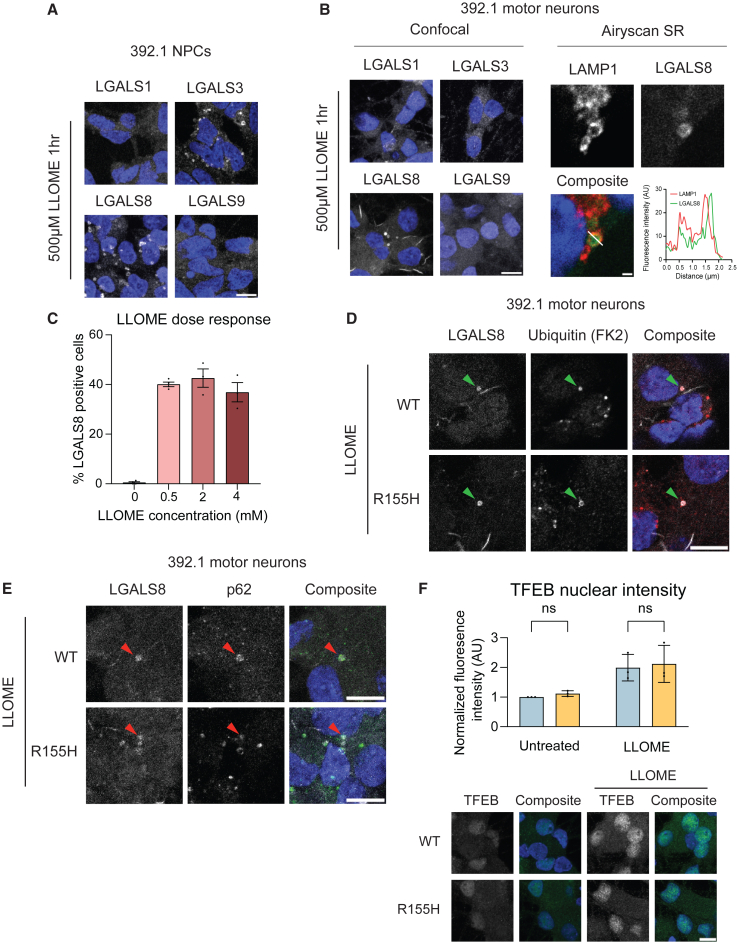
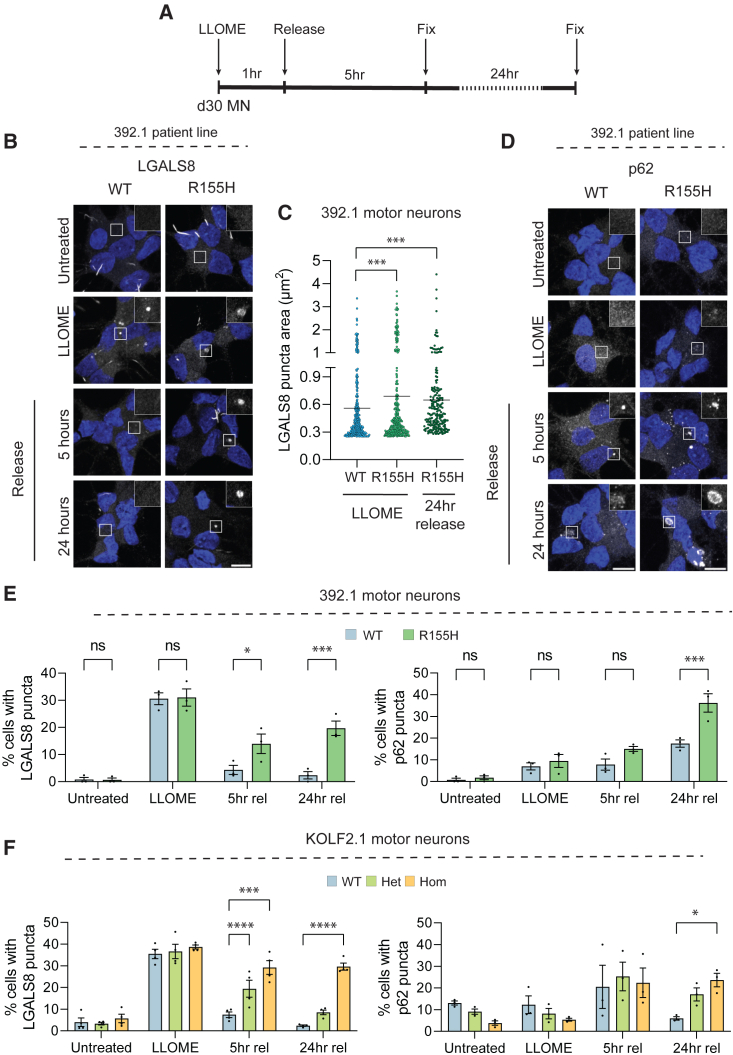
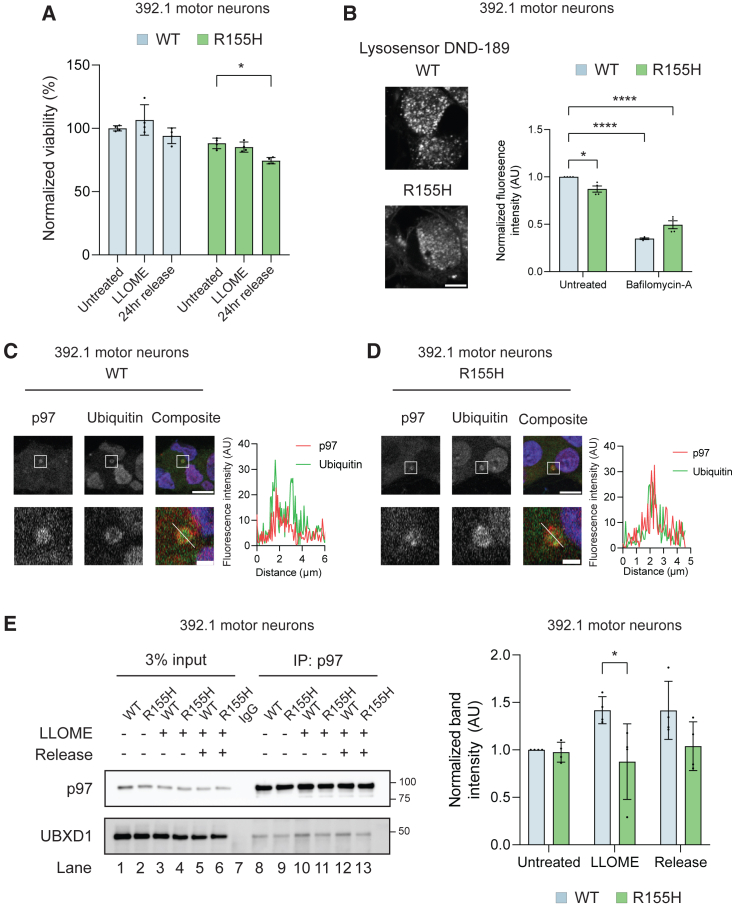
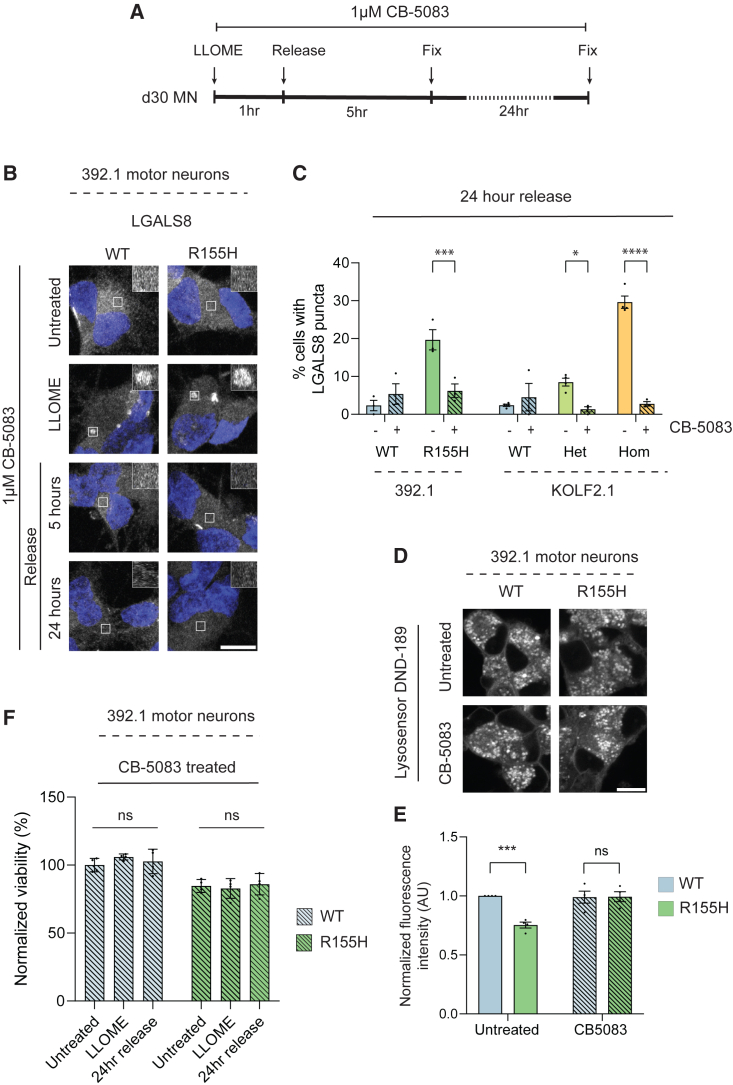
Mutations in the AAA+ ATPase p97 cause multisystem proteinopathy 1, which includes amyotrophic lateral sclerosis; however, the pathogenic mechanisms that contribute to motor neuron loss remain obscure. Here, we use two induced pluripotent stem cell models differentiated into spinal motor neurons to investigate how p97 mutations perturb the motor neuron proteome. Using quantitative proteomics, we find that motor neurons harboring the p97 R155H mutation have deficits in the selective autophagy of lysosomes (lysophagy). p97 R155H motor neurons are unable to clear damaged lysosomes and have reduced viability. Lysosomes in mutant motor neurons have increased pH compared with wild-type cells. The clearance of damaged lysosomes involves UBXD1-p97 interaction, which is disrupted in mutant motor neurons. Finally, inhibition of the ATPase activity of p97 using the inhibitor CB-5083 rescues lysophagy defects in mutant motor neurons. These results add to the evidence that endo-lysosomal dysfunction is a key aspect of disease pathogenesis in p97-related disorders.

Keywords: ALS; autophagy; galectin; lysophagy; lysosome; mitochondria; p97; proteomics.


Conflict of interest statement

Declaration of interests The authors declare no competing interests.

Figures

Figure 1
Figure 1
Characterization of IPSC-derived motor neurons (A) Two isogenic iPSC models were generated using gene editing to introduce the R155H mutation into the p97 endogenous locus (KOLF2.1) and correct the R155H mutation (392.1) to wild type. (B) Phase contrast images of iPSCs (top row), embryoid bodies (middle row), and day 30 motor neurons (bottom row). Scale bars, 50 μm (top and bottom rows) and 100 μm (middle row). (C) Schematic of the motor neuron differentiation protocol. (D) Immunoblot of iPSCs, NPCs, and day 30 motor neurons. The faster migration band in PAX6 immunoblots likely represents another isoform. (E) qPCR of wild-type, heterozygous, and homozygous KOLF2.1 iPSCs, NPCs, and motor neurons and markers for each stage. CHIR, CHIR99021; EB, embryoid body; LDN, LDN193189; MN, motor neuron; NPC, neural precursor cell; NTFs, neurotrophic factors; RA, retinoic acid; SA, smoothened agonist; SB, SB431542. See also Figures S1 and S2.
Figure 2
Figure 2
p97 R155H motor neurons recapitulate ALS phenotypes (A) Representative average Fluo-4 fluorescence values from KOLF2.1 motor neurons after 80 mM KCl stimulation (dotted line). The shaded area represents the 95% confidence interval. N = >50 cells per condition. (B) Percent of KOLF2.1 motor neurons responsive to KCl stimulation (left). Maximal normalized Fluo-4 fluorescence in motor neurons. N > 150 cells, three independent experiments per condition. (C) Sample trace from a wild-type (WT) KOLF2.1 motor neuron in response to a series of depolarizing current steps via whole-cell patch clamp (left). Input resistance from WT and homozygous motor neurons (middle). Input-output curves of motor neurons in WT and homozygous motor neurons at day 20 (right). (D) Representative images of TDP-43 immunofluorescence in KOLF2.1 motor neurons (left panels). Quantification of nuclear TDP-43 fluorescence (right). N = >5,000 cells, four independent experiments. Data points represent individual cells; lines represent means. Scale bar, 10 μm. (E) Representative immunoblots of TDP-43, autophagy markers (p62, LC3b), ER stress markers (ATF4, BIP), and total ubiquitylated proteins (Ub) in KOLF2.1 motor neurons. N = 3 independent experiments. (F) Normalized viability of KOLF2.1 motor neurons at day 30. All data expressed as means ± SEM unless otherwise indicated. p < 0.05, ∗∗p < 0.01, ∗∗∗p < 0.001, ∗∗∗∗p < 0.0001. One-way ANOVA with Dunnett’s multiple comparison test (B, D, F). See also Figure S3.
Figure 3
Figure 3
Quantitative proteomics identifies autophagy defects in p97 R155H motor neurons (A) Schematic of the experimental setup for the KOLF2.1 cells. Three replicates each of wild type (WT) and two clones of heterozygous or homozygous p97 R155H motor neurons were used in two 9-plex TMT experiments. Three replicates of WT and p97 R155H 392.1 motor neurons were used for a 6-plex TMT experiment. (B–D) Volcano plots for the indicated cell line. Cutoff values of 0.7 log2 fold change and 0.05 p value were used to determine differentially expressed proteins (DEPs). (E) Lysophagy-related proteins that were significantly altered in R155H motor neurons. Red and blue backgrounds indicate depleted and enriched proteins, respectively. See also Figures S4 and S5.
Figure 4
Figure 4
Motor neurons preferentially recruit LGALS8 to ubiquitylated lysosomes (A) Representative images of galectin immunofluorescence in NPCs following 1 h of 500-μM LLOME treatment. N = 2 independent experiments. Scale bar, 10 μm. (B) Representative images of galectin immunofluorescence in motor neurons following 1 h of 500-μM LLOME (left). Airyscan images of motor neurons following LLOME treatment co-stained with LAMP1 and LGALS8 show colocalization (right). N = 2 independent experiments. Scale bars, 10 μm (left) and 1 μm (right). (C) Percent cells with LGALS8 puncta after 1 h of LLOME at indicated doses. N = 3 independent experiments. (D and E) Representative images of LLOME-treated motor neurons co-stained for LGALS8 and ubiquitin (D) or p62 (E) demonstrating colocalization. N = 3 independent experiments. Scale bar, 10 μm. (F) Representative images of TFEB staining. Quantification of nuclear TFEB fluorescence intensity. Scale bar, 10 μm. N = 3 independent experiments. All data expressed as means ± SEM. ns = nonsignificant. One-way ANOVA with Dunnett’s multiple comparison test (C, F). See also Figure S6.
Figure 5
Figure 5
p97 R155H motor neurons are unable to clear damaged lysosomes and accumulate p62 following LLOME treatment (A) Schematic of experimental design. Day 30 motor neurons were fixed either before LLOME treatment, directly after treatment, or 5 and 24 h after release. (B) Representative images of 392.1 motor neurons stained for LGALS8 before, during, and after LLOME treatment. Scale bar, 10 μm. (C) LGALS8 puncta size in wild-type and R155H 392.1 motor neurons following LLOME treatment and release. Data expressed as individual LGALS8 puncta; lines represent means. (D) Representative images of 392.1 motor neurons stained for p62. Scale bar, 10 μm. (E) Quantification of (B) (left) and (C) (right) in 392.1 motor neurons. N = 3 independent experiments. (F) Quantification of LGALS8 puncta (left) and p62 puncta (right) in KOLF2.1 motor neurons. N = 3 independent experiments. D30 MN – day 30 motor neurons. 5h rel – 5-h release, 24h rel – 24-h release. Data expressed as means ± SEM unless otherwise indicated. ns = nonsignificant, p < 0.05, ∗∗p < 0.01, ∗∗∗p < 0.001, ∗∗∗∗p < 0.0001. One-way ANOVA with Sidak’s multiple comparison test (B). Two-way ANOVA with Sidak’s (E) or Dunnett’s (F) multiple comparison test. See also Figure S6.
Figure 6
Figure 6
p97 R155H sensitizes motor neurons to lysosomal damage, decreases lysosomal acidity, and disrupts UBXD1 recruitment (A) Normalized viability in 392.1 motor neurons in untreated, LLOME treated, or after release. N = 4 independent experiments. (B) Representative images of LysoSensor DND-189 live-cell imaging in 392.1 motor neurons (left). Quantification of DND-189 fluorescence in untreated and bafilomycin-A treated cells. N = 4 independent experiments. Scale bar, 5 μm. (C and D) Representative images of wild-type (C) and p97 R155H (D) 392.1 motor neurons co-stained with p97 and ubiquitin showing colocalization (left). Line graph of the fluorescence intensity of p97 and ubiquitin as indicated in the bottom right image panel. N = 3 independent experiments. Scale bars, 10 μm (upper panels) and 1 μm (lower panels). (E) Immunoblot of endogenous p97 immunoprecipitation in 392.1 motor neurons before, during, and after LLOME treatment (left). Release condition represents 5 h of recovery. Quantification of UBXD1 band intensities normalized to immunoprecipitated p97 (left). Data expressed as normalized band intensities ±SD. N = 4 independent experiments. All data expressed as means ± SEM unless otherwise indicated. p < 0.05, ∗∗p < 0.01, ∗∗∗p < 0.001, ∗∗∗∗p < 0.0001. Two-way ANOVA with Dunnett’s (A) or Sidak’s (B, E) multiple comparison test. See also Figure S6.
Figure 7
Figure 7
p97 inhibition rescues persistence of damaged lysosomes (A) Schematic of experimental design. (B) Representative images LGALS8 puncta in 392.1 motor neurons in untreated, LLOME treated, or after release. All conditions contain CB-5083. Scale bar, 10 μm. (C) Quantification of LGALS8 puncta in 392.1 and KOLF2.1 motor neurons 24 h after LLOME treatment with and without CB-5083 co-treatment. N = 3 independent experiments. (D) Representative images of LysoSensor DND-189 live-cell imaging in untreated and CB-5083-treated 392.1 motor neurons. (E) Quantification of DND-189 fluorescence in untreated (solid bars) and CB-5083 treated (shaded bars) motor neurons. N = 4 independent experiments. Scale bar, 10 μm. (F) Quantification of 392.1 motor neuron viability before, during, and after LLOME and CB-5083 co-treatment. N = 4 independent experiments. All data expressed as means ± SEM unless otherwise indicated. p < 0.05, ∗∗p < 0.01, ∗∗∗p < 0.001, ∗∗∗∗p < 0.0001. Two-way ANOVA with Sidak’s (C, D) or Dunnett’s (F) multiple comparison test. See also Figure S7.

References

    1. Ahlstedt B.A., Ganji R., Raman M. The functional importance of VCP to maintaining cellular protein homeostasis. Biochem. Soc. Trans. 2022;50:1457–1469. - PMC - PubMed
    1. Aits S., Kricker J., Liu B., Ellegaard A.-M., Hämälistö S., Tvingsholm S., Corcelle-Termeau E., Høgh S., Farkas T., Holm Jonassen A., et al. Sensitive detection of lysosomal membrane permeabilization by lysosomal galectin puncta assay. Autophagy. 2015;11:1408–1424. - PMC - PubMed
    1. Al-Obeidi E., Al-Tahan S., Surampalli A., Goyal N., Wang A.K., Hermann A., Omizo M., Smith C., Mozaffar T., Kimonis V. Genotype-phenotype study in patients with VCP valosin-containing protein mutations associated with multisystem proteinopathy. Clin. Genet. 2018;93:119–125. - PMC - PubMed
    1. Anderson D.J., Le Moigne R., Djakovic S., Kumar B., Rice J., Wong S., Wang J., Yao B., Valle E., Kiss von Soly S., et al. Targeting the AAA ATPase p97 as an approach to treat cancer through disruption of protein homeostasis. Cancer Cell. 2015;28:653–665. - PMC - PubMed
    1. Arhzaouy K., Papadopoulos C., Schulze N., Pittman S.K., Meyer H., Weihl C.C. VCP maintains lysosomal homeostasis and TFEB activity in differentiated skeletal muscle. Autophagy. 2019;15:1082–1099. - PMC - PubMed

Publication types

Substances