. 2024 Mar 12;19(3):317-330.
doi: 10.1016/j.stemcr.2024.01.003. Epub 2024 Feb 8.

ER stress and lipid imbalance drive diabetic embryonic cardiomyopathy in an organoid model of human heart development

Affiliations

ER stress and lipid imbalance drive diabetic embryonic cardiomyopathy in an organoid model of human heart development

Aleksandra Kostina et al. Stem Cell Reports. .

Abstract

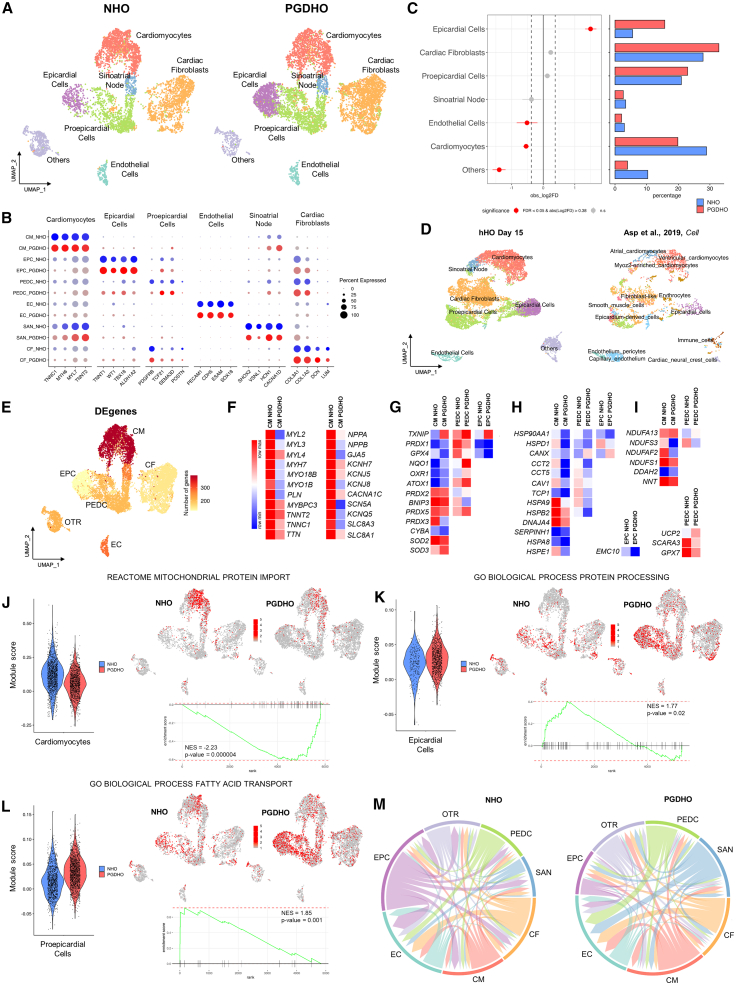
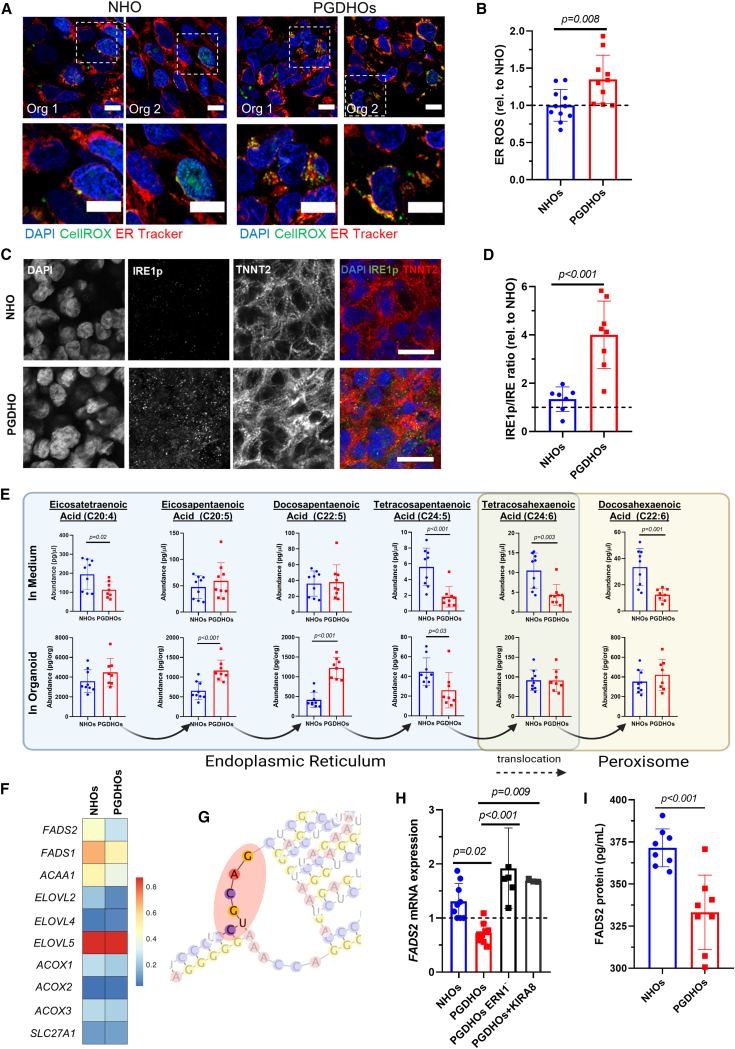
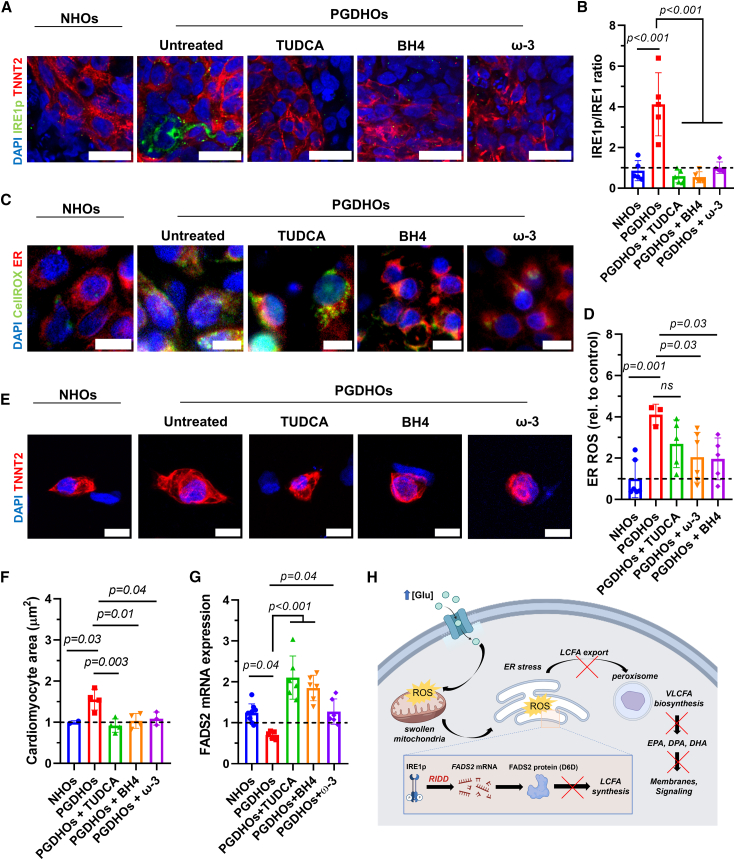
Congenital heart defects are the most prevalent human birth defects, and their incidence is exacerbated by maternal health conditions, such as diabetes during the first trimester (pregestational diabetes). Our understanding of the pathology of these disorders is hindered by a lack of human models and the inaccessibility of embryonic tissue. Using an advanced human heart organoid system, we simulated embryonic heart development under pregestational diabetes-like conditions. These organoids developed pathophysiological features observed in mouse and human studies before, including ROS-mediated stress and cardiomyocyte hypertrophy. scRNA-seq revealed cardiac cell-type-specific dysfunction affecting epicardial and cardiomyocyte populations and alterations in the endoplasmic reticulum and very-long-chain fatty acid lipid metabolism. Imaging and lipidomics confirmed these findings and showed that dyslipidemia was linked to fatty acid desaturase 2 mRNA decay dependent on IRE1-RIDD signaling. Targeting IRE1 or restoring lipid levels partially reversed the effects of pregestational diabetes, offering potential preventive and therapeutic strategies in humans.

Keywords: congenital heart defects; heart development; heart organoid; omega-3 fatty acid; pluripotent stem cell; pregestational diabetes; very-long-chain fatty acid.


Conflict of interest statement

Declaration of interests The authors declare no competing interests.

Figures

None
Graphical abstract
Figure 1
Figure 1
Human heart organoids recapitulate phenotypic hallmarks of PGD in the developing human heart (A) Immunofluorescence images of CMs from NHOs and PGDHOs stained with the CM marker TNNT2 (red) and the nuclear marker DAPI (blue); scale bar: 10 μm. (B) Quantification of CM area from NHOs and PGDHOs; n = 4 organoids, n = 145 CMs for NHOs and n = 193 CMs for PGDHOs; nested t test. (C) Immunofluorescence of mitochondria using MitoTracker showing mitochondrial swelling in PGDHOs; arrowheads indicate swollen mitochondria; scale bar: 10 μm. (D) Quantification of mitochondrial swelling in NHOs and PGDHOs; n = 4; nested t test. (E) Live ROS imaging using CellROX Green; scale bar: 10 μm. (F) Quantification of ROS content in NHOs and PGDHOs; n = 3; nested t test. (G–M) Time course qRT-PCR gene expression analysis of key developmental transcription factors (G–K) and glucose transporters (L and M) from days 0 to 14 of differentiation; n = 9 (3 biological replicates of 3 pooled organoids). (O) Calcium transient live imaging using Fluo-4 from NHOs (left) and PGDHOs (right). (P) Quantification of beats per minute in NHOs and PGDHOs; n = 7; value = mean ± SD, unpaired t tests.
Figure 2
Figure 2
scRNA-seq reveals cardiac cell-type-specific responses to PGD in human heart organoids (A) Uniform manifold approximation and projection (UMAP) showing the integrated cell map, which consists of 7 clusters. Clusters were annotated based on known marker genes. Cells are colored by clusters. A total of 5,951 cells from 4 pooled dissociated NHO organoids and 7,463 cells from 4 pooled dissociated PGDHO organoids were sequenced. (B) Dot plot depicting representative marker genes across cell clusters. Dot size is proportional to percentage of cells in the cluster expressing specific genes. Color indicates samples NHOs (blue) and PGDHOs (red). Color intensity indicates average expression. (C) Left: Relative differences in cell proportion for each cluster between NHOs and PGDHOs. Clusters colored red have a false discovery rate <0.05 and mean |log2 fold enrichment| > 0.38 compared to NHOs (permutation test; n = 10,000). Right: Bar plot displaying the cell-type abundance for NHOs and PGDHOs. Color bars indicate samples NHOs (blue) and PGDHOs (red). (D) UMAP projection of integrated heart organoid dataset (left) and 6.5 PCW (or ∼45 days postconception) human embryonic heart dataset (right). The color corresponds to the cell annotation identified for organoids (left UMAP) or taken from the respective publication (right UMAP). (E) UMAP displaying the number of DEGs in each cell type. (F–I) Heatmaps of DEGs in CM, EPC, and PEDC clusters. Data displayed as log2 and quantile normalized counts based on pseudobulk differential expression analysis. (J–L) Pathway enrichment analysis (fast gene set enrichment analysis–multilevel defining representation of DEGs in pathways from database MsigDB) in PGDHOs versus NHOs in CM (J), EPC (K) and PEDC (L) clusters. Violin plots depicting cells per sample by gene set module score. Feature plots displaying enrichment of pathway gene sets in cell populations. Enrichment plots of pathway-related gene sets overrepresented in NHOs and PGSHOs. NES, enrichment score normalized to mean enrichment of random samples of the same size (value represents the enrichment score after normalization). (M) Summary chord diagrams of cell-type interactions; strong decrease in the number of interactions from EPCs toward all other cell types.
Figure 3
Figure 3
PGD conditions trigger ER stress and VLCFA lipid imbalance in human heart organoids (A) Immunofluorescence images of day 14 NHOs and PGDHOs showing colocalization of ROS (CellROX, green) and ER marker (ER Tracker, red); nuclear marker DAPI (blue); scale bar: 10 μm. (B) Quantification ROS localized in the ER; n = 10 organoids per condition; value = mean ± SD, unpaired t tests. (C) Immunofluorescence images of day 14 NHOs and PGDHOs stained for phosphorylated IRE1 (IRE1p, green), CM marker TNNT2 (red), and nuclear marker DAPI; n = 6; scale bar: 20 μm. (D) Quantification of the ratio of phosphorylated IRE1 to unphosphorylated IRE1 compared to NHOs, measured by immunofluorescence image analysis; n = 7 for NHOs, n = 8 for PGDHOs; value = mean ± SD, unpaired t tests. (E) LC-MS lipidomic analysis for VLCFA concentrations from day 15 organoids and their corresponding medium; n = 9 organoids per condition, value = mean ± SD, unpaired t test, p < 0.05. Arrows indicate the direction of biosynthetic pathway of VLCFA, their transformation through elongation, and desaturation. (F) Heatmap representing expression level of key enzymes involved in LCFA and VLCFA biosynthesis. (G) Predicted secondary FADS2 mRNA structure. (H) qRT-PCR gene expression analysis of FADS2; n = 6 and n = 3 biological replicates of 3 pooled organoids for ERN1 knockdown and KIRA8 respectively; value = mean ± SD. (I) FADS2 protein measurement by ELISA; n = 8 organoids per condition; value = mean ± SD.
Figure 4
Figure 4
Strategies to reduce ER stress and lipid imbalance mitigate the deleterious effects of PGD in human heart organoids (A) Immunofluorescence images of day 14 NHOs and PGDHOs treated with TUDCA, BH4, or omega-3 FAs, stained with phosphorylated IRE1 (IRE1p, green), CM marker TNNT2 (red), and nuclear marker DAPI (blue); n = 6; scale bar: 25 μm. (B) Quantification of the ratio of phosphorylated IRE1 to unphosphorylated IRE1, measured by immunofluorescence image analysis; n = 6; value = mean ± SD, 1-way ANOVA. (C) Immunofluorescence images of ROS (CellROX, green) and ER marked (ER Tracker, red) in day 14 NHOs and PGDHOs; n = 7; scale bar: 10 μm. (D) Quantification of ROS content compared to NHOs; n = 6; value = mean ± SD, 1-way ANOVA. (E) Immunofluorescence images of CMs dissociated from day 14 NHOs, PGDHOs; n = 4; scale bar: 10 μm. (F) Quantification of CM area compared to NHOs; n = 4; value = mean ± SD, 1-way ANOVA. (G) qRT-PCR gene expression analysis of FADS2 in NHOs and PGDHOs; n = 6 biological replicates of 3 pooled organoids; value = mean ± SD. (H) Schematic diagram summarizing the mechanism of PGD-induced CHD.

Update of

Similar articles

Cited by

References

    1. Ahuja P., Zhao P., Angelis E., Ruan H., Korge P., Olson A., Wang Y., Jin E.S., Jeffrey F.M., Portman M., Maclellan W.R. Myc controls transcriptional regulation of cardiac metabolism and mitochondrial biogenesis in response to pathological stress in mice. J. Clin. Invest. 2010;120:1494–1505. - PMC - PubMed
    1. Al-Biltagi M., El Razaky O., El Amrousy D. Cardiac changes in infants of diabetic mothers. World J. Diabetes. 2021;12:1233–1247. - PMC - PubMed
    1. Alam M.J., Uppulapu S.K., Tiwari V., Varghese B., Mohammed S.A., Adela R., Arava S.K., Banerjee S.K. Pregestational diabetes alters cardiac structure and function of neonatal rats through developmental plasticity. Front. Cardiovasc. Med. 2022;9 - PMC - PubMed
    1. Arshad Z., Rezapour-Firouzi S., Ebrahimifar M., Mosavi Jarrahi A., Mohammadian M. Association of delta-6-desaturase expression with aggressiveness of cancer, diabetes mellitus, and multiple sclerosis: a narrative review. Asian Pac. J. Cancer Prev. APJCP. 2019;20:1005–1018. - PMC - PubMed
    1. Asp M., Giacomello S., Larsson L., Wu C., Fürth D., Qian X., Wärdell E., Custodio J., Reimegård J., Salmén F., et al. A Spatiotemporal Organ-Wide Gene Expression and Cell Atlas of the Developing Human Heart. Cell. 2019;179:1647–1660.e19. - PubMed