. 2024;17(6):1007-1024.
doi: 10.1016/j.jcmgh.2024.02.006. Epub 2024 Feb 7.

Multiple Genes Core to ERAD, Macroautophagy and Lysosomal Degradation Pathways Participate in the Proteostasis Response in α1-Antitrypsin Deficiency

Affiliations

Multiple Genes Core to ERAD, Macroautophagy and Lysosomal Degradation Pathways Participate in the Proteostasis Response in α1-Antitrypsin Deficiency

Jie Li et al. Cell Mol Gastroenterol Hepatol. 2024.

Abstract

Background & aims: In the classic form of α1-antitrypsin deficiency (ATD), the misfolded α1-antitrypsin Z (ATZ) variant accumulates in the endoplasmic reticulum (ER) of liver cells. A gain-of-function proteotoxic mechanism is responsible for chronic liver disease in a subgroup of homozygotes. Proteostatic response pathways, including conventional endoplasmic reticulum-associated degradation and autophagy, have been proposed as the mechanisms that allow cellular adaptation and presumably protection from the liver disease phenotype. Recent studies have concluded that a distinct lysosomal pathway called endoplasmic reticulum-to-lysosome completely supplants the role of the conventional macroautophagy pathway in degradation of ATZ. Here, we used several state-of-the-art approaches to characterize the proteostatic responses more fully in cellular systems that model ATD.

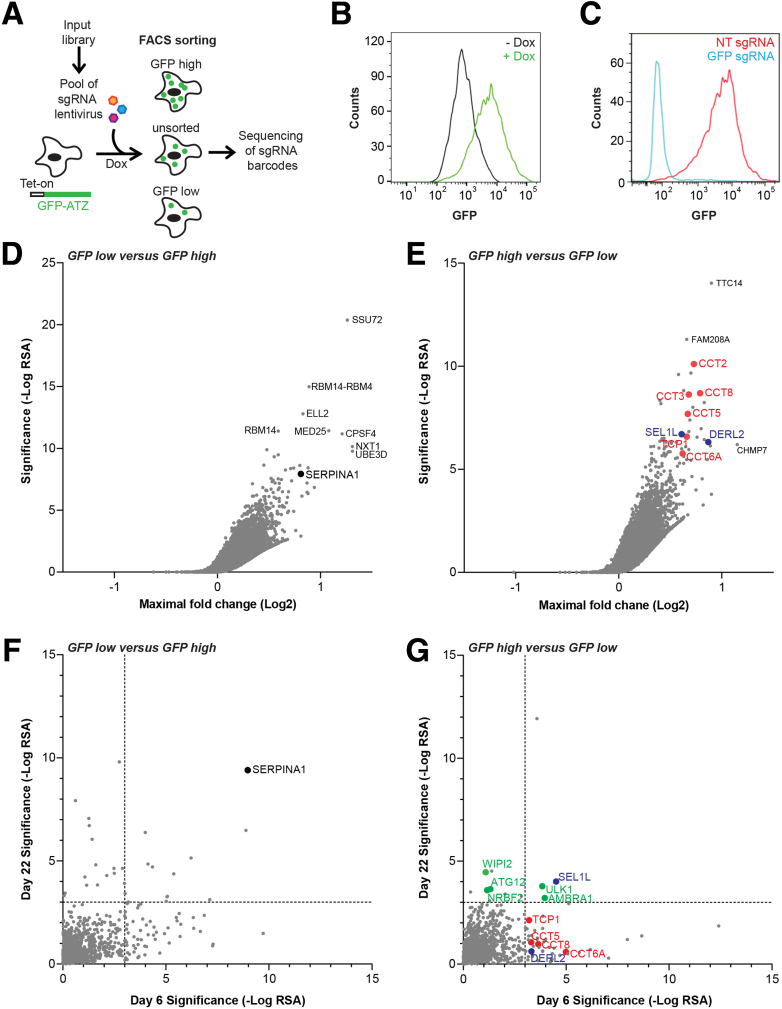
Methods: We used clustered regularly interspaced short palindromic repeats (CRISPR)-mediated genome editing coupled to a cell selection step by fluorescence-activated cell sorter to perform screening for proteostasis genes that regulate ATZ accumulation and combined that with selective genome editing in 2 other model systems.

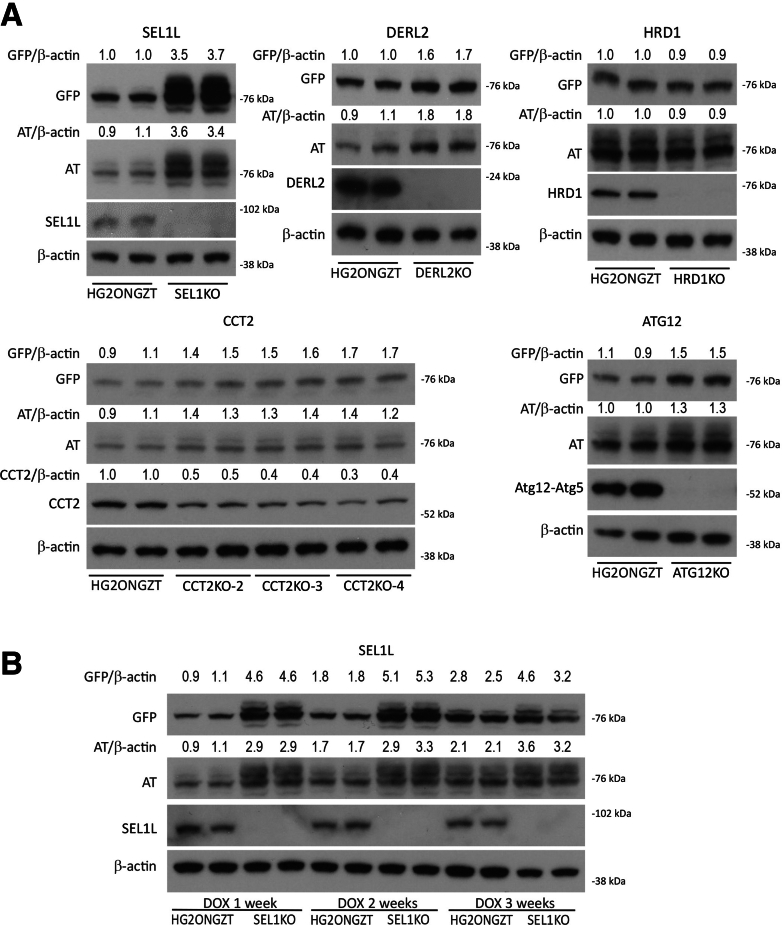
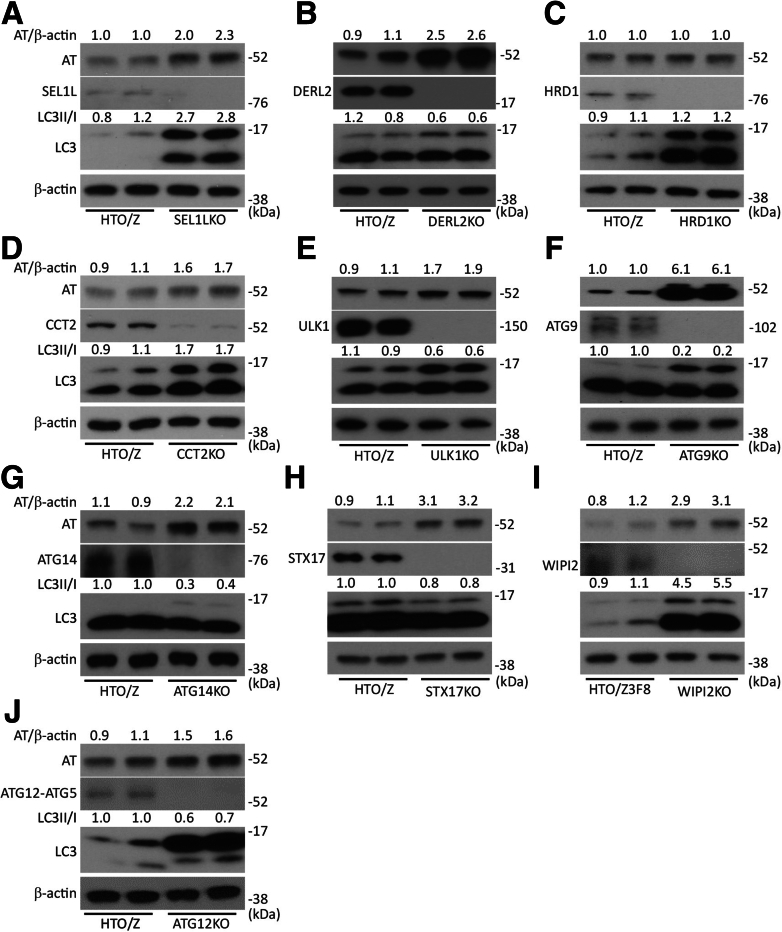
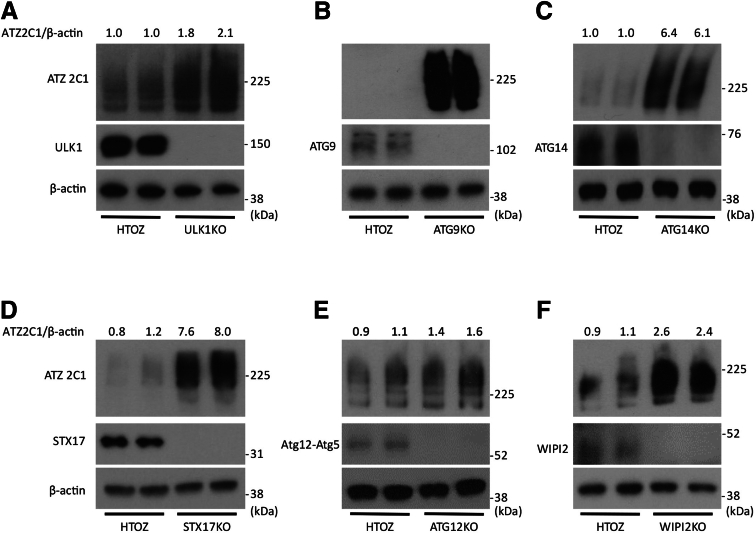
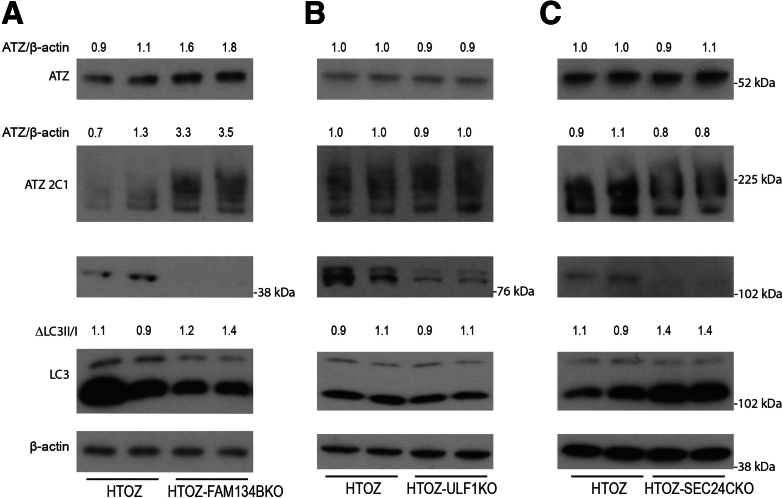
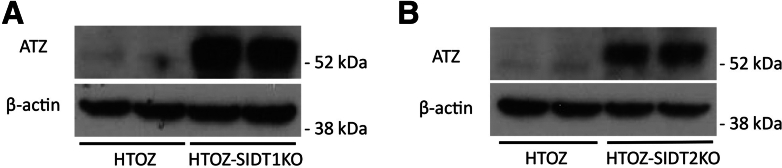
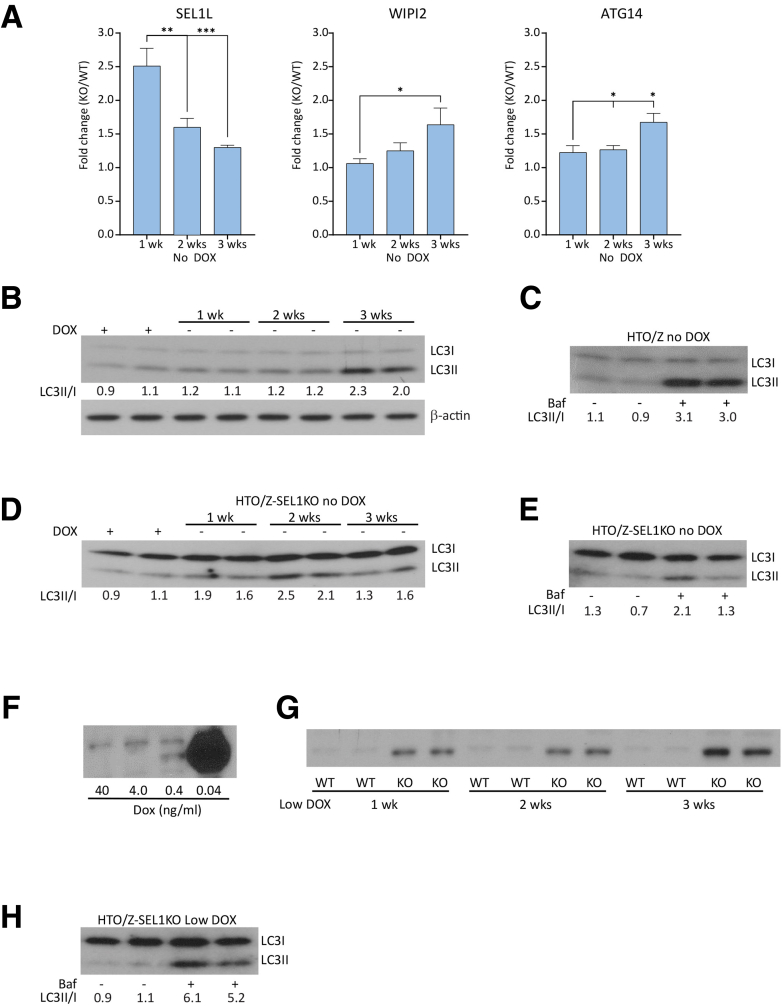
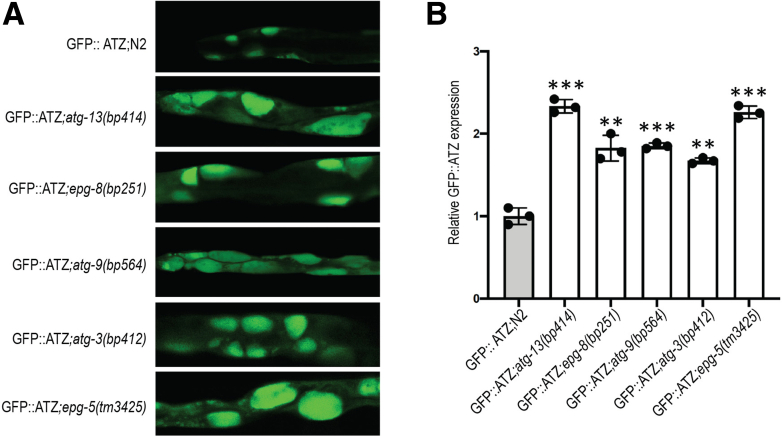
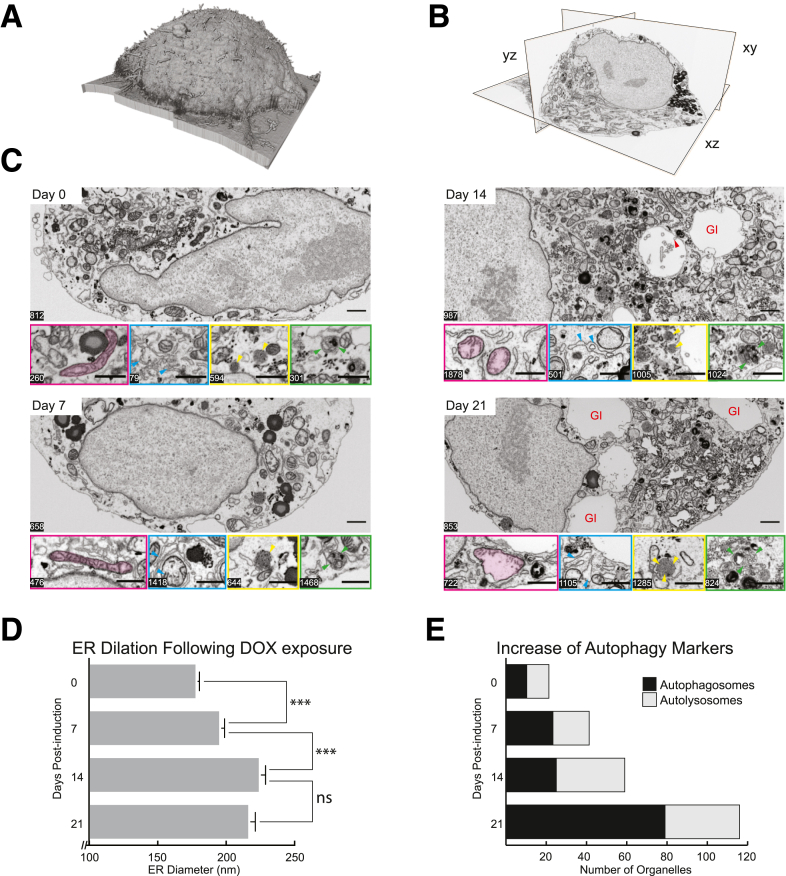
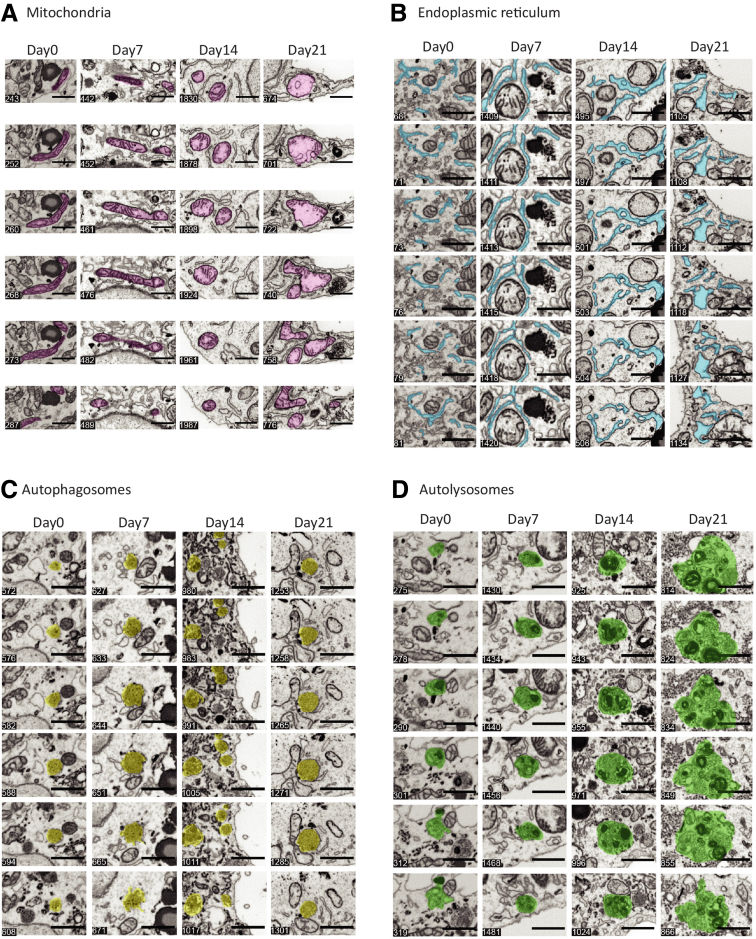
Results: Endoplasmic reticulum-associated degradation genes are key early regulators and multiple autophagy genes, from classic as well as from ER-to-lysosome and other newly described ER-phagy pathways, participate in degradation of ATZ in a manner that is temporally regulated and evolves as ATZ accumulation persists. Time-dependent changes in gene expression are accompanied by specific ultrastructural changes including dilation of the ER, formation of globular inclusions, budding of autophagic vesicles, and alterations in the overall shape and component parts of mitochondria.

Conclusions: Macroautophagy is a critical component of the proteostasis response to cellular ATZ accumulation and it becomes more important over time as ATZ synthesis continues unabated. Multiple subtypes of macroautophagy and nonautophagic lysosomal degradative pathways are needed to respond to the high concentrations of misfolded protein that characterizes ATD and these pathways are attractive candidates for genetic variants that predispose to the hepatic phenotype.

Keywords: Aggregation-Prone Proteins; Autophagy; Liver Disease; Proteasome; α1-Antitrypsin Deficiency.


Figures

Figure 1
Figure 1
Genome-wide pooled CRISPR screen for modulators of ATZ proteostasis. (A) Schematic representation of the FACS-based pooled CRISPR screening paradigm for modulators of GFP-ATZ levels. FACS analysis of GFP fluorescence in HepG2 Cas9 Tet-On GFP-ATZ cells cultured in the (B) presence or absence of doxycycline for 7 days and then (C) infected with GFP or nontargeting sgRNAs. Gene-centric view of the genome-wide comparisons of (D) unsorted cells vs the input library, (E) GFP-low vs GFP-high cell populations, and (F and G) of mini-pool comparison of GFP-high vs GFP-low cell populations on day 6 and day 22. SERPINA1 (black), ERAD (blue), autophagy (green), and components of the chaperonin TCP1-ring complex (red) are highlighted. Source data are shown in (D and E) Supplementary Table 1 and (F and G) Supplementary Table 2. Dox, doxycycline; NT, non-targeted control; RSA, redundant siRNA activity.
Figure 2
Figure 2
Steady-state levels of ATZ in the HepG2-GFP-ATZ cell line deleted for specific genes identified in the CRISPR screen. (A) In each case the cells were incubated in the presence of doxycycline for 1 week to induce ATZ expression. Cell homogenates were subjected to immunoblot analysis with antibody to GFP (GFP), polyclonal antibody to all forms of AT (AT), and antibody to the relevant deleted gene. Densitometric quantification is shown at the top of the blots. For CCT2, 3 separate clones of the deleted cell line, CCT2KO-2, -3, and -4, are shown. (B) HepG2-GFP-ATZ cell line with deletion of SEL1L1 was evaluated at 3 different time points after addition of doxycycline. DOX, doxycycline.
Figure 3
Figure 3
Steady-state levels of ATZ in the HTO/Z cell line deleted for specific autophagy genes. In each case the cells were incubated in the absence of doxycycline for 1–3 weeks to induce ATZ expression. Cell homogenates were subjected to immunoblot analysis with polyclonal antibody to all forms of AT (ATZ), antibody to LC3, antibody to β-actin, and antibody to the relevant autophagy gene. Densitometric quantification is shown at the top of the blots. Deletions are as follows: (A) SEL1L1, (B) DERL2, (C) HRD1, (D) CCT2, (E) ULK1, (F) ATG9, (G) ATG14, (H) STX17, (I) WIPI2, and (J) ATG12.
Figure 4
Figure 4
Steady-state levels of polymeric ATZ in the HTO/Z cell line deleted for specific autophagy genes. Immunoblot with antibody 2C1 specific for polymeric forms of ATZ with deletions as follows: (A) ULK1, (B) ATG9, (C) ATG14, (D) STX17, (E) ATG12, and (F) WIPI2.
Figure 5
Figure 5
Steady-state levels of ATZ in the HTO/Z cell line deleted for specific autophagy receptor genes. Deletions are as follows: (A) FAM134B, (B) UFL1, and (C) SEC24C.
Figure 6
Figure 6
Steady-state levels of ATZ in the HTO/Z cell line deleted for SIDT1 and SIDT2. Immunoblots for ATZ and β-actin levels in cell lines deleted for (A) SIDT1 and (B) SIDT2. Knockout of these genes was validated by polymerase chain reaction.
Figure 7
Figure 7
Time-dependent roles of ERAD and autophagy in the HTO/Z cell line. (A) Steady-state levels of ATZ in the HTO/Z cell line deleted for ERAD or autophagy genes in time course studies. Fold change for deletions of SEL1L1 (left), WIPI2 (center), and ATG14 (right) compared with parent HTO/Z cell line at time points of 1, 2, and 3 weeks after induction of ATZ expression. (B) LC3-II to LC3-I ratio in HTO/Z in the presence of doxycycline or after it was withdrawn for 1, 2, and 3 weeks. (C) LC3-II to LC3-I ratio in HTO/Z that had been out of doxycycline for 3 weeks in the presence or absence of bafilomycin. (D) LC3-II to LC3-I ratio in HTO/Z with SEL1LI deletion in the presence of doxycycline or after it was withdrawn for 1, 2, and 3 weeks. (E) LC3-II to LC3-I ratio in HTO/Z with SEL1L1 deletion that had been out of doxycycline and then incubated in the absence or presence of bafilomycin. (F) ATZ levels in the HTO/Z cell line cultured over 3 weeks in different doses of doxycycline as indicated at the bottom. (G) ATZ levels in HTO/Z with SEL1L1 deletion after 1, 2, and 3 weeks of low-dose doxycycline. WT is parent HTO/Z and KO is HTO/Z with SEL1L1 deletion. (H) LC3-II to LC3-I ratio in HTO/Z with SEL1L1 deletion of 3 weeks of low-dose doxycycline and then incubated in the absence or presence of bafilomycin. Densitometric quantification is shown at the bottom in each case. ∗P < .05, ∗∗P < .01, and ∗∗∗P < .001, Student t test. Baf, bafilomycin; DOX, doxycycline; KO, knockout; WT, wild-type.
Figure 8
Figure 8
Effect of autophagy mutants on GFP::ATZ accumulation in ATZ nematode model. (A) Confocal microscopy images of GFP::ATZ–expressing animals crossed with autophagy mutants. (B) Quantification of GFP::ATZ accumulation using CellInsight CX7 high-content image. ∗∗P ≤ .01; ∗∗∗P ≤ .001.
Figure 9
Figure 9
Nanotomographic analysis of HepG2 cells at different time points postinduction of ATZ expression. (A) Volume rendering and (B) orthogonal view, showing a 21-day postinduction cell in xy, yz, and xz planes. Note the ability to reconstruct the data set in any axis, afforded by the isometric voxels. (C) Representative single-plane images from each of the 4 time points assayed. Inset panels highlight changes in organelle ultrastructure at different z-slice positions, such as increase in ER diameter and the density of autophagic organelle occurence (magenta--mitochondria, cyan--endoplasmic reticulum, yellow--autophagosomes, and green--autolysosomes). Cyan arrowheads illustrate the increased dilation of endoplasmic reticulum over the time course. Yellow arrows indicate the presence of lipid droplets Green arrowheads indicate the presence of autophagosomes. Red arrowhead in day 14 illustrates the presence of omegasomes in the emergent globular inclusions (as denoted by the red GI label). Scale bar: 1 μm. (D) Quantification of the increase in the mean diameter of the endoplasmic reticulum per cell at each of the 4 time points. ∗∗∗ denotes P < .001 (E) Increased density of autophagosomic organelles, as measured by the mean number of autophagosomes and autolysosomes counted per cell at each of the 4 time points. GI, globular inclusions.
Figure 10
Figure 10
Time-dependent changes in organelle ultrastructure by 3D FIB-SEM nanotomography. (A) Six z-slices through a single mitochondrion (highlighted in purple) at 0, 7, 14, and 21 days after induction of ATZ expression. Note the canonical tubular appearance on days 0 and 7 transforms to a circular appearance on days 14 and 21, with a significant loss of cristae on day 21. (B) Six z-slices through a region of the endoplasmic reticulum network (highlighted in cyan) at 0, 7, 14, and 21 days after induction of ATZ expression. Note the clear dilation of the tubular ER morphology present on day 14, and the complete loss of tubular morphology on day 21. (C) Six z-slices through a region containing autophagosomes (highlighted in yellow) at 0, 7, 14, and 21 days after induction of ATZ expression. Note the gradual size increase of the autolysosomes at later time points with increased number density present on day 14. Note on day 21 the close association of the autophagosomes with clearly malformed mitochondria. (D) Six z-slices through a region containing autolysosomes (highlighted in green) at 0, 7, 14, and 21 days after induction of ATZ expression. Note both the gradual size increase of the autolysosomes at later time points, and also the complexity of the autolysosomal interior ultrastructure, which show not only autophagosomes, but what also appear to be fragments of mitochondria. Scale bars: 1 μm. Individual z-slice number from each data set is denoted in the bottom left corner of each image.

Similar articles

References

    1. Klaips C.L., Jayaraj G.G., Hartl F.U. Pathways of cellular proteostasis in aging and disease. J Cell Biol. 2018;217:51–63. - PMC - PubMed
    1. Karagöz G.E., Acosta-Alvear D., Walter P. The unfolded protein response: detecting and responding to fluctuations in the protein-folding capacity of the endoplasmic reticulum. Cold Spring Harb Perspect Biol. 2019;11a - PMC - PubMed
    1. Levine B., Kroemer G. Biological functions of autophagy genes: a disease perspective. Cell. 2019;176:11–42. - PMC - PubMed
    1. Liang J.R., Lingeman E., Louin T., et al. A genome-wide ER-phagy screen highlights key roles of mitochondrial metabolism and ER- resident UFMylation. Cell. 2020;180:1160–1177. - PMC - PubMed
    1. Khaminets A., Heinrich T., Mari M., et al. Regulation of endoplasmic reticulum turnover by selective autophagy. Nature. 2015;522:354–358. - PubMed

MeSH terms