. 2024 Feb 9;24(1):64.
doi: 10.1186/s12935-024-03249-w.

NY-ESO-1-specific T cell receptor-engineered T cells and Tranilast, a TRPV2 antagonist bivalent treatment enhances the killing of esophageal cancer: a dual-targeted cancer therapeutic route

Affiliations

NY-ESO-1-specific T cell receptor-engineered T cells and Tranilast, a TRPV2 antagonist bivalent treatment enhances the killing of esophageal cancer: a dual-targeted cancer therapeutic route

Obed Boadi Amissah et al. Cancer Cell Int. .

Abstract

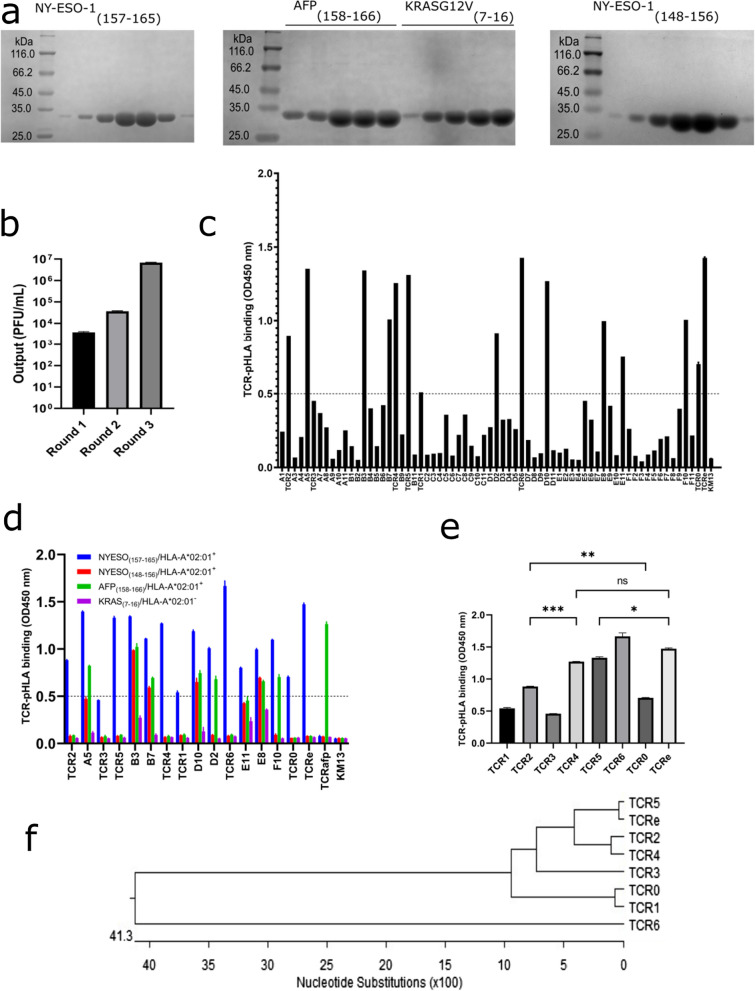
Background: Esophageal cancer (EC) is a global canker notorious for causing high mortality due to its relentless incidence rate, convoluted with unyielding recurrence and metastasis. However, these intricacies of EC are associated with an immoderate expression of NY-ESO-1 antigen, presenting a lifeline for adoptive T cell therapy. We hypothesized that naturally isolated higher-affinity T cell receptors (TCRs) that bind to NY-ESO-1 would allow T lymphocytes to target EC with a pronounced antitumor response efficacy. Also, targeting TRPV2, which is associated with tumorigenesis in EC, creates an avenue for dual-targeted therapy. We exploited the dual-targeting antitumor efficacy against EC.

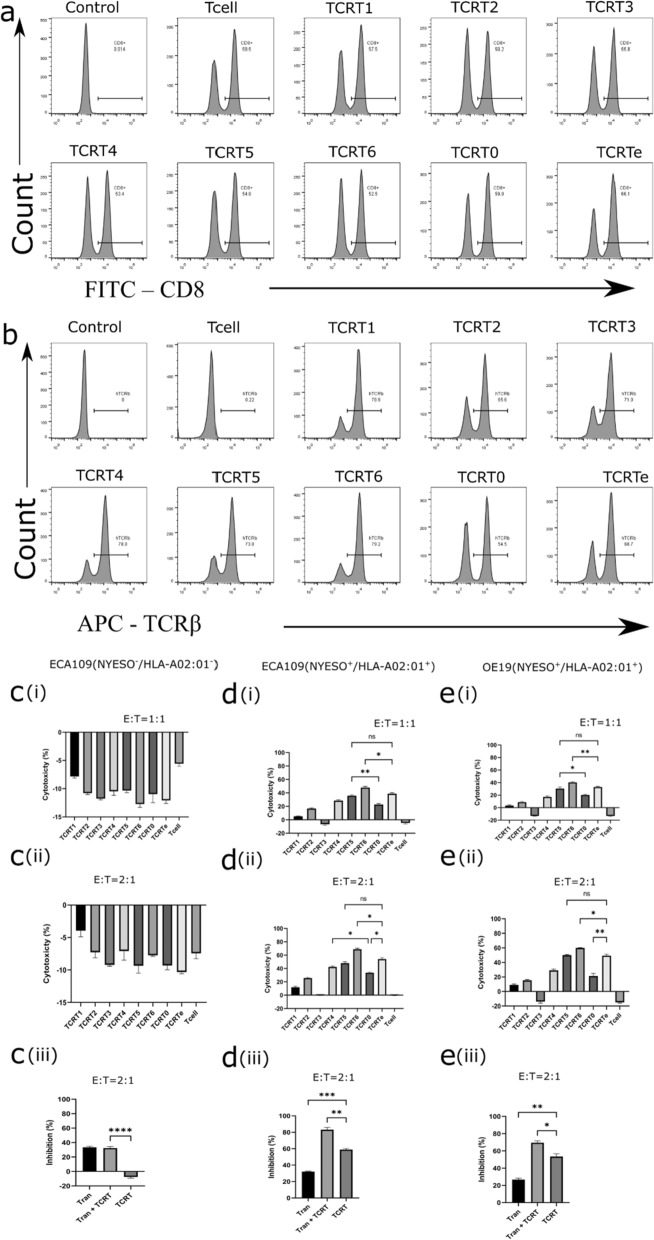
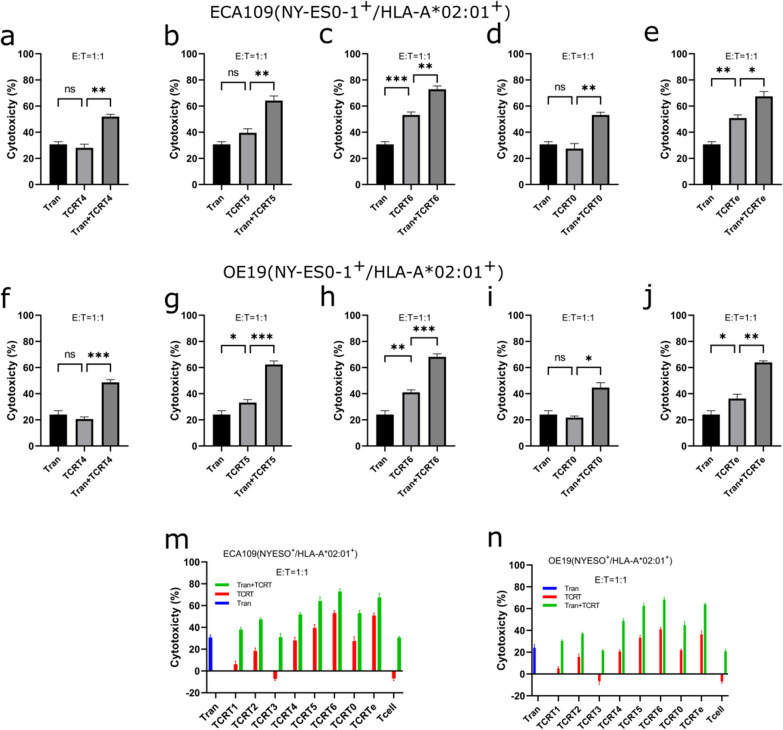
Methods: We isolated antigen-specific TCRs (asTCRs) from a naive library constructed with TCRs obtained from enriched cytotoxic T lymphocytes. The robustness of our asTCRs and their TCR-T cell derivatives, Tranilast (TRPV2 inhibitor), and their bivalent treatment were evaluated with prospective cross-reactive human-peptide variants and tumor cells.

Results: Our study demonstrated that our naive unenhanced asTCRs and their TCR-Ts perpetuated their cognate HLA-A*02:01/NY-ESO-1(157-165) specificity, killing varying EC cells with higher cytotoxicity compared to the known affinity-enhanced TCR (TCRe) and its wild-type (TCR0) which targets the same NY-ESO-1 antigen. Furthermore, the TCR-Ts and Tranilast bivalent treatment showed superior EC killing compared to any of their monovalent treatments of either TCR-T or Tranilast.

Conclusion: Our findings suggest that dual-targeted immunotherapy may have a superior antitumor effect. Our study presents a technique to evolve novel, robust, timely therapeutic strategies and interventions for EC and other malignancies.

Keywords: Adoptive therapy; Cytotoxic T lymphocytes; Esophageal cancer (EC); NY-ESO-1 antigen; T cell receptor-engineered T cell (TCR-T); Tranilast.


Conflict of interest statement

The authors declare no competing interests.

Figures

Fig. 1
Fig. 1
NGS-quality assessment of αβTCR library. a schematic representation of the original gene arrangement of αβTCR variable chain. A linker separates αTCR and βTCR. b schematic representation of separate αTCR or βTCR indexed with molecular identifiers. cf TCR DNA quality and size characterization. Fragmented αTCR and βTCR Trap DNA of about 480 bp (c). αTCR and βTCR DNA smear integrity data (d). Electropherogram diagram showing the size distribution range of αTCR and βTCR DNA libraries as migration time versus intensity (relative fluorescence unit, RFU) spectrum (e). Evaluation of the quality of bases read for each αTCR and βTCR library (f). g diversity of αTCR and βTCR libraries. Base numbers 0 to 55 and 251 to 300 represent molecular identifiers, base numbers 56 to 250 and 301 to 500 represent the variable (V) region of the αTCR and βTCR
Fig. 2
Fig. 2
Identity characterization of unique TCR clones. a, b dot plots showing the size frequency of each unique αTCR and βTCR, respectively. c, d frequency of all TRAV and TRBV oligonucleotides distributed across each αTCR and βTCR oligonucleotides respective library. eh, f, frequency distribution of all; αTCR V and J genes (e and f), and βTCR V and J genes (g and h). i the libraries’ frequency distribution of all TCR productive sequences, partial sequences, and frameshifts
Fig. 3
Fig. 3
Screening of asTCRs. a Collected fractions of size-exclusive chromatography-purified soluble pHLAs are presented on 12% non-reducing SDS-PAGE. b TCR-phage output obtained from three rounds of panning against NY-ESO-1(157–165) pHLA. c Monoclonal ELISA of 66 TCR clones randomly selected to evaluate their binding with NY-ESO-1(157–165) pHLA. d Monoclonal ELISA of NY-ESO-1(157–165) pHLA-TCR binders against irrelevant pHLA. asTCRs were identified when they only bound to (157–165) pHLA. e asTCRs binding variance. All ELISA values at OD450 nm were normalized against signal from KM13 with TCRafp, an AFP(158–166) asTCR serving as a control standard. f asTCRs phylogenetic family. TCR0 and TCRe represent 1G4 TCR wild-type and its affinity-enhanced TCR derived from the directed evolution of its CDRS. TCR1, TCR2, TCR3, TCR4, TCR5, and TCR6 are asTCRs selected from the naïve library after normalization. Most asTCRs were selected around the threshold of OD450 nm = 0.5. Data are arrayed as mean ± SD and compared making use of one-way ANOVA (Brown-Forsythe and Welch multiple comparison tests) where *p < 0.05, **p < 0.01, ***p < 0.001, ****p < 0.0001
Fig. 4
Fig. 4
asTCR lentivirus production and Tranilast dose–response curve. a Framework of αβTCR transgene. The αTCR and βTCR consisting of the leader peptide, variable, and constant genes were separated by a 2A cleavage peptide. b and c amplified asTCR transgenes of about 2.2 kb size and their respective dimeric lentivector clones. Lanes T1 to T0 represent TCR1 to TCR0, respectively. d Titration of asTCR lentiviruses after transducing J.RT3-T3.5 cells. Lentivirus was titered using TCRβ antibody in a flow cytometry analysis. eg Hillslope representing the diagrammatic representation of Tranilast dose–response relationship on ECA109(NY-ESO-1/HLA-A*02:01) (e), ECA109(NY-ESO-1+/HLA-A*02:01+) (f), and OE19(NY-ESO-1+/HLA-A*02:01+) (g) EC cell lines
Fig. 5
Fig. 5
TCR-T production and functional assay. a Framework of TCR-T production, activation, and expansion. T cells were activated on day 0, transduced with asTCR lentivirus on day 1, and expanded for two weeks. (+) sign indicates days for evaluating and quantifying essential T cell markers, and (*) asterisks indicate days for performing functional assays. b IFNγ was detected after co-culturing TCR-Ts with (NY-ESO-1(157–165)) and other peptides-enriched T2 cells to validate TCR-T function and specificity. c TCR-Ts activation and potential antitumor function were evaluated by quantifying IFNγ release after an overnight co-culturing of TCR-Ts with ECA109(NY-ESO-1/HLA-A*02:01), ECA109(NY-ESO-1+/HLA-A*02:01+) and OE19(NY-ESO-1+/HLA-A*02:01+) EC cells. d T cell activation before performing functional assay was evaluated using a late T cell activation marker (CD25) by selecting sampling two different TCR-Ts. e T cell resting phase was verified before performing functional assay using CD137 marker using two different sampled TCR-Ts. fh TCR-T function and specificity of two selected TCR-Ts (TCRT4 and TCRT5) were validated by quantifying their IFNγ release or killing effect (cytotoxicity) against multiple cancer cells with activated native T cell as negative control (f), T2 cells expressing different HLA allotype pulsed with relevant peptide (NY-ESO-1(157–165)) (g), and (NY-ESO-1(157–165)) or other peptides-enriched T2 cells (h)
Fig. 6
Fig. 6
TCR-T-mediated or Tranilast-mediated cytotoxicity. a Manufactured and expanded TCR-Ts were evaluated for the quantity of cytotoxic CD8+ lymphocytes via cytometry with unstained cells as a negative control and native T cell population as a positive control. b Expanded TCR-Ts were evaluated for the quantity expressing asTCRs via flow cytometry with unstained T cells and native T cells as negative controls. c TCR-T or Tranilast killing effect after co-culturing with ECA109(NY-ESO-1/HLA-A*02:01) ESCC cells; cytotoxicity of various TCR-Ts against ECA109(NY-ESO-1/HLA-A*02:01) at E:T = 1:1 (c(i)), E:T = 2:1 (c(ii)); and the killing effect of Tranilast, selected TCR-T or a combination of both using 120 μM Tranilast or E:T = 1:1 for TCR-Ts and cancer cells (c(iii)). d TCR-T or Tranilast killing effect after co-culturing with ECA109(NY-ESO-1+/HLA-A*02:01+) ESCC cells; cytotoxicity of various TCR-Ts against ECA109(NY-ESO-1+/HLA-A*02:01+) at E:T = 1:1 (d(i)), E:T = 2:1 (d(ii)); and the killing effect of Tranilast, selected TCR-T or a combination of both using 120 μM Tranilast or E:T = 2:1 for TCR-Ts and cancer cells (d(iii)). e TCR-T or Tranilast killing effect after co-culturing with OE19(NY-ESO-1+/HLA-A*02:01+) EADC cells; cytotoxicity of various TCR-Ts against OE19(NY-ESO-1+/HLA-A*02:01+) at E:T = 1:1 (e(i)), E:T = 2:1 (e(ii)); and the killing effect of Tranilast, selected TCR-T or a combination of both using 120 μM Tranilast or E:T = 2:1 for TCR-Ts and cancer cells (e(iii)). Data are shown as mean ± SD and compared using one-way ANOVA (Brown-Forsythe and Welch tests) with *p < 0.05, **p < 0.01, ***p < 0.001, ****p < 0.0001
Fig. 7
Fig. 7
TCR-T and Tranilast bivalent-mediated cytotoxicity. ae Monovalent and bivalent treatments of Tranilast and TCR-Ts against ECA109(NY-ESO-1+/HLA-A*02:01+) ESCC cells. The killing effect of either Tranilast or TCR-T or a combination of both for each selected TCR-T was quantified by LDH release. fj Monovalent and bivalent treatments of Tranilast and TCR-Ts against OE19(NY-ESO-1+/HLA-A*02:01+) EADC cells. The killing effect of either Tranilast or TCR-T or a combination of both for each selected TCR-T was quantified by LDH released by the cancer cells. m and n monovalent TCR-Ts or Tranilast treatment against ECA109(NY-ESO-1+/HLA-A*02:01+) cells (m) and OE19(NY-ESO-1+/HLA-A*02:01+) cells (n) using native T cells non-functional TCR-T (TCR-T3), and Tranilast as controls. Data are shown as mean ± SD and compared using one-way ANOVA (Brown-Forsythe and Welch tests) with *p < 0.05, **p < 0.01, ***p < 0.001

References

    1. Gyurdieva A, et al. Biomarker correlates with response to NY-ESO-1 TCR T cells in patients with synovial sarcoma. Nat Commun. 2022;13(1):5296. doi: 10.1038/s41467-022-32491-x. - DOI - PMC - PubMed
    1. Pan Q, et al. Phase 1 clinical trial to assess safety and efficacy of NY-ESO-1-specific TCR T cells in HLA-A *02:01 patients with advanced soft tissue sarcoma. Cell Rep Med. 2023;4(8):101133. doi: 10.1016/j.xcrm.2023.101133. - DOI - PMC - PubMed
    1. Akcakanat A, et al. NY-ESO-1 expression and its serum immunoreactivity in esophageal cancer. Cancer Chemother Pharmacol. 2004;54(1):95–100. doi: 10.1007/s00280-004-0768-3. - DOI - PubMed
    1. Bujas T, et al. MAGE-A3/4 and NY-ESO-1 antigens expression in metastatic esophageal squamous cell carcinoma. Eur J Histochem. 2011;55(1):e7. doi: 10.4081/ejh.2011.e7. - DOI - PMC - PubMed
    1. Fujita S, et al. NY-ESO-1 expression and immunogenicity in esophageal cancer. Clin Cancer Res. 2004;10(19):6551–6558. doi: 10.1158/1078-0432.CCR-04-0819. - DOI - PubMed