. 2024 Feb 9;15(1):1222.
doi: 10.1038/s41467-024-45536-0.

Protein thermal sensing regulates physiological amyloid aggregation

Affiliations

Protein thermal sensing regulates physiological amyloid aggregation

Dane Marijan et al. Nat Commun. .

Abstract

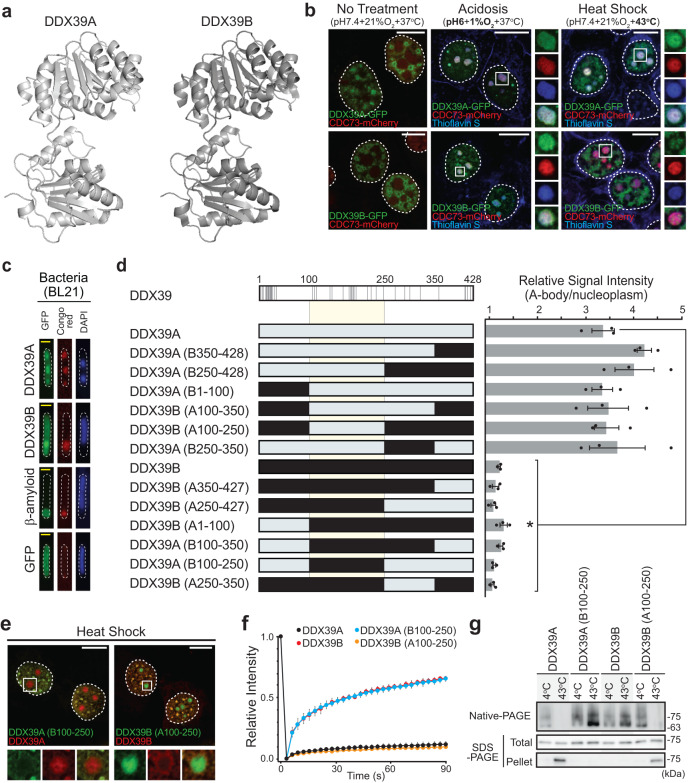
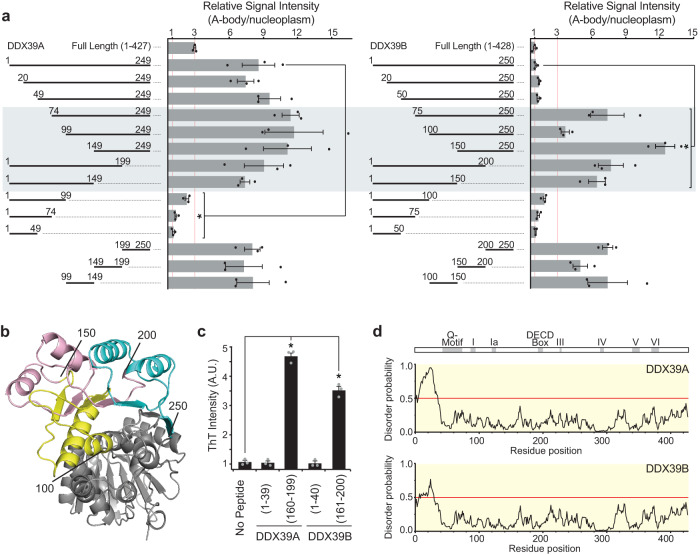
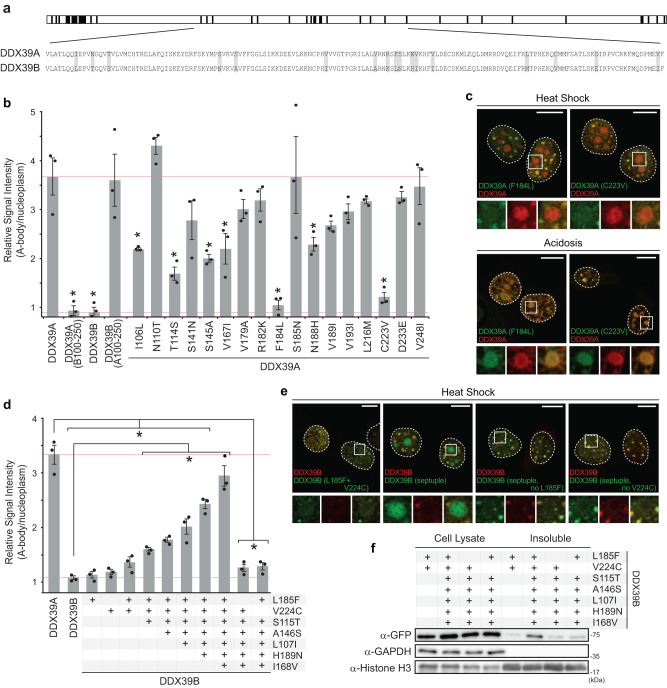
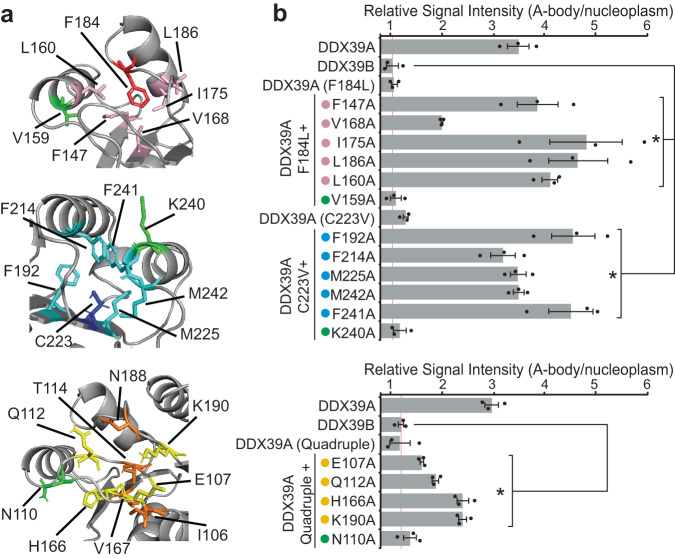
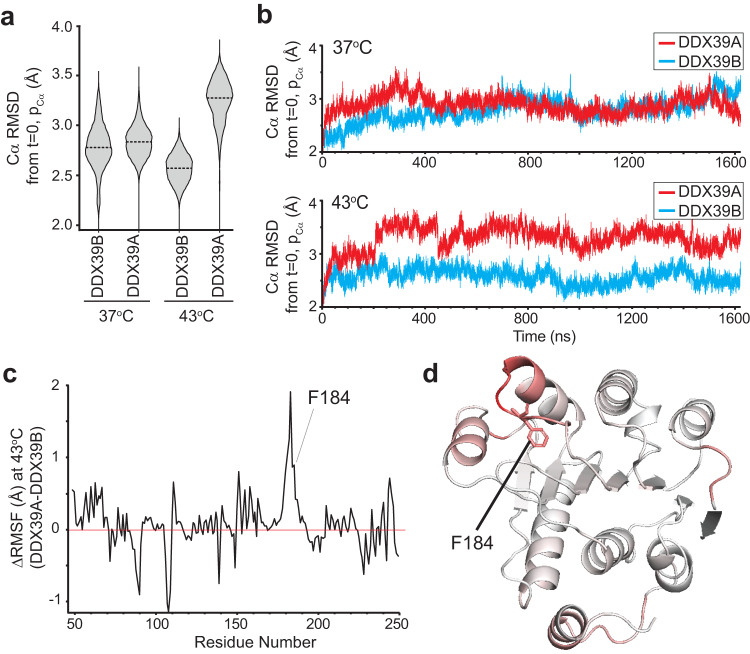
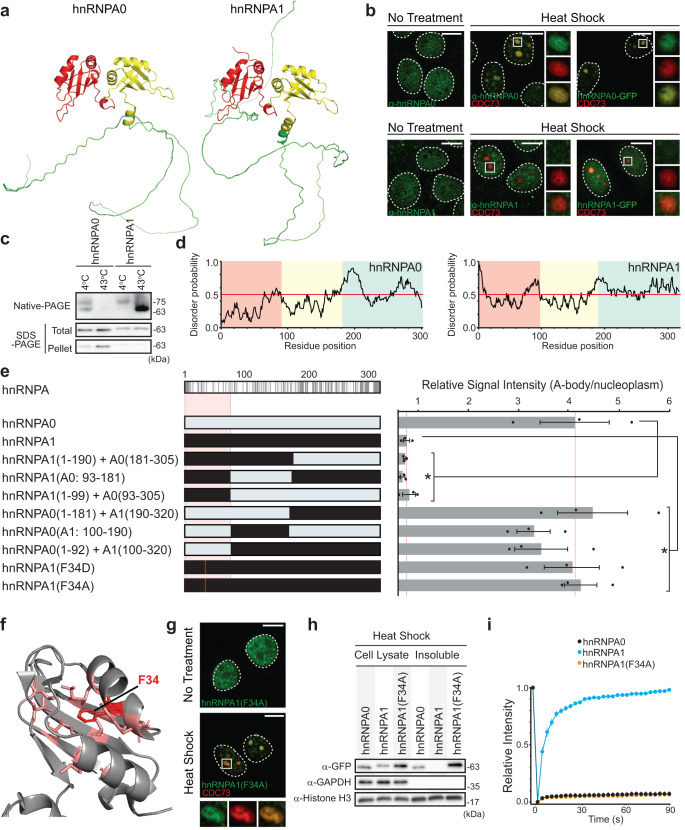
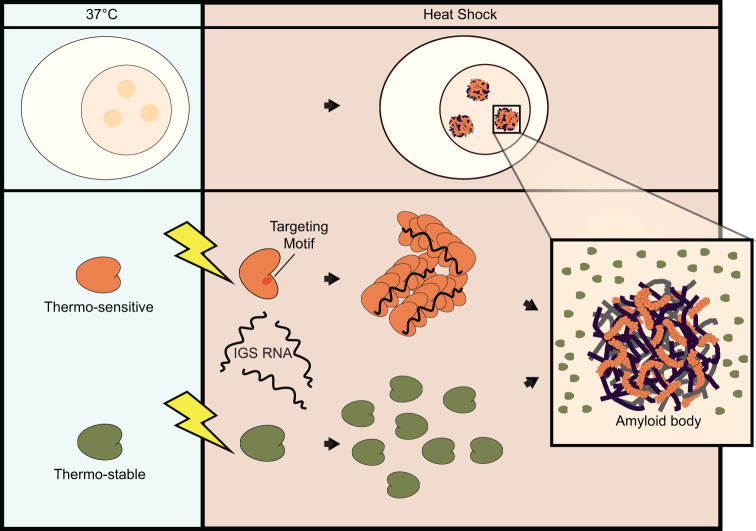
To survive, cells must respond to changing environmental conditions. One way that eukaryotic cells react to harsh stimuli is by forming physiological, RNA-seeded subnuclear condensates, termed amyloid bodies (A-bodies). The molecular constituents of A-bodies induced by different stressors vary significantly, suggesting this pathway can tailor the cellular response by selectively aggregating a subset of proteins under a given condition. Here, we identify critical structural elements that regulate heat shock-specific amyloid aggregation. Our data demonstrates that manipulating structural pockets in constituent proteins can either induce or restrict their A-body targeting at elevated temperatures. We propose a model where selective aggregation within A-bodies is mediated by the thermal stability of a protein, with temperature-sensitive structural regions acting as an intrinsic form of post-translational regulation. This system would provide cells with a rapid and stress-specific response mechanism, to tightly control physiological amyloid aggregation or other cellular stress response pathways.


Conflict of interest statement

The authors declare no competing interests.

Figures

Fig. 1
Fig. 1. Closely related proteins, DDX39A and DDX39B, are differentially targeted to A-bodies.
a Cartoon 3D structures of DDX39A (predicted by Fold & Function Assignment System) and DDX39B (PDB: 1XTI) (b) MCF-7 cells expressing DDX39A-GFP, DDX39B-GFP (green), and the A-body marker protein CDC73-mCherry (red) were left untreated, or exposed to extracellular acidosis (1%O2 + pH6.0) or heat shock (43 °C) for 4 h. Heat shock and acidosis treated cells were stained with the amyloidophilic dye Thioflavin S (blue). c DDX39A-GFP, DDX39B-GFP, β-Amyloid-GFP, and GFP were expressed in BL21 cells prior to staining with Congo red and DAPI. Yellow scale bars represent 0.5 μm. d Schematic indicating unique residues (gray lines) within the DDX39 proteins (top). The indicated DDX39 substitution constructs (left panel) were expressed in heat shock-treated MCF-7 cells. A-body targeting efficiency was calculated as the average A-body pixel intensity relative to the average nuclear pixel intensity (right panel). For each sample 10 cells were analyzed per replicate, and values represent means ± s.e.m. (n = 3 independent experiments, a two-tailed Student’s t-test was used: *p ≤ 0.05). e DDX39A-mCherry and DDX39A(B100-250)-GFP or DDX39B-mCherry and DDX39B(A100-250)-GFP were co-expressed and visualized in heat shock-treated MCF-7 cells. f Quantification of fluorescence recovery after photobleaching data for heat shock-treated (4 h) MCF-7 cells expressing the indicated GFP-tagged DDX39 constructs. For each sample 10 cells were analyzed per replicate, and values represent means ± s.e.m (n = 3 independent experiments). g DDX39A-GFP, DDX39A(B100-250)-GFP, DDX39B-GFP, and DDX39B(A100-250)-GFP were expressed in MCF-7 cells grown under standard conditions. Soluble lysates were extracted and incubated at 4 °C or 43 °C for 1 h, prior to separation by Native- and SDS-PAGE (Total). Aliquots of the temperature-treated lysates were centrifuged, and aggregates were run on SDS-PAGE (Pellet). Dashed circles represent nuclei, selected regions (white boxes) are expanded (merge: bottom or far-right), white scale bars represent 10 μm. Source data for all graphs and blots are provided with this paper.
Fig. 2
Fig. 2. DDX39A and DDX39B contain generic A-body targeting motifs.
a DDX39A (left panel) and DDX39B (right panel) N-terminal truncation mutations were expressed in heat shock-treated MCF-7 cells. A-body targeting efficiency was calculated for each protein fragment. 10 cells were analyzed per replicate, and values represent means ± s.e.m (n  =  3 independent experiments, a two-tailed unpaired Student’s t test was used: *p ≤ 0.05). b Cartoon 3D structure of DDX39B (PDB: 1XTI) with highlighted minimal A-body targeting motifs: amino acids 100−150 (yellow), amino acids 150−200 (pink), and amino acids 200−250 (cyan). c A Thioflavin T assay was performed with DDX39A (1−39), DDX39A (160−199), DDX39B (1−40), and DDX39B (161−200) peptides. Endpoint (16 h) Thioflavin T fluorescence is presented in arbitrary units (A.U.) as means ± s.e.m. (n = 3 independent experiments, a two-tailed Student’s t test was used: *p ≤ 0.05). d IUPred3 disorder prediction maps of DDX39A and DDX39B. A schematic of the generic DDX39 protein and the putative domains is included (above). Source data for all graphs are provided with this paper.
Fig. 3
Fig. 3. Central amino acid residues can modulate DDX39A and DDX39B heat shock A-body targeting.
a Schematic indicating the positions of unique residues within the DDX39 proteins (black bars, top panel). The sequences of the central region (amino acids 100-250) are provided, with amino acid differences highlighted in gray (lower panel). b MCF-7 cells were transfected with mutant DDX39A-GFP constructs containing individual substitutions corresponding to the 17 residue differences in the amino acid 100-250 region. Cells were heat shock-treated and A-body targeting efficiency was calculated. 10 cells were analyzed per replicate, and values represent means ± s.e.m (n  =  3 independent experiments, a two-tailed Student’s t test was used: *p ≤ 0.05). c DDX39A-mCherry (red) and DDX39A(F184L)-GFP or DDX39A(C223V)-GFP (green) constructs were expressed in MCF-7 cells exposed to heat shock (top) or acidotic (bottom) conditions. Representative images are presented. d Heat shock-treated MCF-7 cells expressing the indicated DDX39B mutations were quantified for A-body targeting. 10 cells were analyzed per replicate, and values represent means ± s.e.m. (n  =  3, independent experiments, a two-tailed Student’s t test was used: *p ≤ 0.05). e Representative images were taken of the indicated DDX39B-GFP point mutations. DDX39B-mCherry was included as a control. f MCF-7 cells transfected with the indicated DDX39B mutants were subjected to heat shock treatment prior to lysate fractionation. Western blotting was used to determine the presence of the indicated DDX39B-GFP constructs in the insoluble fraction, with GAPDH and Histone H3 used as soluble and insoluble controls, respectively. In representative images, dashed circles represent nuclei, selected regions (white boxes) were expanded below (merge: far-right). white scale bars represent 10 μm. Source data for all graphs and blots are provided with this paper.
Fig. 4
Fig. 4. Identification of structural pockets that regulate DDX39 targeting to A-bodies.
a Cartoon of predicted DDX39A structure with residues forming three regulatory pockets highlighted in yellow, red and blue. b Enlarged view of the F184 and S145 (red, surrounding residues pink) and C223 (blue, surrounding residues cyan) hydrophobic pockets. c enlarged view of the T114, I106, N188 and V167 (orange, surrounding residues yellow) hydrophilic pocket. d MCF-7 cells expressing wild-type DDX39A and DDX39B or the indicated DDX39A mutants were subjected to heat shock, visualized, and quantified. Heat shock treated MCF-7 cells expressing constructs containing all possible amino acids at the (e) F184X, (f) C223X, and (g) T114X positions of DDX39A were quantified for A-body targeting efficiency (where X represents amino acids presented along the y-axis of the graph). Background colors indicate amino acid hydrophobicity (orange), polarity (blue), negative charge (purple), or positive charge (green). For each quantification (dg), 10 cells were analyzed per replicate, and values represent means ± s.e.m. (n  =  3 independent experiments, a two-tailed Student’s t test was used: *p ≤ 0.05). Not significant (ns). Source data for all graphs are provided with this paper.
Fig. 5
Fig. 5. Heat shock A-body targeting is regulated by distinct structural pockets.
a Cartoon of the pockets surrounding amino acids F184 (red, top), C223 (blue, middle) and T114/I106/N188/V167 (orange, bottom) in the predicted DDX39A structure. Surrounding residues are shown in pink (top), cyan (middle) and yellow (bottom), while the control residues outside of pockets are indicated in green. b MCF-7 cells expressing the indicated DDX39A mutants were subjected to heat shock conditions and quantified for A-body targeting. 10 cells were analyzed per replicate, and values represent means ± s.e.m (n  =  3 independent experiments, a two-tailed Student’s t test was used: *p  ≤  0.05). Source data for all graphs are provided with this paper.
Fig. 6
Fig. 6. Elevated temperature enhances the dynamic properties of the thermo-sensitive A-body constituent DDX39A.
a Violin plots of root mean square deviation (RMSD) values from 42620 data points across each 1.6 microsecond simulation at 37 °C and 43 °C for the N-terminus (amino acids 46-250) of DDX39A and DDX39B. The dashed horizontal lines in the violin plot represent the mean. b RMSD of the N-terminal domain of DDX39A (red) and DDX39B (blue) at 37 °C and 43 °C across a 1.6 microsecond molecular dynamics simulation. c The difference in root mean square fluctuations (RMSF) for DDX39A and DDX39B at 43 °C is presented for each residue of the ordered regions of the DDX39 N-terminal domains. d RMSF values were converted to hexadecimal color values (red = increased ΔRMSF) and depicted on the DDX39A N-terminal structure. Source data are provided with this paper.
Fig. 7
Fig. 7. Destabilization of hnRNPA1 regulatory pocket causes heat-induced A-body targeting.
a Cartoon 3D structures of hnRNPA0 (AF-Q13151-F1) and hnRNPA1 (AF-P09651-F1) predicted by AlphaFold. b MCF-7 cells expressing the A-body marker CDC73-mCherry were untreated or heat shocked, prior to immunostaining with α-hnRNPA0 or α-hnRNPA1 antibody (green) and imaging. Cells on far right are co-expressing CDC73-mCherry and hnRNPA0-GFP or hnRNPA1-GFP, and were imaged immediately after heat shock. c Soluble lysates were extracted from MCF-7 cells expressing hnRNPA0-GFP or hnRNPA1-GFP. Lysates were incubated at 4 °C or 43 °C for 1 h, prior to separation by Native- or SDS-PAGE (Total). Aliquots of the temperature-treated lysates were centrifuged, and pellets were run on SDS-PAGE (Pellet). d IUPred3 prediction maps of disordered protein regions in hnRNPA0 (left) and hnRNPA1(right). Background colors correspond to the regions in (a). e Schematic indicating unique residues (gray lines) within the hnRNPA proteins (top-left). MCF-7 cells expressing the indicated hnRNPA0 or hnRNPA1 chimeric constructs (left) were heat shocked, imaged, and A-body presence was quantified (right). 10 cells were analyzed per replicate, and values represent means ± s.e.m. (n  =  3 independent experiments, a two-tailed Student’s t test was used: *p ≤ 0.05). f Cartoon 3D structure of hnRNPA1 (PDB: 1L3K), highlighting the mutation site (F34: red) and surrounding residues that form a hydrophobic pocket (pink). g MCF-7 cells expressing the A-body marker CDC73-mCherry and hnRNPA1(F34A)-GFP were left untreated or heat shocked prior to imaging. h MCF-7 cells expressing the indicated hnRNPA-GFP constructs were heat shock-treated and lysed. Whole cell lysates and insoluble fractions were extracted, and western blotting detected the hnRNPA (α-GFP), GAPDH (soluble) and Histone H3 (insoluble) proteins. i Quantification of FRAP results for heat shock-treated (4 h) MCF-7 cells expressing the indicated proteins. For each quantification 10 cells were analyzed per replicate, and values represent means ± s.e.m (n  =  3 independent experiments). In representative microscopy images, dashed circles represent nuclei, selected regions (white boxes) are expanded (merge: bottom or far-right), white scale bars represent 10 μm. Source data for all graphs and blots are provided with this paper.
Fig. 8
Fig. 8. Model depicting the thermo-sensing mechanism of A-body constituents.
Amyloid bodies form in response to elevated temperatures. Under heat shock conditions, thermo-sensitive proteins locally denature to expose targeting motifs that interact with the seeding IGS RNA (intergenic spacer noncoding RNA) and mediate amyloid fibril formation. Conversely, thermo-stable proteins maintain their native conformation at high temperatures, masking their targeting motifs, and preventing protein aggregation.

Similar articles

Cited by

References

    1. Richter K, Haslbeck M, Buchner J. The heat shock response: life on the verge of death. Mol. Cell. 2010;40:253–266. doi: 10.1016/j.molcel.2010.10.006. - DOI - PubMed
    1. Ciccia A, Elledge SJ. The DNA damage response: making it safe to play with knives. Mol. Cell. 2010;40:179–204. doi: 10.1016/j.molcel.2010.09.019. - DOI - PMC - PubMed
    1. Lee P, Chandel NS, Simon MC. Cellular adaptation to hypoxia through hypoxia inducible factors and beyond. Nat. Rev. Mol. Cell Biol. 2020;21:268–283. doi: 10.1038/s41580-020-0227-y. - DOI - PMC - PubMed
    1. Sies H, Berndt C, Jones DP. Oxidative stress. Annu. Rev. Biochem. 2017;86:715–748. doi: 10.1146/annurev-biochem-061516-045037. - DOI - PubMed
    1. Walter P, Ron D. The unfolded protein response: from stress pathway to homeostatic regulation. Science. 2011;334:1081–1086. doi: 10.1126/science.1209038. - DOI - PubMed