. 2024 Feb 9;15(1):1231.
doi: 10.1038/s41467-024-45489-4.

Androgen deprivation induces double-null prostate cancer via aberrant nuclear export and ribosomal biogenesis through HGF and Wnt activation

Affiliations

Androgen deprivation induces double-null prostate cancer via aberrant nuclear export and ribosomal biogenesis through HGF and Wnt activation

Won Kyung Kim et al. Nat Commun. .

Abstract

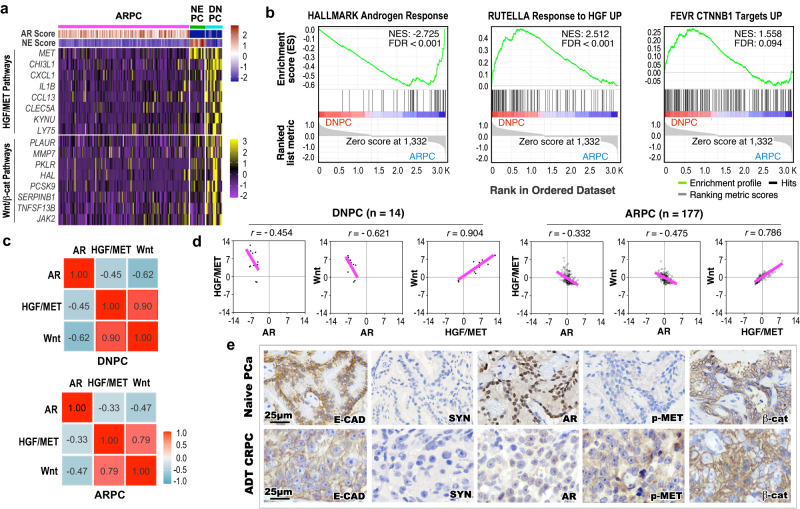
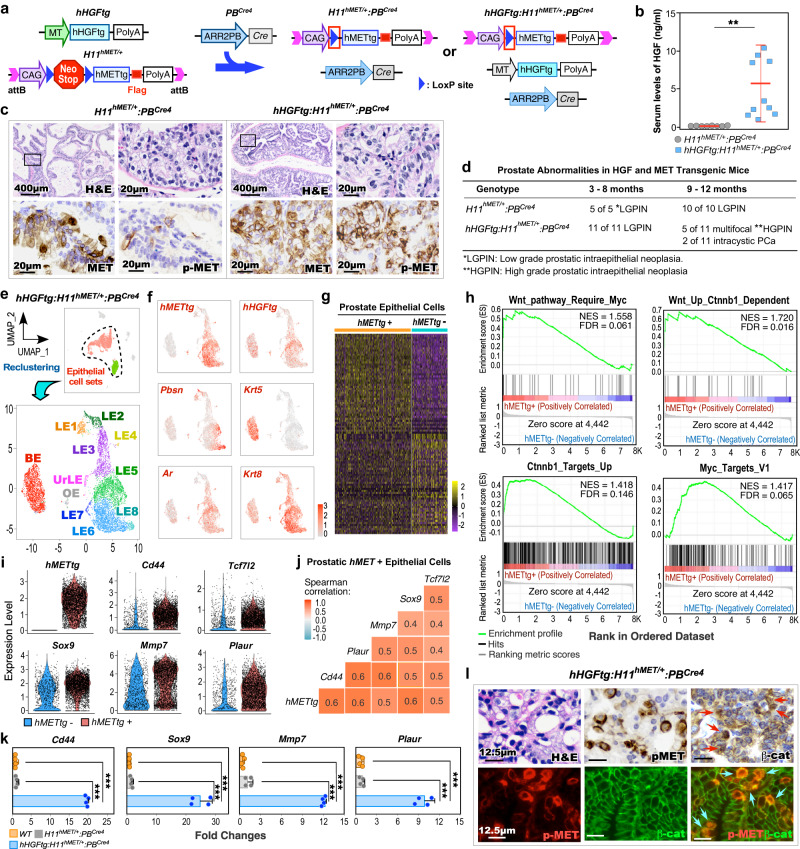
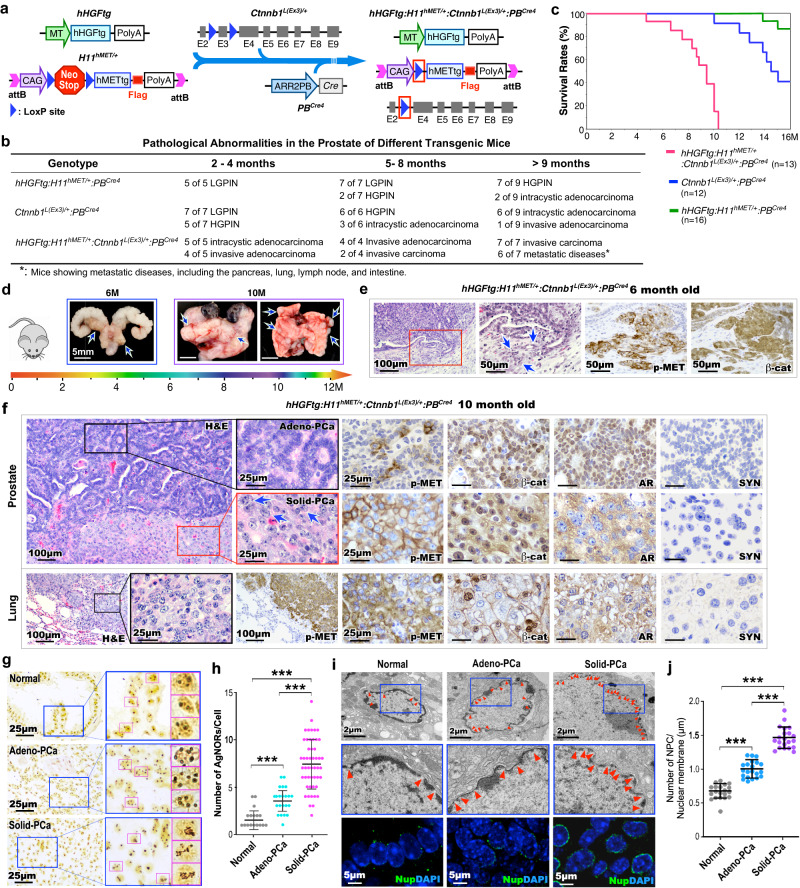
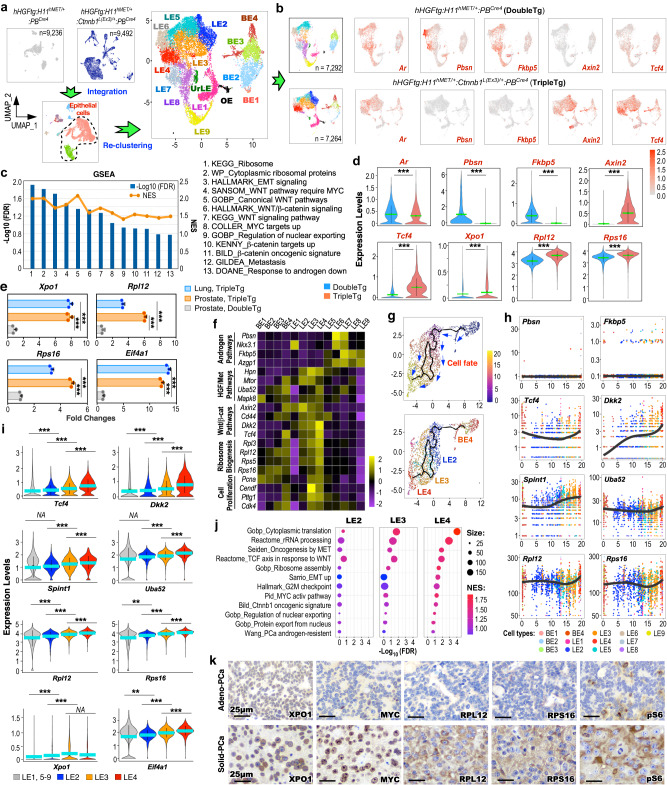
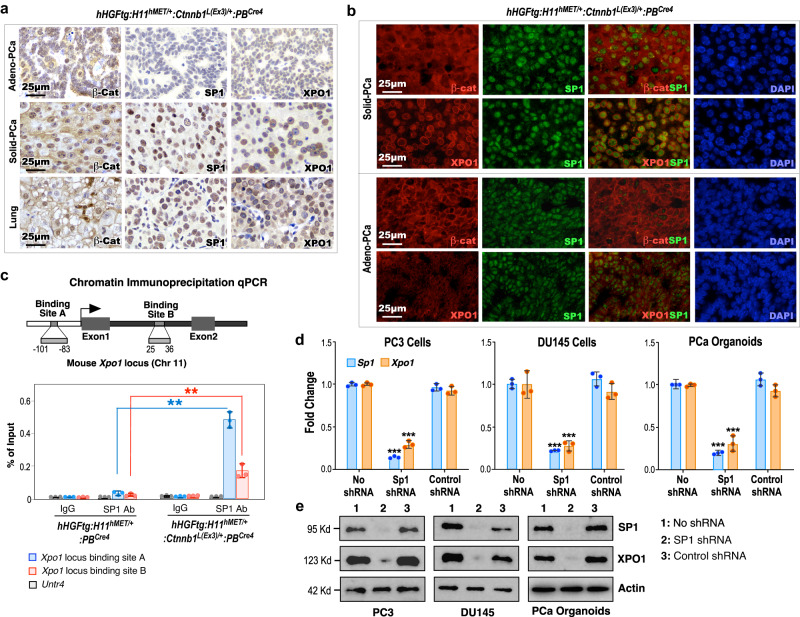
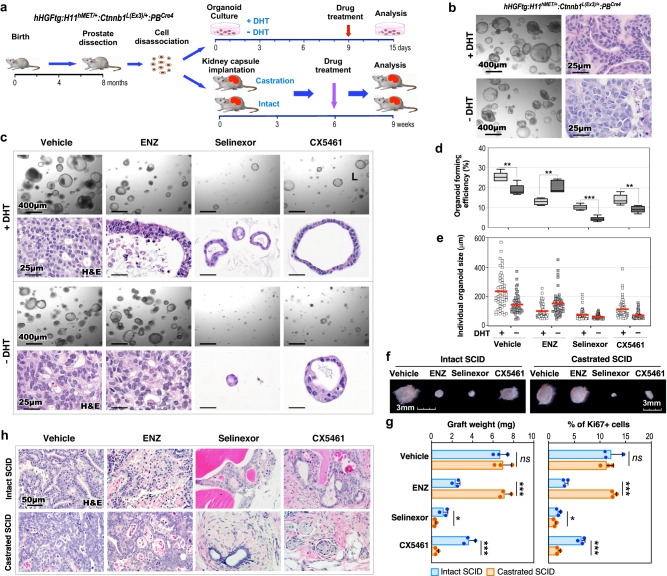
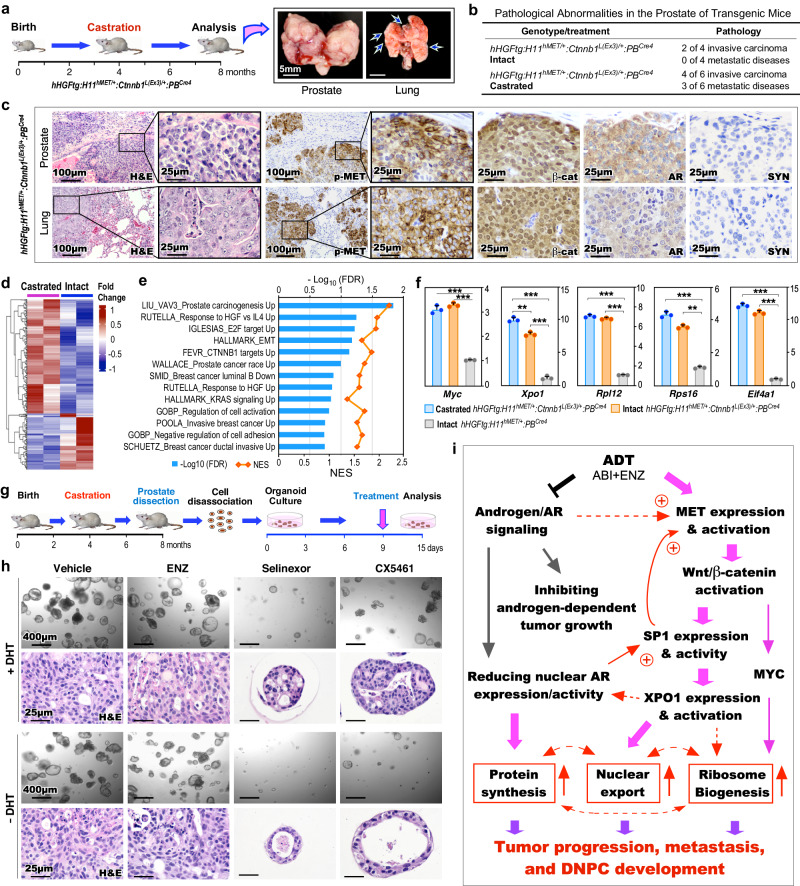
Androgen deprivation therapy (ADT) targeting androgen/androgen receptor (AR)- signaling pathways is the main therapy for advanced prostate cancer (PCa). However, ADT eventually fails in most patients who consequently develop castration-resistant prostate cancer (CRPC). While more potent AR antagonists and blockers for androgen synthesis were developed to improve clinical outcomes, they also show to induce more diverse CRPC phenotypes. Specifically, the AR- and neuroendocrine-null PCa, DNPC, occurs in abiraterone and enzalutamide-treated patients. Here, we uncover that current ADT induces aberrant HGF/MET signaling activation that further elevates Wnt/β-catenin signaling in human DNPC samples. Co-activation of HGF/MET and Wnt/β-catenin axes in mouse prostates induces DNPC-like lesions. Single-cell RNA sequencing analyses identify increased expression and activity of XPO1 and ribosomal proteins in mouse DNPC-like cells. Elevated expression of XPO1 and ribosomal proteins is also identified in clinical DNPC specimens. Inhibition of XPO1 and ribosomal pathways represses DNPC growth in both in vivo and ex vivo conditions, evidencing future therapeutic targets.


Conflict of interest statement

The authors declare no competing interests.

Figures

Fig. 1
Fig. 1. Aberrant activation of HGF/MET and Wnt signaling pathways in human double-negative AR-null NE-null prostate cancer patients.
a Heatmap showing score of indicated gene signatures or expression profile of indicated genes across human metastatic castration-resistant prostate cancer (mCRPC) samples obtained from SU2C/PCF RNA-seq datasets (2019) at cBioPortal, (ARPC AR-active prostate cancers, n = 177; NEPC neuroendocrine prostate cancers, n = 13; DNPC double-negative AR-null NE-null prostate cancers, n = 14). Scores of AR- or NE-associated gene signature are shown in the top panel based on the previous study. HGF/MET pathway-associated genes and Wnt/β-catenin downstream target genes are listed in the middle and bottom panel, respectively. Colors reflect the level of gene signature score or expression. See “Methods” section. b Gene Set Enrichment Analysis (GSEA) enrichment plots of pre-ranked gene list from differentially expressed genes (DEGs) comparing DNPC to ARPC samples. NES normalized enrichment score, FDR false discovery rate. See Supplementary Data 1. c Heatmap of pairwise Spearman correlation between the indicated gene signatures in indicated CRPC samples. Numbers indicate correlation coefficient. Colors reflect the correlation coefficient value. d Scatter plots displaying the mRNA expression z-scores of indicated gene signatures in indicated CRPC samples. The pink lines show association between the gene signatures and r indicates Spearman’s correlation coefficient. e Representative images of immunohistochemistry staining using the indicated antibodies on tumor tissues from naive primary prostate adenocarcinoma (PCa, n = 5) and androgen deprivation therapy (ADT)-treated CRPC patients (n = 6, please also see the “Material” section). AR androgen receptor, NE neuroendocrine, E-CAD E-cadherin, SYN synaptophysin, pMET phosphorylated MET, β-cat β-catenin. Representative images from three independent experiments with similar results are displayed for each micrograph. Scale bars, 25 μm.
Fig. 2
Fig. 2. HGF/MET signaling activates canonical Wnt signaling in prostate oncogenesis.
a Schematic of the human HGF (hHGFtg) and MET (H11hMET) transgenes, and PBCre4 alleles, shown in relation to the mating strategy. b Serum HGF levels of H11hMET/+:PBCre4 (n = 8) and hHGFtg:H11hMET/+:PBCre4 (n = 10) mice. c Representative images of hematoxylin-eosin (H&E) and immunohistochemistry (IHC) staining using the indicated antibodies on adjacent prostate tissues from the indicated mice. Scale bars, 400 μm, 20 μm. d Table summarizing the pathological abnormalities in the prostates of H11hMET/+:PBCre4 and hHGFtg:H11hMET/+:PBCre4 mice at the indicated age. e Uniform Manifold Approximation and Projection (UMAP) plots presenting total cells (n = 9236) with highlighting prostatic epithelial cells (both green and red cell clusters) from hHGFtg:H11hMET/+:PBCre4 mice, and epithelial cells (n = 7286) being further sub-clustered, re-clustered, and labeled by epithelial cell cluster (bottom). The dotted line delineated the prostatic epithelial cells. BE basal epithelial cells, LE luminal epithelial cells, UrLE urethral epithelial cells, OE other epithelial cells. f Gene expression UMAP plots for the indicated genes in epithelial cells (n = 7286). Color intensity indicates the scaled expression level. g Heatmap showing DEGs between hMETtg+ and hMETtg− epithelial cells. See Supplementary Data 2. h GSEA plots showing the positive enrichment of the indicated gene sets comparing hMETtg+ and hMETtg− cells. NES normalized enrichment score, FDR false discovery rate. i Violin plots visualizing the expression levels of hMETtg and Wnt downstream target genes in hMETtg+ (n = 4533) and hMETtg− (n = 2753) epithelial cells. Black dots correspond to individual epithelial cells. j Heatmap of pairwise Spearman correlation between the indicated genes in hMETtg+ epithelial cells. Colors reflect the correlation coefficient value. k qPCR analysis of the indicated genes shown as fold change in indicated mouse prostate tissues from four biological replicates. l Representative images of H&E, IHC, and immunofluorescence staining (IF) using indicated antibodies on adjacent sections from hHGFtg:H11hMET/+:PBCre4 mice. Red and blue arrows indicate nuclear β-catenin and co-overlay of pMET with nuclear β-catenin, respectively. Representative images with consistent results from three biological replicates are shown. Scale bars, 12.5 μm. In b and k, data are mean ± s.d. **P < 0.01, ***P < 0.001; Unpaired two-tailed t-tests. See source data and the exact P values in the Source Data file.
Fig. 3
Fig. 3. Aberrant activation of HGF/MET and Wnt signaling pathways develops DNPC with metastatic and aggressive properties.
a Schematic of generating different transgenic mice as indicated above. b Table summarizing the pathological abnormalities in the prostates from different genotype mice. c Kaplan–Meier survival curves for the indicated transgenic mice. d Representative gross images of prostate tumor tissues with seminal vesicles and urinary bladders and lung tissues from either 6- or 10-month-old hHGFtg:H11hMET/+:Ctnnb1L(Ex3)/+:PBCre4 mice. Blue arrows indicate primary tumor or metastasis loci. e Representative images of H&E and IHC staining using the indicated antibodies on adjacent prostate tissues from hHGFtg:H11hMET/+:Ctnnb1L(Ex3)/+:PBCre4 mice at 6 months of age. Blue arrows point to invasive lesions. f Representative images of H&E and IHC staining using the indicated antibodies on adjacent prostate (top) and lung (bottom) tissues from 10- month-old hHGFtg:H11hMET/+:Ctnnb1L(Ex3)/+:PBCre4 mice. Blue arrows indicate enlarged nucleoli. g Representative images of AgNOR stained prostate tissue sections containing normal prostatic glands, gland-forming prostate adenocarcinoma (Adeno-PCa), and solid prostate carcinoma (Solid-PCa) lesions in hHGFtg:H11hMET/+:Ctnnb1L(Ex3)/+:PBCre4 mice. Pink box highlights single nucleus. h Quantification of AgNOR number in individual cells from the indicated loci. Numbers of AgNORs per cells were measured for 50 cells in each image, and at least 5 images from three biological replicates were analyzed. i Representative images of transmission electron microscopy (top) and immunofluorescent staining for Nups (NUP62, NUP98, and NUP214) detected by mAb414 antibody (bottom) in the indicated loci from prostate tissues. Red arrowheads point to nuclear pore complexes (NPC). Nuclei were stained with DAPI. j Numbers of NPC per μm of nuclear membrane were quantified, at least 20 cells in each image and 5 images from three biological replicates were analyzed. Representative images with consistent results from three biologically independent experiments are shown. Scale bars, 100 μm (e, f), 50 μm (e), 25 μm (f, g), 5 μm (i), 2 μm (i). In h and j, data are represented as mean ± s.d. **P < 0.01; Unpaired two-tailed t-tests. Source data and the exact P values are provided in the Source Data file.
Fig. 4
Fig. 4. Nuclear export signal and ribosomal biogenesis promote prostate cancer progression and aggressiveness.
a Individual UMAP visualization of cells from DoubleTg (top left, gray) and TripleTg (top middle, dark blue) prostates, and integrated cells colored by cell type identities (bottom). UMAP plot of epithelial cells re-clustered and labeled as BE, basal epithelial cells; LE, luminal epithelial cells; UrLE, urethral epithelial cells; OE, other epithelial cells (top right). b UMAP plots showing indicated gene expression, separated by each genotype. Color intensity indicates the scaled expression level. c GSEA compares hMETtg+ cells from TripleTg versus DoubleTg mice. See Supplementary Data 3. d Violin plots visualizing the indicated gene expressions in hMETtg+ cells (DoubleTg, n = 4417; TripleTg, n = 2144) of each genotype. e qPCR analysis of the indicated genes shown as fold changes in the indicated tissues from three biological replicates. f Heatmap depicting average expression of genes associated with indicated pathways in each cluster. g Pseudotime trajectory plots of hMETtg+ cells (n = 2144) from TripleTg mice, visualized on UMAP plots by pseudotime (top) and cluster identity (bottom). h Linear pseudotime expression plots showing dynamics of indicated gene expression over pseudotime in hMETtg+ cells from TripleTg mice. Dots correspond to individual cells colored by cluster identity. i Violin plot visualizing the expression levels of indicated genes from TripleTg mice (LE1, 5–9, n = 1934; LE2, n = 1165; LE3, n = 1666; LE4, n = 1096). j Bubble charts showing GSEA by comparing LE2, LE3, or LE4 versus other LEs in TripleTg sample. Color and size of bubbles represents NES and weighted numbers of genes. See Supplementary Data 4–6. k Representative images of IHC using indicated antibodies on adjacent sections from TripleTg mice. Representative images with consistent results from three biological replicates are shown. Scale bars, 25 μm. In di, data are mean ± s.d. **P < 0.01 and ***P < 0.001, two-tailed Wilcoxon Rank Sum tests (d, i), unpaired two-tailed t-tests (e). Green or blue bar indicates the mean value (d, i). Source data and the exact P values are provided in the Source Data file.
Fig. 5
Fig. 5. Aberrant activation of HGF and Wnt signaling increases CRM1/XPO1 expression through increased SP1 expression.
a Representative images of IHC staining using the indicated antibodies on different prostate lesions (top and middle) and lung (bottom) tissues from 10-month-old hHGFtg:H11hMET/+:Ctnnb1L(Ex3)/+:PBCre4 mice. b Representative images of co-IF staining of SP1 with β-catenin or XPO1 in prostate tissues of hHGFtg:H11hMET/+:Ctnnb1L(Ex3)/+:PBCre4 mice. c The scheme of the Xpo1 gene locus and ChIP-qPCR analyses on SP1 binding sites using indicted antibodies. d qPCR analysis of SP1 and XPO1 shown as fold change in PC3 cells, DU145 cells, and organoids derived from dissected prostate cells of hHGFtg:H11hMET/+:Ctnnb1L(Ex3)/+:PBCre4 mice. e Immunoblotting of cell lysates after indicated shRNA treatment showing protein expression of SP1, XPO1, and Actin in PC3, DU145, and prostate organoid cells derived from PCa tumors of hHGFtg:H11hMET/+:Ctnnb1L(Ex3)/+:PBCre4 mice. Actin was used as an internal standard. In c and d, data are represented as mean ± s.d. of three biological replicates. **P < 0.01, ***P < 0.001; Unpaired two-tailed t-tests. In a, b, and e, representative images with consistent results from three biological replicates are shown. Scale bars, 25 μm. Source data and the exact P values are provided in the Source Data file.
Fig. 6
Fig. 6. Aberrant activation of XPO1 and ribosomal synthesis pathways converts PCa cellular properties and promotes androgen-independent growth.
a Schematic representation of the experimental design for the organoid culture and kidney capsule transplantation assays. Organoids derived from dissected prostate cells of hHGFtg:H11hMET/+:Ctnnb1L(Ex3)/+:PBCre4 mice were developed and then treated with vehicle and different inhibitors in the presence or absence of DHT for 6 days. Intact and castrated SCID host mice transplanted with dissected prostate cells of hHGFtg:H11hMET/+:Ctnnb1L(Ex3)/+:PBCre4 mice were administrated with vehicle and different inhibitors. See “Methods” section. b Representative images of brightfield and H&E staining for organoids in the presence or absence of DHT. c Representative images of brightfield and H&E staining for organoids with indicated treatments. d Quantification of organoid forming efficiency showing the percentage of organoids above 50 μm diameter per total cells seeded at day 0 in a well. The center line represents the median value, the box borders represent the lower and upper quartiles (25% and 75% percentiles, respectively), and the ends of the bottom and top whiskers represent the minimum and maximum values, respectively, for five independent samples over three biological replicates. e Quantification of individual organoid size. Organoids per treatment group (n = 50) examined over three independent experiments. The center red bar indicates the mean value in each group. fh Representative image for gross (f) or H&E staining (h) of xenografts with the indicated treatments. Weights of xenografts (n = 3; left) and quantification of Ki67+ cells per total cells (right) from groups treated as indicated (g). Data are represented as mean ± s.d. of three biological replicates. Representative images from three biological replicates are shown. In d and g, *P < 0.05, **P < 0.01, ***P < 0.001; Unpaired two-tailed t-tests. Source data and the exact P values are provided in the Source Data file.
Fig. 7
Fig. 7. XPO1 activation mediated by HGF/Wnt pathways promotes androgen-independent DNPC progression.
a Schematic representation of experimental design and representative gross images of primary prostate tumors and lung metastases from castrated hHGFtg:H11hMET/+:Ctnnb1L(Ex3)/+:PBCre4 mice. b Table summarizing the pathological abnormalities in the prostates of intact and castrated mice. c Representative images of H&E and IHC staining using the indicated antibodies on adjacent prostate and lung tissues d Heatmap showing the expression patterns of DEGs from the comparisons of bulk RNA-seq data from prostate tissues from castrated and intact hHGFtg:H11hMET/+:Ctnnb1L(Ex3)/+:PBCre4 mice. Red and blue colors indicate up- and down-regulation, respectively. See Supplementary Data 7. e GSEA results from pre-ranked DEG list comparing castrated versus intact TripleTg samples. f qPCR analysis of the indicated genes shown as fold change in prostate tissues from the indicated mice. Data are mean ± s.d. of three biological replicates. **P < 0.01, ***P < 0.001; Unpaired two-tailed t-tests. g Schematic representation of the experimental design for the ex vivo organoid culture performed. Organoids derived from prostate tumor cells of castrated hHGFtg:H11hMET/+:Ctnnb1L(Ex3)/+:PBCre4 mice were treated with vehicle, ENZ, Selinexor, or CX5461 in presence or absence of DHT for 6 days. See Methods section. h Representative images of brightfield and H&E staining of the organoids with the indicated treatments. i Schematic of hypothetic models by which current ADT induces DNPC development through HGF/Wnt-induced activation of XPO1 and ribosome biogenesis through SP1. Representative images with consistent results from three biological replicates are shown. Scale bars, 5 mm (a), 400 μm (h), 100 μm (c), 25 μm (c, h). Source data and the exact P values are provided in the Source Data file.

References

    1. Rawla P. Epidemiology of prostate cancer. World J. Oncol. 2019;10:63–89. doi: 10.14740/wjon1191. - DOI - PMC - PubMed
    1. Culig Z, Klocker H, Bartsch G, Steiner H, Hobisch A. Androgen receptors in prostate cancer. J. Urol. 2003;170:1363–1369. doi: 10.1097/01.ju.0000075099.20662.7f. - DOI - PubMed
    1. Jenster G. The role of the androgen receptor in the development and progression of prostate cancer. Semin. Oncol. 1999;26:407–421. - PubMed
    1. Gelmann EP. Molecular biology of the androgen receptor. J. Clin. Oncol. 2002;20:3001–3015. doi: 10.1200/JCO.2002.10.018. - DOI - PubMed
    1. Abate-Shen C, Shen MM. Molecular genetics of prostate cancer. Genes Dev. 2000;14:2410–2434. doi: 10.1101/gad.819500. - DOI - PubMed