. 2024 Feb 10;26(1):47.
doi: 10.1186/s13075-024-03280-2.

Large-scale integrative analysis of juvenile idiopathic arthritis for new insight into its pathogenesis

Affiliations

Large-scale integrative analysis of juvenile idiopathic arthritis for new insight into its pathogenesis

Daeun Kim et al. Arthritis Res Ther. .

Abstract

Background: Juvenile idiopathic arthritis (JIA) is one of the most prevalent rheumatic disorders in children and is classified as an autoimmune disease (AID). While a robust genetic contribution to JIA etiology has been established, the exact pathogenesis remains unclear.

Methods: To prioritize biologically interpretable susceptibility genes and proteins for JIA, we conducted transcriptome-wide and proteome-wide association studies (TWAS/PWAS). Then, to understand the genetic architecture of JIA, we systematically analyzed single-nucleotide polymorphism (SNP)-based heritability, a signature of natural selection, and polygenicity. Next, we conducted HLA typing using multi-ethnicity RNA sequencing data. Additionally, we examined the T cell receptor (TCR) repertoire at a single-cell level to explore the potential links between immunity and JIA risk.

Results: We have identified 19 TWAS genes and two PWAS proteins associated with JIA risks. Furthermore, we observe that the heritability and cell type enrichment analysis of JIA are enriched in T lymphocytes and HLA regions and that JIA shows higher polygenicity compared to other AIDs. In multi-ancestry HLA typing, B*45:01 is more prevalent in African JIA patients than in European JIA patients, whereas DQA1*01:01, DQA1*03:01, and DRB1*04:01 exhibit a higher frequency in European JIA patients. Using single-cell immune repertoire analysis, we identify clonally expanded T cell subpopulations in JIA patients, including CXCL13+BHLHE40+ TH cells which are significantly associated with JIA risks.

Conclusion: Our findings shed new light on the pathogenesis of JIA and provide a strong foundation for future mechanistic studies aimed at uncovering the molecular drivers of JIA.

Keywords: Juvenile idiopathic arthritis; Multi-ethnicity RNA typing; T cell receptor (TCR) repertoire; Transcriptome-wide and proteome-wide association studies.


Conflict of interest statement

The authors declare no competing interests.

Figures

Fig. 1
Fig. 1
Manhattan plots for JIA TWAS/PWAS result. The upper and lower panels show Manhattan plots for JIA TWAS and PWAS results, respectively. Each dot represents a P-value for a TWAS or PWAS association between JIA and the predicted expression level of a gene or cis-regulated plasma protein. The black and green horizontal dashed lines indicate the significance thresholds of TWAS and PWAS with Bonferroni correction (PTWAS < 7.55 × 10−07 and PPWAS < 2.16 × 10−05). Statistically significant TWAS associations of JIA are colored by tissue panels. The black dots of the lower panel indicate statistically significant PWAS associations of JIA. The names of TWAS genes and PWAS proteins with PIP > 0.2 in FOCUS are labeled
Fig. 2
Fig. 2
Disease heritability analysis of JIA. A–C LD score regression in specifically expressed genes (LDSC-SEG) analysis applied to JIA GWAS data using epigenetic markers from blood cell types. A The enrichment results of LDSC-SEG analysis using active promoter or gene markers. B The enrichment results of LDSC-SEG analysis using active enhancer markers. The black dotted line represents a significant threshold based on the Bonferroni-corrected P < 1.16 × 10−04 (0.05/431). C The enrichment results of LDSC-SEG analysis using ATAC-seq data. The black dotted line represents a significant threshold based on the Bonferroni-corrected P < 3.85 × 10−03 (0.05/13). D,E Estimation of the proportion of heritability mediated by the gene expression levels (hmed2/hg2) using mediated expression score regression (MESC) for JIA, AIDALL, and AIDSURE. D The MESC results of all tissues (expression scores from meta-analyses across all 48 GTEx tissues), connective tissues (expression scores from meta-analyses using 12 connective tissues), and whole blood tissue from GTEx v8. E The MESC results from whole blood tissue from eQTLGen. Error bars indicate jackknife standard errors
Fig. 3
Fig. 3
Genetic architecture of JIA. A Estimation of the three genetic architecture parameters for JIA, AIDALL, and AIDSURE using Summary-data-based BayesS (SBayesS). The dots and horizontal bars represent the posterior means and standard errors, respectively. The red and orange colors represent SBayesS and SBayesS excluding HLA regions. B Cumulative local SNP heritability across the genome using heritability estimates from Summary statistics (HESS). Total SNP-based genes are indicated. The red color shows SNP heritability explained by the HLA region
Fig. 4
Fig. 4
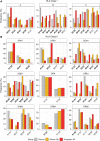
Consensus frequencies of HLA allele types in healthy controls, African JIA patients, and European JIA patients. A Bar plots showing the consensus frequencies of HLA allele types at HLA class I loci. B Bar plots showing the consensus frequencies of HLA allele types at HLA class II loci. The x- and y-axis indicate the names and frequencies of HLA allele types, respectively. The names of HLA types having significantly different distributions between healthy controls, African JIA patients, and European JIA patients were represented in bold (P < 0.05)
Fig. 5
Fig. 5
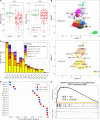
TCR diversities in JIA. A Box plots showing the alpha diversities of TCR α and β in healthy control and JIA groups. The y-axis indicates alpha diversity representing the clonotypic diversity of specific TCR locus. Green and red dots indicate samples of healthy controls and JIA patients, respectively. Asterisks denote the significance levels of differences between the clonotypic diversities of TCRs within healthy controls and that within JIA patients. *, P < 0.05; **, P < 0.01; ***, P < 0.001. B A Uniform Manifold Approximation and Projection (UMAP) plot of 67,235 T cells from seven JIA patients showing 16 major clusters (nine for 34,605 CD4+ and seven for 32,630 CD8+ T cells). Each dot represents an individual T cell and color indicates cluster origin. C Left. A bar plot showing the number of single T cells and frequencies of unique and expanded T cell clones in each cluster. The inset numbers indicate the proportion of the cell type in the cluster. Right. UMAP plot showing the clusters with the clone types. The colors correspond to the number of clones (i.e. clonal abundance). D A scatter plot showing the alpha diversity of TCR in each cluster. The red and blue colors denote CD4+ and CD8+ T cells, respectively. E Module enrichment analysis between expression levels of scRNA-seq CD4_C5 cluster and black co-expression gene set derived from JIA case-control expression data (GSE13501). The gene list of the black modules is in Table  S9.

Similar articles

References

    1. Barut K, Adrovic A, Şahin S, Kasapçopur Ö. Juvenile Idiopathic Arthritis Balk. Med J. 2017;34:90–101. - PMC - PubMed
    1. Kim D, Song J, Lee S, Jung J, Jang W. An integrative transcriptomic analysis of systemic juvenile idiopathic arthritis for identifying potential genetic markers and drug candidates. Int J Mol Sci. 2021;22:712. doi: 10.3390/ijms22020712. - DOI - PMC - PubMed
    1. Li J, et al. Identification of Target Genes at Juvenile Idiopathic Arthritis GWAS Loci in Human Neutrophils. Front Genet. 2019;10:181. doi: 10.3389/fgene.2019.00181. - DOI - PMC - PubMed
    1. Gusev A, et al. Integrative approaches for large-scale transcriptome-wide association studies. Nat Genet. 2016;48:245–252. doi: 10.1038/ng.3506. - DOI - PMC - PubMed
    1. Shiina T, Hosomichi K, Inoko H, Kulski JK. The HLA genomic loci map: expression, interaction, diversity and disease. J Hum Genet. 2009;54:15–39. doi: 10.1038/jhg.2008.5. - DOI - PubMed

Publication types