. 2024 Feb 9;15(1):1217.
doi: 10.1038/s41467-024-45523-5.

Natural diversity screening, assay development, and characterization of nylon-6 enzymatic depolymerization

Affiliations

Natural diversity screening, assay development, and characterization of nylon-6 enzymatic depolymerization

Elizabeth L Bell et al. Nat Commun. .

Abstract

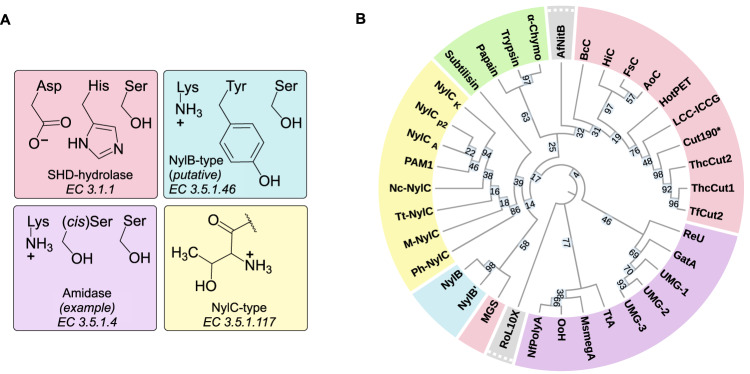
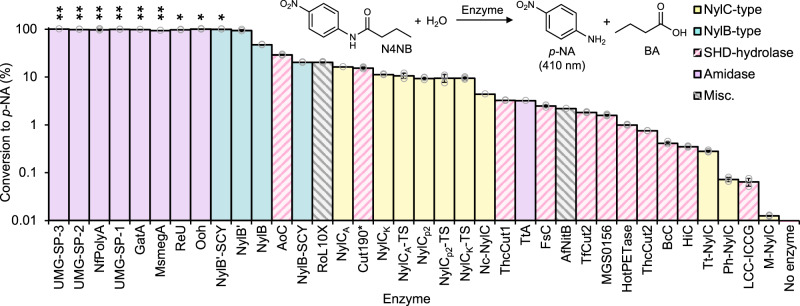
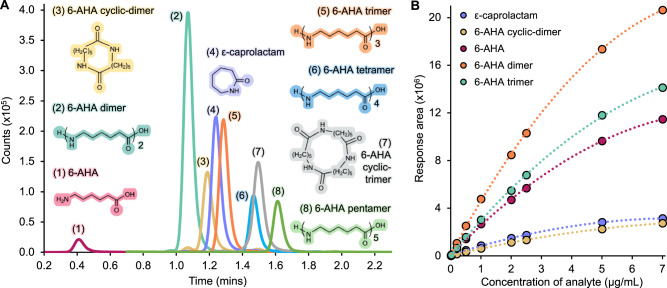
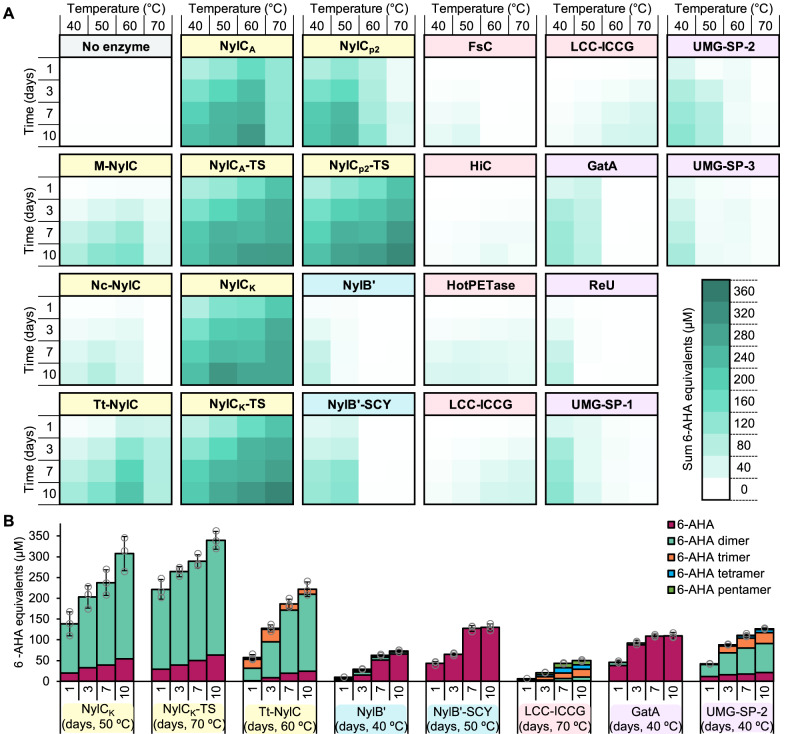
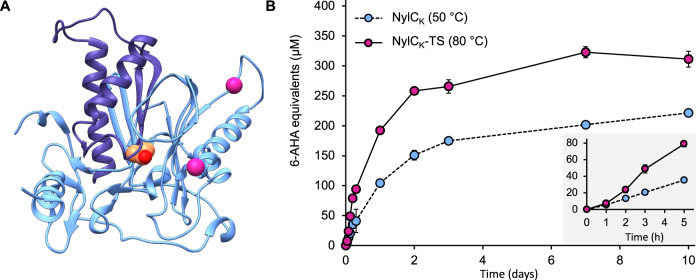
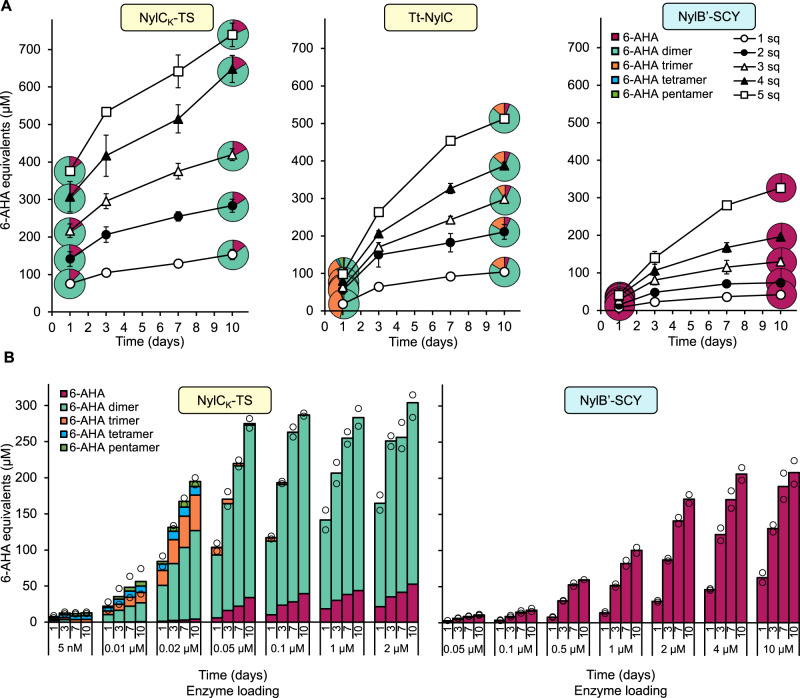
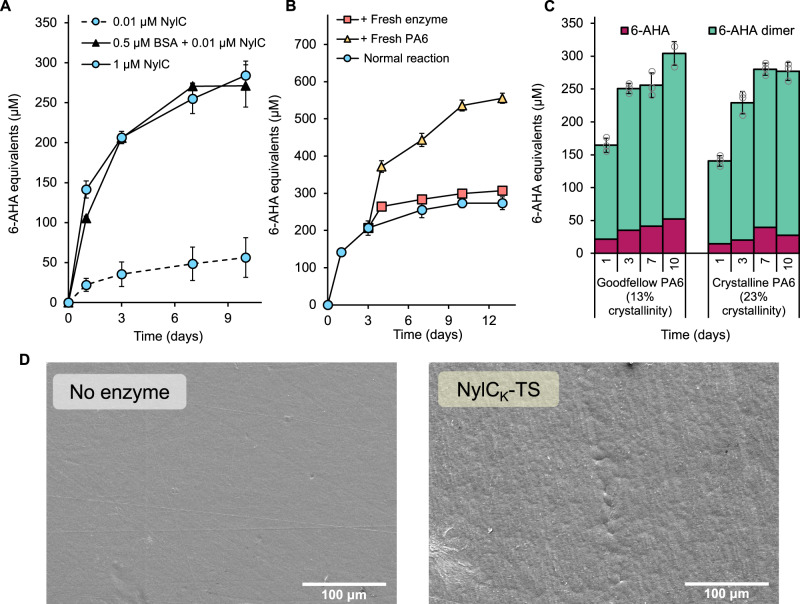
Successes in biocatalytic polyester recycling have raised the possibility of deconstructing alternative polymers enzymatically, with polyamide (PA) being a logical target due to the array of amide-cleaving enzymes present in nature. Here, we screen 40 potential natural and engineered nylon-hydrolyzing enzymes (nylonases), using mass spectrometry to quantify eight compounds resulting from enzymatic nylon-6 (PA6) hydrolysis. Comparative time-course reactions incubated at 40-70 °C showcase enzyme-dependent variations in product distributions and extent of PA6 film depolymerization, with significant nylon deconstruction activity appearing rare. The most active nylonase, a NylCK variant we rationally thermostabilized (an N-terminal nucleophile (Ntn) hydrolase, NylCK-TS, Tm = 87.4 °C, 16.4 °C higher than the wild-type), hydrolyzes 0.67 wt% of a PA6 film. Reactions fail to restart after fresh enzyme addition, indicating that substrate-based limitations, such as restricted enzyme access to hydrolysable bonds, prohibit more extensive deconstruction. Overall, this study expands our understanding of nylonase activity distribution, indicates that Ntn hydrolases may have the greatest potential for further development, and identifies key targets for progressing PA6 enzymatic depolymerization, including improving enzyme activity, product selectivity, and enhancing polymer accessibility.


Conflict of interest statement

ELB, EE, and GTB have filed a patent application on engineered nylonase enzymes. All other authors declare no competing interests.

Figures

Fig. 1
Fig. 1. Nylonase activity is found across enzymes with different active site architectures and diverse substrate preferences.
A Example catalytic residues used by potential nylonases: Ser-His-Asp (SHD) serine hydrolases, NylB-type serine hydrolases (putative catalytic triad for this enzyme group, only two known enzymes described), amidases (example amidase catalytic triad used by Ser-(cis)Ser-Lys amidases), and NylC-type N-terminal nucleophile hydrolases. B Phylogenetic tree of enzymes selected for potential PA6 deconstruction activity, colored to match the enzyme groupings used throughout (yellow: NylC-type, blue: NylB-type, purple: amidase, pink: SHD-hydrolase, green: protease, gray: misc.). Inset numbers on the branches represent confidence values (%). References for the enzyme source and group are available in Supplementary Data 1, enzyme sequences, EC numbers, and expression conditions are available in Supplementary Data 2. α-Chymo α-Chymotrypsin, HotPET HotPETase, MGS MGS0156, UMG-1 UMG-SP-1, UMG-2 UMG-SP-2, UMG-3 UMG-SP-3.
Fig. 2
Fig. 2. N-(4-nitrophenyl)butanamide (N4NB) activity assays with potential nylonases.
All successfully expressed enzymes were tested for their ability to hydrolyze the amide bond in N4NB, leading to the release of p-nitroaniline (p-NA, monitored spectrophotometrically at 410 nm) and butyric acid (BA). The bar chart shows the conversion extent of N4NB to p-NA after 5 h of reaction using 0.5 mM N4NB and 2 µM enzyme at 30 °C in reaction buffer (100 mM sodium phosphate buffer (NaPi), pH 7.5, 150 mM NaCl). Enzymes are colored by their group from Fig. 1, with SHD-hydrolase and misc. group bars hashed to aid clarity; the proteases exhibited no detectable activity and thus are not shown. A double asterisk (**) indicates reactions with enzymes that went to completion in ≤ 5 min, a single asterisk (*) indicates reactions with enzymes which went to completion in ≤ 30 min. All reactions are ordered with respect to reaction rate, with the fastest enzymes to the left. A no enzyme control reaction led to no detectable release of p-NA. Data shown are baseline corrected. Reactions were carried out in triplicate (n = 3), error bars show the standard deviation of the replicate measurements, the error bar centers are the means of the replicate measurements, and the replicate measurements are represented as gray circles. References for the enzyme source and group are available in Supplementary Data 1, and the enzyme sequences, EC numbers, and expression conditions are in Supplementary Data 2. Source data are provided in the Source Data file.
Fig. 3
Fig. 3. LC-MS/MS analysis of major soluble compounds present in enzymatic PA6 deconstruction reactions.
A Representative LC-MS/MS chromatogram following enzymatic hydrolysis of PA6 (0.01 µM NylCK-TS, 13 mg PA6, 60 °C), showing the eight compounds that were detected and quantified. B Representative calibration plot of standards run prior to analysis of samples by LC-MS/MS, showing the five chemical standards (analytes) that were available commercially, measured from 0.01-7.0 µg/mL. The 6-AHA tetramer and pentamer concentrations, and the 6-AHA cyclic-trimer concentrations were determined using the calibration curves from the 6-AHA trimer and 6-AHA cyclic-dimer, respectively, as no commercial standards were available. The dotted line represents the quadratic line of best fit for each analyte. Source data are provided in the Source Data file.
Fig. 4
Fig. 4. Enzymatic PA6 depolymerization reactions with the top performing enzymes from each group.
A Heat map time-course profiles of the total released (sum) 6-AHA monomer equivalents following PA6 depolymerization reactions with the top performing NylC-type (yellow), NylB-type (blue), SHD-hydrolase (pink), and amidase (purple) enzymes, carried out from 40 to 70 °C over 10 days. The heat map gradient represents the released 6-AHA monomer equivalents from 0 to 360 µM, with each square representing the average of reactions carried out in triplicate (n = 3). (Full enzyme names and sources are in Supplementary Data 1.) B Representative depolymerization reactions with enzymes from each group at their optimal temperatures (reactions conducted between 40 and 70 °C, x-axis), with 6-AHA oligomers of different lengths represented as their 6-AHA monomer equivalents. Reactions were carried out in triplicate (n = 3), error bars show the standard deviation of the replicate measurements, the error bar centers are the means of the replicate measurements, and the replicate measurements are represented as gray circles. For all data in (A) and (B), the reactions contained 2 µM enzyme and 13 mg PA6 (0.15 mM enzyme/g PA6, 0.65 wt% substrate loading) and were incubated in reaction buffer (100 mM NaPi buffer, pH 7.5, 150 mM NaCl). Source data are provided in the Source Data file.
Fig. 5
Fig. 5. Comparison of NylCK and the thermostabilized variant NylCK-TS.
A Mutational map of NylCK-TS (NylCK-S111G/A137L) using the crystal structure of the close homolog NylCA (PDB: 3AXG [10.2210/pdb3AXG/pdb]) as a scaffold. NylCK-TS is an αβ heterodimer, which is represented by the light and dark blue ribbons; the catalytic residue (T267) is shown as a van der Waals surface colored by all atoms with orange carbon atoms; the thermostabilizing mutations are represented as pink spheres. Residues 261-266 are unmodelled in the PDB structure and are represented as a dashed line. B Total released linear 6-AHA oligomers following PA6 film depolymerization reactions with either 1 µM NylCK or 1 µM NylCK-TS and 13 mg PA6 (0.08 mM enzyme/g PA6, 0.65 wt% substrate loading), at the temperature where the highest depolymerization extent was seen (reactions conducted from 40 to 80 °C). The gray inset graph is an expansion of the early time points taken during the reaction. Reactions were carried out in triplicate (n = 3), error bars represent the standard deviation of the replicate measurements, and the error bar centers are the mean of the replicate measurements. Source data are provided in the Source Data file.
Fig. 6
Fig. 6. Exploration of reaction conditions for enzymatic PA6 depolymerization.
A Total released linear 6-AHA oligomers, represented as 6-AHA monomer equivalents, in reactions with 1 µM NylCK-TS (60 °C), Tt-NylC (60 °C), or NylB’-SCY (50 °C), over the course of 10 days, varying the substrate loading from 1 to 5 PA6 squares (6.5–32.5 mg PA6, substrate loading of 0.32-1.6 wt%, sq=squares). Pie-charts represent the proportion of different 6-AHA oligomers measured at that time point. Reactions were carried out in triplicate (n = 3), error bars show the standard deviation of the replicate measurements, the error bar centers are the means of the replicate measurements, and circle, square, and triangle points represent the mean value of the triplicate measurements. B PA6 depolymerization reactions with varying enzyme loadings of NylCK-TS (60 °C), Tt-NylC (60 °C), or NylB’-SCY (50 °C). Reactions contained 13 mg PA6 substrate (0.65 wt% substrate loading) and were monitored for 10 days. Reactions were carried out in duplicate (n = 2), and the replicate measurements are represented as gray circles. For all data in panels A and B, the reaction buffer consisted of 100 mM NaPi buffer, pH 7.5, 150 mM NaCl. Source data are provided in the Source Data file.
Fig. 7
Fig. 7. Exploration of PA6 depolymerization plateau using NylCK-TS as a test case.
A Total released linear 6-AHA oligomers following PA6 film depolymerization reactions (13 mg PA6, 0.65 wt% substrate loading), using either 0.01 µM or 1 µM NylCK-TS enzyme alone (0.8 µM enzyme/g PA6 or 0.08 mM enzyme/g PA6, respectively) compared to a reaction containing 0.01 µM NylCK-TS supplemented with 0.5 µM bovine serum albumin (BSA) over the course of 10 days. B Total released linear 6-AHA oligomers in reactions with 1 µM NylCK-TS and 13 mg PA6 (0.08 mM enzyme/g PA6, 0.65 wt% substrate loading), where the reaction was either allowed to progress for 13 days with no interruption (Normal reaction), where fresh enzyme was added to the reaction after three days (1 µM NylCK-TS, + Fresh enzyme), or where fresh substrate was added to the reaction after 3 days (13 mg PA6, + Fresh substrate), and the reactions monitored for a further 10 days. For (A) and (B), circle, square, and triangle points represent the mean value of the replicate measurements, error bars represent the standard deviation of the replicate measurements, and the error bar centers are the means of the replicate measurements. C PA6 depolymerization reactions with 1 µM NylCK-TS and 13 mg PA6 (0.08 mM enzyme/g PA6, 0.65 wt% substrate loading), with either low crystallinity Goodfellow film (13.2% crystallinity by DSC), or high crystallinity PA6 film (23.0% crystallinity by DSC). Replicate measurements are represented as gray circles. For (A)–(C), reactions were carried out in triplicate (n = 3), error bars represent the standard deviation of the replicate measurements, and the error bar centers are the means of the replicate measurements. D SEM images of PA6 films (13 mg) incubated either without enzyme (no enzyme) or with 1 µM NylCK-TS (0.08 mM enzyme/g PA6, 0.65 wt% substrate loading). Additional images are shown in Supplementary Fig. 27. Scale bar, 100 μm. For (A)–(D), all reactions were carried out in reaction buffer: 100 mM sodium phosphate buffer (NaPi), pH 7.5, 150 mM NaCl at 60 °C. Source data are provided in the Source Data file.

References

    1. British Plastics Federation. Nylons (polyamide). Plastipedia (2023).
    1. Nicholson SR, Rorrer NA, Carpenter AC, Beckham GT. Manufacturing energy and greenhouse gas emissions associated with plastics consumption. Joule. 2021;5:673–686. doi: 10.1016/j.joule.2020.12.027. - DOI
    1. Hirschberg V, Rodrigue D. Recycling of polyamides: processes and conditions. J. Polym. Sci. 2023;61:1937–1958. doi: 10.1002/pol.20230154. - DOI
    1. Sheldon RA, Norton M. Green chemistry and the plastic pollution challenge: towards a circular economy. Green. Chem. 2020;22:6310–6322. doi: 10.1039/D0GC02630A. - DOI
    1. Ellis LD, et al. Chemical and biological catalysis for plastics recycling and upcycling. Nat. Catal. 2021;4:539–556. doi: 10.1038/s41929-021-00648-4. - DOI