. 2024 Feb 9;15(1):1229.
doi: 10.1038/s41467-024-45201-6.

T-bet+ B cells are activated by and control endogenous retroviruses through TLR-dependent mechanisms

Affiliations

T-bet+ B cells are activated by and control endogenous retroviruses through TLR-dependent mechanisms

Eileen Rauch et al. Nat Commun. .

Abstract

Endogenous retroviruses (ERVs) are an integral part of the mammalian genome. The role of immune control of ERVs in general is poorly defined as is their function as anti-cancer immune targets or drivers of autoimmune disease. Here, we generate mouse-strains where Moloney-Murine Leukemia Virus tagged with GFP (ERV-GFP) infected the mouse germline. This enables us to analyze the role of genetic, epigenetic and cell intrinsic restriction factors in ERV activation and control. We identify an autoreactive B cell response against the neo-self/ERV antigen GFP as a key mechanism of ERV control. Hallmarks of this response are spontaneous ERV-GFP+ germinal center formation, elevated serum IFN-γ levels and a dependency on Age-associated B cells (ABCs) a subclass of T-bet+ memory B cells. Impairment of IgM B cell receptor-signal in nucleic-acid sensing TLR-deficient mice contributes to defective ERV control. Although ERVs are a part of the genome they break immune tolerance, induce immune surveillance against ERV-derived self-antigens and shape the host immune response.


Conflict of interest statement

The authors declare no competing interests.

Figures

Fig. 1
Fig. 1. Generation and expression of ERV-GFP in the mouse strain EGT-315.
a Schematic genome and virus structure of ERV-GFP Mo-MuLV. Magnification: env-GFP fusion protein (green). b Detection of ERV-GFP by PCR in genomic DNA of embryonic stem (ES) cells and mouse embryonic fibroblasts (MEFs). c Expression of ERV-GFP RNA transcripts analyzed by Q-PCR in MEFs and ES cells. Single aliquots of uninfected (wt) and ERV-GFP infected ES cells and MEFs were tested. Duplicate measurements ES V6.5 ERV-GFP mean = 0.039 (technical replication), SD = 0,004 and MEF ERV-GFP, mean = 1.1, SD = 0.18 (technical replication). Statistics of technical replication with ordinary one-way ANOVA, ***p = 0.0003. d ERV-GFP protein detection by flow cytometry. Anti-CD90.2 staining was used to differentiate ES cells from MEF feeder cells in co-culture. e Microphotograph of ERV-GFP infected ES-cell colony and MEFs. ERV-GFP (green; feeder cells) and nuclear counterstaining with DAPI (gray; all cells). f Flow cytometry for ERV-GFP expression in blood from 3-week old founder mouse EGT-315 backcrossed to C57BL/6 background and negative controls (C57BL/6 and EGT-314 non-transgenic founder, upper row). Example of in vitro infection assay of WEHI-231 cells by plasma of EGT-315 Tlr7−/− mice (genotype: Tlr3+/-Tlr7−/−Tlr9+/-) (5 positive of n = 6) and EGT-315 wild type Tlr7−/− littermates (n = 3) and C57BL/6 (n = 3) (lower row). g Representative flow cytometry of neonatal ERV-GFP activation in spleen, on day 1 and day 6 and 7 in EGT-315 C57BL/6 (n = 0/2 on day 1 and 3/3 on day 6) and EGT-315-Tlr7−/− mice (genotype: Tlr3+/- Tlr7−/− Tlr9+/-) (n = 0/2 and 4/6 on day 7). h Flow cytometry of cell type-specific expression of ERV-GFP in cells of spleen and bone marrow of F1-4 EGT-315 B6 mice (black bars, n = 5) as well as EGT-315-Tlr3−/−Tlr7−/−Tlr9−/− mice (white bars, n = 5). Green indicates the percentage of ERV-GFP+ cells relative to 100% of the cell type. EGT-315 B6 Spleen: B cells (mean = 7.6, SD = 4.3), T cells (mean = 9.2, SD = 7.5), Granulocytes (mean = 27, SD = 14.1), DCs (mean = 9, SD = 4.2). EGT-315 B6 bone marrow: B cells (mean = 3.2, SD = 2.4), T cells (mean = 8.9, SD = 9.3), Granulocytes (mean = 2.8, SD = 2.5), DCs (mean = 2.8, SD = 0.042). EGT-315 Tlr3−/−Tlr7−/−Tlr9−/− spleen: B cells (mean = 17.7, SD = 5.7), T cells (mean = 15, SD = 6.3), Granulocytes (mean = 54, SD = 21.2), DCs (mean = 34, SD = 16.8). EGT-315 Tlr3−/−Tlr7−/−Tlr9−/− bone marrow: B cells (mean = 28.5, SD = 13.6), T cells (mean = 25, SD = 0.31), Granulocytes (mean= 34.6, SD = 4.7), DCs (mean = 26.6, SD = 11.3). i Confocal microphotograph from small intestine of 2.5-month old mice F1-4; helper T cells (CD4), B cells (B220) and nuclei (DAPI). GFP signal indicates ERV-GFP expression. Intestines of 2.5-month old mice representative for C57BL/6 mice (n = 4), EGT-315 B6 mice (n = 4), and EGT-315 Tlr3−/−Tlr7−/−Tlr9−/− mice (n = 6). Scale bar 20 µm. Right pannel, summary of ERV-GFP positive crypts (green) compared to negative crypts (black) from generations F1-4 EGT-315 B6 mice (n = 4), and EGT-315 Tlr3−/−Tlr7−/−Tlr9−/− mice (n = 5). EGT-315 B6 31,7% (83 GFP+ crypts of 262) and EGT-315 Tlr3−/−Tlr7−/−Tlr9−/− mice 54,3% (139 GFP+ crypts of 256). Source data are provided as a Source Data file.
Fig. 2
Fig. 2. ERV-GFP expression in vivo is influenced by modifier genes from the 129/Sv genetic background but not by epigenetic DNA methylation and suppressed by human cell intrinsic restriction factor Apobec3G (hA3).
a Reintroduction of 129/Sv genes by backcross of EGT-315 B6 (F9-F11) (mean = 0.79, SD = 2.23, n = 40) with 129/Sv increases ERV-GFP expression in EGT-315 B6 x 129/Sv (F1) mice (mean = 8.91, SD = 14.0, n = 32). C57BL/6 (mean = 0, SD = 0, n = 9) and (129/Sv x C57BL/6) F1 wt littermates (mean = 0.063, SD = 0.122, n = 9). Red bars show mean. Flowcytometry of blood leukocytes at 3 weeks of age. ***p = 0.0008. Ordinary one-way ANOVA Tukey´s multiple comparsion test. b Epigenetic DNA methylation status of a 549 bp DNA fragment of ERV-GFP in GFP positive (+) vs GFP negative (-) cells isolated from spleen cells of EGT-315 mice. DNA was digested with methylation sensitive HpaII (recognition site CCGG) and normalized with Plcg2 specific PCR w/o HpaII recognition site. ES-cells are ERV-GFP containing but GFP-expression negative and ERV-GFP infected WEHI-231 cells strongly express GFP. From individual mice sorted GFP+ cells (mean = 4.91, SD = 4.32, n = 9), sorted GFP- cells (mean = 3.3, SD = 1.9, n = 15), WEHI-231 GFP+ (mean = 0.37, SD = 0.12, n = 4), ES cells GFP- (mean = 26.9, SD = 8.3, n = 4). Sorted GFP+ cells vs Sorted GFP- cells nsP = 0.752. Sorted GFP+ cells vs ES cells GFP- ****P < 0.0001. Sorted GFP- cells vs ES cells GFP- ****P < 0.0001. WEHI-231 GFP+ vs ES cells GFP-****P < 0.0001. Ordinary one-way ANOVA Tukey´s multiple comparsion test. Summary of 3 experiments. c Q-PCR of RNA expression of the GFP and Env region (549 bp) of ERV-GFP transcribed in spleen of EGT-315 mice (left panel). Sequence analysis of RNA expression analysis by RT-PCR-transcripts of EGT-315 mice with and without human Apobec3 (hA3Tg). Each dot depicts the mean number of mutations of 4–8 clones sequenced per individual mouse of the different genotypes (right panel). EGT-315 B6 (green bar, mean = 1, SD = 1.9, n = 4), EGT-315 Tlr3−/−Tlr7−/−Tlr9−/− (blue bar, mean = 0.06, SD = 0.09, n = 5), EGT-315 Tlr3−/−Tlr7−/−Tlr9−/− hA3 (purple bar, mean = 7.3, SD = 6.0, n = 5). Statistics of mutations EGT-315 Tlr3−/−Tlr7−/−Tlr9−/− versus EGT-315 Tlr3−/−Tlr7−/−Tlr9−/− hA3 *p = 0.028 by Ordinary one-way ANOVA Tukey´s multiple comparsion test. Source data are provided as a Source Data file.
Fig. 3
Fig. 3. Properties of the env-GFP membrane autoantigen that lead to TLR-dependent anti-GFP IgG response.
a Comparison of anti-GFP IgG antibody response measured by GFP-specific ELISA for EGT-315 B6 (green dots, n = 9) vs different GFP reporter mice, Nkx6.1 Venus (n = 9), CAT-GFP (n = 7), Foxo-1-GFP (n = 6), mb1-GFP (n = 6), Blimp1-GFP (n = 6), IL4/GFP (n = 8) and EGT-315 Tlr3-/-Tlr7-/-Tlr9-/--hA3 transgenic mice (n = 3). b Stratification of ERV-GFP expression and anti-GFP IgG production. Upper panel: flow cytometry of ERV-GFP expression as % positive peripheral blood cells per mouse. EGT-315 B6 mice (green, total n = 30) were subdivided into three groups: high percentage of ERV-GFP positive cells (green dots, n = 5), low (green squares, n = 11) and negative (green triangles, n = 14). EGT-315 Tlr7-/- (genotype: Tlr3+/-Tlr7−/−Tlr9+/-) (blue triangles, n = 6) and C57BL/6 (black rhombuses, n = 6). Lower panel: corresponding anti-GFP IgG titers measured by GFP-specific ELISA. Statistics by two-tailed unpaired t-test with Welch´s correction, upper pannel GFP: EGT-315 B6 ERV-GFPhigh vs ERV-GFPlow ***P < 0,0001; EGT-315 B6 ERV-GFPhigh vs. ERV-GFPnegative ****P < 0,0001. lower pannel anti-GFP IgG: EGT-315 B6 ERV-GFPhigh vs ERV-GFPlow **P = 0,0013; EGT-315 B6 ERV-GFPhigh vs ERV-GFPnegative ***P = 0,0004. c Western blot of antibody production of EGT-315 mice against GFP protein blotted on stripes. Stripes were incubated with plasma from 2 to 4-month old mice. Visualization was done by anti-IgG-HRP detection. Representative for EGT-315 Tlr7−/− mice (genotype: Tlr3+/-Tlr7−/−Tlr9+/-) (n = 4) EGT-315 Tlr7+/- mouse (n = 1), EGT-315 C57BL/6 mice (n = 10 positive from 11), EGT-315 Tlr3−/−Tlr7−/−Tlr9−/− (n = 4) and C57BL/6 mice (n = 5). d Env-GFP is expressed on the surface of cells. Flow cytometry of inhibitory anti-GFP mAb binding to ERV-GFP expressing cells. Biotinylated anti-GFP monoclonal Ab clone 174 was used to stain NIH-3T3 ERV-GFP. Anti-GFP mAb174 and Streptavidin-Alexa Fluor 633 (blue), only Streptavidin Alexa Fluor 633 (red) (n = 3). e Schematic genome structure of the recombinant Mo-MuLV used to generate EGT-315 (pMOV-GFP) and the EZGT-332/3 (pZAPM-GFP) mouse strains. f Comparison of anti-GFP IgG response of individual mice. Genotype: C57BL/6 (mean = 1.2, SD = 1.3, n = 18), Tlr3−/−Tlr7−/−Tlr9−/− (mean = 0.5, SD = 0.5, n = 19), EGT-315 B6 (mean = 452.4, SD = 672.9, n = 37), EGT-315 Tlr3−/−Tlr7−/−Tlr9−/− (mean = 0.48, SD = 0.48, n = 27), EZGT B6 (mean = 19, SD = 58.6, n = 29), EZGT Tlr3−/−Tlr7−/−Tlr9−/− (mean = 0.68, SD = 0.58, n = 16); EGT-315 B6 vs EGT-315 Tlr3−/−Tlr7−/−Tlr9−/− ****P < 0.0001; EGT-315 B6 vs EZGT B6 ****P < 0.0001. Ordinary one-way ANOVA Tukey´s multiple comparsion test. Summary of 3 experiments. Source data are provided as a Source Data file.
Fig. 4
Fig. 4. The GFP-specific IgG response engages spontaneous germinal centers containing ERV-GFP immune complexes.
a GFP virus containing immune complexes on FDC network in B cell follicles and germinal centers of EGT-315 mice examined by confocal microphotography. Representative of spleens from EGT-315 B6 (n = 6) and EGT-315 Tlr3-/-Tlr7-/-Tlr9-/- (n = 4) mice (scale bar 20 µm). Two left panels, ERV-GFP (green) and DAPI (blue). Right panels, spontaneous GCs stained with PNA-Alexa Fluor 647 (Peanut Agglutinin, red). Nuclei were stained with DAPI (blue). ERV-GFP (green). White triangels point to weak ERV-GFP signal in follicles. b ERV-GFP deposition in B cell follicles of EGT-315 B6 mice. Left, confocal microphotography representative of spleens stained with PNA-Alexa Fluor 647 (Peanut Agglutinin, red) and CD19-PE (blue). ERV-GFP is shown in green. Middle, microphotography of ERV-GFP deposition in standard immunflourescence (IF) in green. Right, quantification of ERV-GFP (green) vs ERV-GFP negative (black) B cell follicles of individual mice: EGT-315 B6 young (positive 7.5%; 15 + /186-; n = 5; mean age = 1m19d), EGT-315 B6 old (2%; 6 + /297-; n = 12; mean age = 5 m 24d), EGT-315 Tlr3−/−Tlr7−/−Tlr9−/− (positive 0%; 0 + /348-; n = 10; mean age = 4m5d) and C57BL/6 and Tlr3−/−Tlr7−/−Tlr9−/− (positive 0%; 0 + /151-; n = 4; mean age = 8m14d). c Identification of IgD-GL7+ GC B cells in spleen. Left panel, exemplary flow cytometry of anti-IgD vs GL7 staining (Blue gate, IgD-GL7+). Right  panel, statistical analysis of GL7+ B cells of C57BL/6 (mean = 111, SD = 117, n = 14) Tlr3−/−Tlr7−/−Tlr9−/− (mean = 59, SD = 33, n = 12), EGT-315 B6 (mean = 363, SD = 232, n = 16), EGT-315 Tlr3−/−Tlr7−/−Tlr9−/− (mean = 62, SD = 52, n = 15). C57BL/6 vs. EGT-315 B6 ****P < 0.0001; EGT-315 B6 vs. EGT-315 Tlr3−/−Tlr7−/−Tlr9−/− ****P < 0.0001. Ordinary one-way ANOVA Tukey’s multiple comparisons test. Summary of 8 experiments. d Q-PCR mRNA expression analysis of purified splenic B cells from individual mice. Values are x-fold expression relative to houskeeping gene actin. ERV-GFP (pMOV-GFP, left) C57BL/6 (black bar, mean = 0, SD = 0, n = 3), Tlr3−/−Tlr7−/−Tlr9−/− (red bar, mean = 0, SD = 0, n = 2), EGT-315 B6 (green bar, mean = 1.7, SD = 2.3, n = 7), EGT-315 Tlr3−/−Tlr7−/−Tlr9−/− (blue bar, mean = 122.7, SD = 84.6, n = 3), Summary of 7 experiments; **P = 0.0096; AID (middle) C57BL/6 (black bar, mean = 0.41, SD = 0.17, n = 3), Tlr3−/−Tlr7−/−Tlr9−/− (red bar, mean = 0.13, SD = 0.1, n = 3), EGT-315 B6 (green bar, mean= 1.36, SD = 0.96, n = 15), EGT-315 Tlr3−/−Tlr7−/−Tlr9−/− (blue bar, mean = 0.09, SD = 0.04, n = 8), Summary of 8 experiments; **P = 0.0019. T-bet (right) C57BL/6 (black bar, mean = 0.41, SD = 0.06, n = 3), Tlr3−/−Tlr7−/−Tlr9−/− (red bar, mean = 0.48, SD = 0.34, n = 3), EGT-315 B6 (green bar, mean = 0.84, SD = 0.34, n = 15), EGT-315 Tlr3−/−Tlr7−/−Tlr9−/− (blue bar, mean = 0.46, SD = 0.25, n = 10), Summary of 8 experiments, **P = 0.0074; For all Q-PCR statistics we used two-tailed unpaired t-tests. Source data are provided as a Source Data file.
Fig. 5
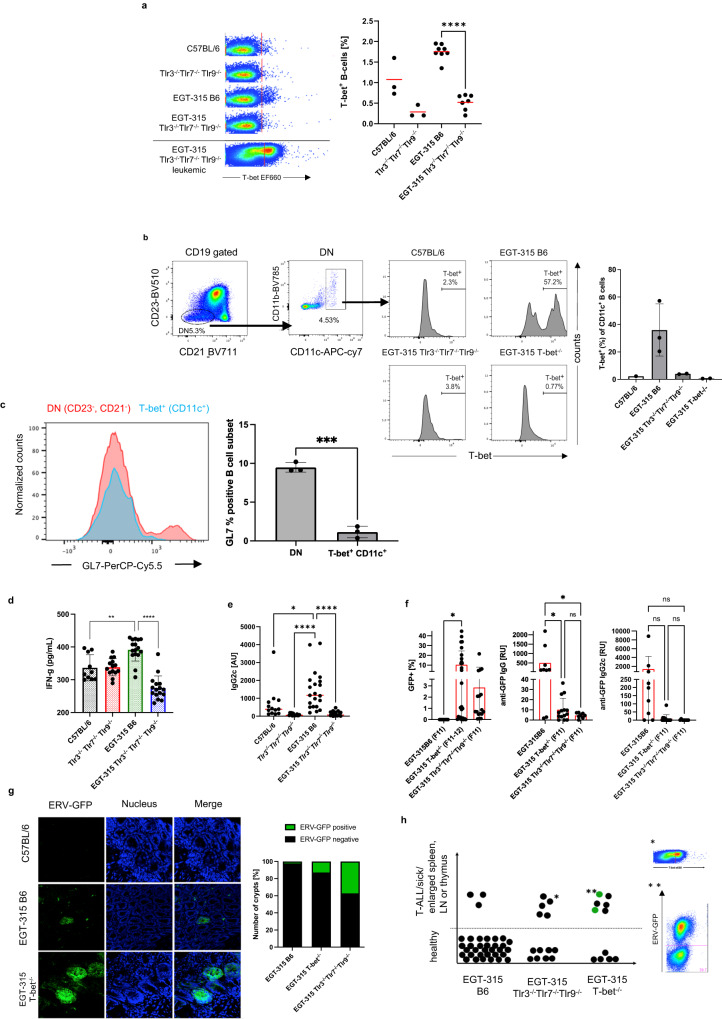
Fig. 5. ERV-GFP recognition results in upregulation of IFN-γ, IgG2c, increases T-bet+ ABCs and is dependent on T-bet.
a T-bet positive B cells identified by intracellular flow cytometry. Left, examples of dot plot analysis of the four genotypes, red line demarcates T-bet negative vs positive cells. Lower example, cells of a leukemic EGT-315 Tlr3−/−Tlr7−/−Tlr9−/− mouse. Right, summary of % T-bet+ cells of individual mice: C57BL/6 (mean = 1.07, SD = 0.463, n = 3), Tlr3−/−Tlr7−/−Tlr9−/− (mean = 0.29, SD = 0.15, n = 3), EGT-315 B6 (mean = 1.75, SD = 0.189, n = 8), EGT-315 Tlr3−/−Tlr7−/−Tlr9−/− (mean = 0.52, SD = 0.19, n = 7). EGT-315 B6 vs. EGT-315 Tlr3−/−Tlr7−/−Tlr9−/− ****P < 0.0001. Ordinary one way ANOVA multiple comparisons test. Summary of 5 experiments. b ABCs in EGT-315 B6 mice. Gating strategy of CD19+ splenic B cells from C57BL/6 (2.3, n = 1), EGT-315 B6 (mean = 35.97, SD = 19.1, n = 3), EGT-315 TLR3−/−TLR7−/−TLR9−/− (mean = 4.0, SD = 0.33, n = 2) and EGT-315 T-bet−/− mice (mean = 0.67, SD = 0.15, n = 2). DN defines CD23- CD21- B cells. Box in DN panel defines both CD11c+ CD11b+ and CD11c+ CD11b- B cells analyzed for T-bet expression. Right panel, summary of mice tested for % T-bet positive CD11c+ cells. c Overlay of histogram for GL7 of DN (red) and T-bet+ CD11c+ ABC population (blue) of EGT-315 B6 mice (n = 3). GL7 positive B cells are present in the DN B cell population but not in the ABC population in spleen of individual EGT-315 B6 mice. DN (mean = 9.48 SD = 0.627, n = 3), T-bet+ CD11c+ ABC (mean = 1.14 SD = 0.752, n = 3), ***P = 0.0002. Unpaired Two-tailed t-test with Welch´s correction. d Serum IFN-γ levels in pg/ml measured by cytometric bead array for mouse inflammatory cytokines in individual sera of C57BL/6 (black bar, mean = 337, SD = 40, n = 10), Tlr3−/−Tlr7−/−Tlr9−/− (red bar, mean = 338, SD = 26, n = 14), EGT-315 B6 (green bar, mean = 392, SD = 34, n = 16), EGT-315 Tlr3−/−Tlr7−/−Tlr9−/− (blue bar, mean = 275, SD = 37, n = 16). For statistics a Two-tailed Mann–Whitney U-test was applied. EGT-315 B6 vs. C57BL/6 **P = 0.0029, EGT-315 B6 vs. EGT-315 Tlr3−/−Tlr7−/−Tlr9−/− ****P < 0.0001. Experiment is a summary of two experiments. e Serum IgG2c levels measured by IgG2c-specific ELISA in aribitrary units (AU) in C57BL/6 (mean = 683, SD = 918, n = 13), Tlr3−/−Tlr7−/−Tlr9−/− (mean = 83, SD = 62, n = 14), EGT-315 B6 (mean = 1442, SD = 1088, n = 21). EGT-315 Tlr3−/−Tlr7−/−Tlr9−/− (mean = 121, SD = 120, n = 23) mice. C57BL/6 vs EGT-315 B6 *P = 0.0186; Tlr3−/−Tlr7−/−Tlr9−/− vs EGT-315 B6 ****P < 0.0001; EGT-315 B6 vs EGT-315 Tlr3−/−Tlr7−/−Tlr9−/− ****P < 0.0001. Ordinary one-way ANOVA Tukey´s multiple comparisons test. Summary of 3 experiments. f ERV-GFP expression and anti-GFP antibody response in EGT-315 T-bet−/− mice. Flow cytometry of generation matched (F11-F12) EGT-315 B6 mice (mean = 0, SD = 0, n = 9) EGT-315 T-bet−/− (mean = 10.5, SD = 14.1, n = 26) and EGT-315 Tlr3−/−Tlr7−/−Tlr9−/− mice (mean = 2.9, SD = 5.2, n = 17). % GFP positive cells in PBMC of 3-week old mice (left panel). EGT-315 B6 vs EGT-315 T-bet−/− *P = 0.0327. 10 out of 26 mice (38.5%) of the EGT-315 T-bet−/− mice display very high ERV-GFP expression (>10%). Red bars are mean values. Statistics with Ordinary one-way ANOVA Tukey´s multiple comparisons test. Summary of 3 experiments. Anti-GFP IgG (middle) EGT-315 B6 mice (mean = 504, SD = 773, n = 9) EGT-315 T-bet−/− (mean = 10.2, SD = 11.3, n = 14) and EGT-315 Tlr3−/−Tlr7−/−Tlr9−/− mice (mean = 4.5, SD = 2.5, n = 8). EGT-315 B6 vs EGT-315 T-bet−/− *P = 0.0242; EGT-315 B6 vs EGT-315 Tlr3−/−Tlr7−/−Tlr9−/− *P = 0.0485; EGT-315 T-bet−/− vs EGT-315 Tlr3−/−Tlr7−/−Tlr9-/- nsP = 0.9995; Statistics with Tukey´s multiple comparisons test. Anti-GFP IgG2c (right panel) response of 2–3 month old mice measured by ELISA. EGT-315 B6 mice (mean = 1374, SD = 2873, n = 9) EGT-315 T-bet−/− (mean = 9.3, SD = 24.3, n = 14) and EGT-315 Tlr3−/−Tlr7−/−Tlr9−/− mice (mean = 1, SD = 3, n = 8). All nsP-values > 0.1. Summary of 2 experiments. g Confocal microphotograph from small intestine. GFP signal indicates ERV-GFP expression. Intestines of 2.5-month old mice representative for C57BL/6, EGT-315 B6 and EGT-315 T-bet−/− mice. Right, summary of ERV-GFP positive crypts (green) compared to negative crypts (black) EGT-315 B6 mice (2.2% GFP+, total crypts analyzed 792 of n = 21), EGT-315 T-bet−/− (12.8% GFP+, total crypts analyzed 601 of n = 9) and EGT-315 Tlr3−/−Tlr7−/−Tlr9−/− mice (37.2% GFP+, total crypts analyzed 487 of n = 16). Summary of 4 experiments. h EGT-315 T-bet−/− mice succumb to T-ALL. Summary of mice analysed: EGT-315 B6 (3/34, 8.8%). EGT-315 Tlr3−/−Tlr7−/−Tlr9−/− (5/13, 38%). EGT-315 T-bet−/− (6/11, 55%). The mice examined were 7 month or older. Each dot represents a single mouse. *T-ALL cells from an EGT-315 Tlr3−/−Tlr7−/−Tlr9−/− mouse show increased T-bet expression. **Two out of six lymphomas of EGT-315 T-bet−/− mice were ERV-GFP positive (green dots). Source data are provided as a Source Data file.
Fig. 6
Fig. 6. ERV-GFP enhances natural ERV (MuLV of C57BL/6) expression, anti-MuLV antibody production, anti-DNA IgG production and immune complex deposition in kidneys.
a MuLV specific mRNA expression analyzed by Q-PCR of purified splenic B cells from individual mice. Actin was used to normalize expression. ERV (MuLV): C57BL/6 (black bar, mean = 0.04, SD = 0.03, n = 4), Tlr3−/−Tlr7−/−Tlr9−/− (red bar, mean = 1216, SD = 800, n = 4), EGT-315 B6 (green bar, mean = 0.89, SD = 0.23, n = 9), EGT-315 Tlr3−/−Tlr7−/−Tlr9−/− (blue bar, mean = 7202, SD = 6050, n = 6), Summary of 6 experiments; **P = 0.0055 by unpaired Two-tailed t test. b Anti-MuLV IgG production is increased in EGT-315 B6 mice. MuLV-specific ELISA of plasma from C57BL/6 (mean = 252.7, SD = 315.4, n = 19), Tlr3−/−Tlr7−/−Tlr9−/− (mean = 11.9, SD = 7.3, n = 8), EGT-315 B6 (mean = 2711, SD = 1936, n = 16 including 5 pools purple dots), EGT-315 Tlr3−/−Tlr7−/−Tlr9−/− (mean = 9.1, SD = 6.7, n = 15 including 5 pools), red lines depict mean value. Summary of 3 experiments; C57BL/6 vs EGT-315 B6 ****P < 0.0001. Statistics with Ordinary one-way ANOVA Tukey´s multiple comparisons test. c Anti-DNA IgG production is increased in EGT-315 B6 mice. DNA (ss and ds) specific ELISA of plasma from C57BL/6 (black bar, mean = 2.1, SD = 0.86, n = 6), Tlr3−/−Tlr7−/−Tlr9−/− (red bar, mean = 0.67, SD = 0.24, n = 6), EGT-315 B6 (green bar, mean = 5.1, SD = 2.9, n = 6), EGT-315 Tlr3−/−Tlr7−/−Tlr9−/− (blue bar, mean = 0.9, SD = 0.37, n = 6). **P = 0.0055. Statistics with Ordinary one-way ANOVA Tukey´s multiple comparisons test. d Confocal microphotography of immune complex deposition containing IgG and ERV-GFP in kidney glomeruli representative of EGT-315 B6 (n = 7) but not in C57BL/6 (n = 4) and EGT-315 Tlr3−/−Tlr7−/−Tlr9−/− mice (n = 2). Anti-IgG Alexa Fluor 633, DAPI (nucleus) and ERV-GFP are shown. Scale bar 20 µm. Source data are provided as a Source Data file.
Fig. 7
Fig. 7. Presence of ERV-GFP and absence of nucleic-acid Tlr-sensing results in systemic IgE overproduction.
a Serum IgE levels measured by IgE-specific ELISA from individual mice: C57BL/6 (mean = 0.43, SD = 0.79, n = 7), Tlr3−/−Tlr7−/−Tlr9−/−(mean = 0.11, SD = 0.33, n = 9), EGT-315 B6 (mean = 0.06, SD = 0.24, n = 18) EGT-315 Tlr3−/−Tlr7−/−Tlr9−/− (mean = 5.5, SD = 8.0, n = 17). Red lines depict mean value. Tlr3−/−Tlr7−/−Tlr9−/− vs EGT-315 Tlr3−/−Tlr7−/−Tlr9−/− *P = 0.035. EGT-315 B6 vs EGT-315 Tlr3−/−Tlr7−/−Tlr9−/− **P = 0.0061. Ordinary one-way ANOVA Tukey´s multiple comparisons test. Summary of 3 experiments. b Basophil-bound IgE levels measured by flow cytometry of spleen cells from individual mice: C57BL/6 (mean = 373, SD = 252; n = 14), Tlr3−/−Tlr7−/−Tlr9−/−(mean = 196, SD = 131, n = 11), EGT-315 B6 (mean = 128, SD = 73, n = 15), EGT-315 Tlr3−/−Tlr7−/−Tlr9−/− (mean = 939, SD = 190, n = 16). Left exemplary flow cytometry panel, and right panel statistical evaluation of MFI of the IgE+CD23- basophil population (red circle). C57BL/6 vs EGT-315 Tlr3−/−Tlr7−/−Tlr9−/− ****P < 0.0001. EGT-315 B6 vs EGT-315 Tlr3−/−Tlr7−/−Tlr9−/− ****P < 0.0001. Statistics with Ordinary one-way ANOVA Tukey´s multiple comparisons test. Summary of 12 experiments. Source data are provided as a Source Data file.
Fig. 8
Fig. 8. Combined deficiency of Tlr3 Tlr7 Tlr9 in B cells impairs IgM-BCR induced B cell survival/proliferation but upregulates CD23 expression induced by Tlr4 in vitro.
a Flow cytometry plots of IgM vs IgD staining of splenic B cells representative of C57BL/6 (n = 7), Tlr3−/−Tlr7−/−Tlr9−/− (n = 7), EGT-315 B6 (n = 6), EGT-315 Tlr3−/−Tlr7−/−Tlr9−/− (n = 6). Squares: mature B cells (left), transitional B cells (right upper), immature B cells (right lower). Summary of 9 experiments. b Follicular (gate upper middle) and marginal zone (gate lower right) B cell distribution in Tlr deficient mice. Exemplary flowcytometry of spleen cells from C57BL/6 (n = 3), Tlr3−/−Tlr7−/−Tlr9−/− (n = 2), EGT-315 B6 (n = 6), EGT-315 Tlr3−/−Tlr7−/−Tlr9−/− (n = 5) using the B cell markers CD23 and CD21. Summary of 3 experiments. c GFP-specific IgM measured by GFP specific ELISA from individual mice: C57BL/6 (mean = 1160, SD = 476, n = 4), Tlr3−/−Tlr7−/−Tlr9−/− (mean = 392, SD = 229, n = 6), EGT-315 B6 (mean = 3249, SD = 2037, n = 29), EGT-315 Tlr3−/−Tlr7−/−Tlr9−/− (mean = 312, SD = 171, n = 8). Red lines depict mean value. EGT-315 B6 vs. EGT-315 Tlr3−/−Tlr7−/−Tlr9−/− ***P = 0.0004. Ordinary one-way ANOVA Tukey’s multiple comparisons test. d Survival/proliferation of purified B cells isolated from individual mice 72 h after in vitro stimulation (no stimulus, LPS = Tlr4 ligand, anti-IgM = BCR ligand, R848 = Tlr7 ligand, 1668 PTO = Tlr9 ligand) measured by flow cytometry using propidium iodide to distinguish live vs dead cells. C57BL/6 (black bar, for anti-IgM: mean = 15.1, SD = 5.9, n = 9), Tlr3−/−Tlr7−/−Tlr9−/− (red bar, for anti-IgM: mean = 3.2, SD = 2.0, n = 9), EGT-315 B6 (green bar, for anti-IgM: mean = 18.6, SD = 6.3, n = 8), EGT-315 Tlr3−/−Tlr7−/−Tlr9−/− (blue bar, for anti-IgM: mean = 4.0, SD = 3.0, n = 7). Summary of 12 experiments, 2 way ANOVA, Sidak´s multiple comparisons test ****P < 0.0001. e Role of Btk in survival/proliferation of purified B cells 72 h after in vitro stimulation. Anti-IgM was used with and without the addition of the Btk-inhibitor Ibrutinib. Cells from individual mice were tested. C57BL/6 and EGT-315 B6 combined (green bar, for anti-IgM: mean = 11.9, SD = 4.3, n = 6), Tlr3−/−Tlr7−/−Tlr9−/− and EGT-315 Tlr3−/−Tlr7−/−Tlr9−/− B6 combined (blue bar, for anti-IgM: mean = 1.7, SD = 1.1, n = 6). Summary of 5 experiments, 2-way ANOVA, Sidak´s multiple comparisons test, ****P < 0.0001. f Tlr3−/−Tlr7−/−Tlr9−/− B cells induced by LPS (Tlr4-ligand) upregulate CD23. Upper panels, LPS-mediated in vitro induction of CD23 is higher in Tlr3−/−Tlr7−/−Tlr9−/− B cells compared to wild type B cells. Flowcytometry examples of stimulated B cells from C57BL/6 and Tlr3−/−Tlr7−/−Tlr9−/− mice for 72 h with medium alone (red), LPS (10 μg/ml, blue) and LPS + IL-4 (LPS 10 μg/ml+ IL-4 250 U/ml, green). Right panels, Summary of MFI of CD23 from three independent experiments. Mann-Whitney test Two-tailed pairwise comparison ***P = 0.0007 and **P = 0.0031. B6 (n = 10), Tlr3−/−Tlr7−/−Tlr9−/− (n = 7). Source data are provided as a Source Data file.

References

    1. Bock M, Stoye JP. Endogenous retroviruses and the human germline. Curr. Opin. Genet Dev. 2000;10:651–655. doi: 10.1016/S0959-437X(00)00138-6. - DOI - PubMed
    1. Weiss RA. The discovery of endogenous retroviruses. Retrovirology. 2006;3:67. doi: 10.1186/1742-4690-3-67. - DOI - PMC - PubMed
    1. Schlesinger S, Goff SP. Retroviral transcriptional regulation and embryonic stem cells: war and peace. Mol. Cell Biol. 2015;35:770–777. doi: 10.1128/MCB.01293-14. - DOI - PMC - PubMed
    1. Muller MD, Holst PJ, Nielsen KN. A systematic review of expression and immunogenicity of human endogenous retroviral proteins in cancer and discussion of therapeutic approaches. Int J. Mol. Sci. 2022;23:1330. doi: 10.3390/ijms23031330. - DOI - PMC - PubMed
    1. Brocks D, et al. DNMT and HDAC inhibitors induce cryptic transcription start sites encoded in long terminal repeats. Nat. Genet. 2017;49:1052–1060. doi: 10.1038/ng.3889. - DOI - PMC - PubMed

LinkOut - more resources