. 2024 Feb 9;15(1):1240.
doi: 10.1038/s41467-024-45444-3.

An integrated self-optimizing programmable chemical synthesis and reaction engine

Affiliations

An integrated self-optimizing programmable chemical synthesis and reaction engine

Artem I Leonov et al. Nat Commun. .

Abstract

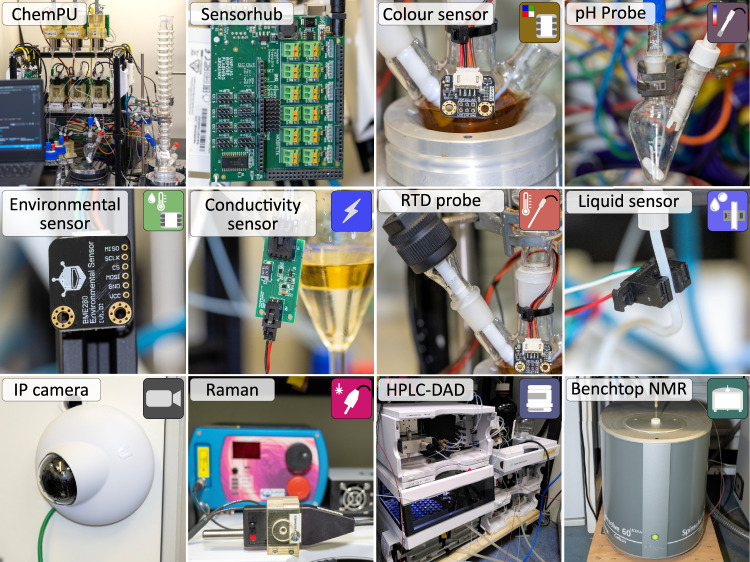
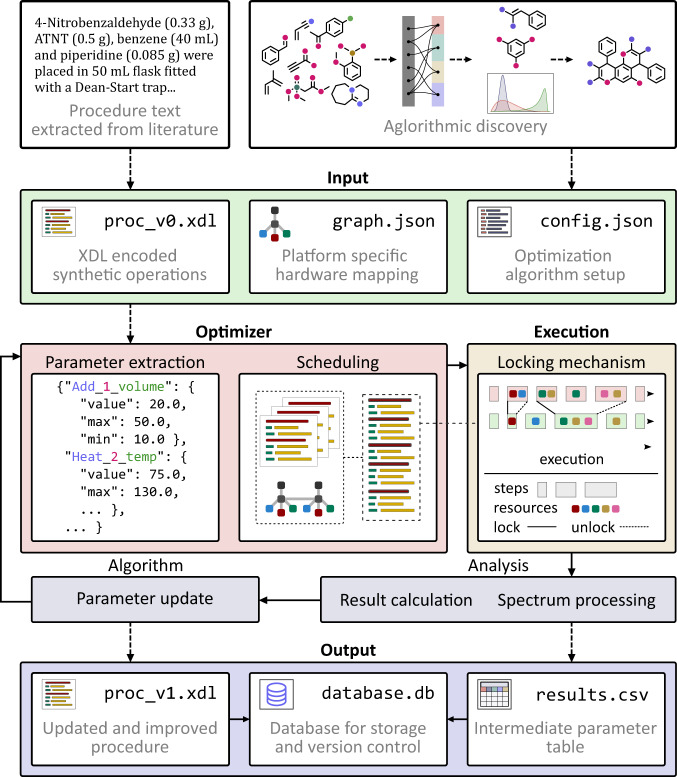
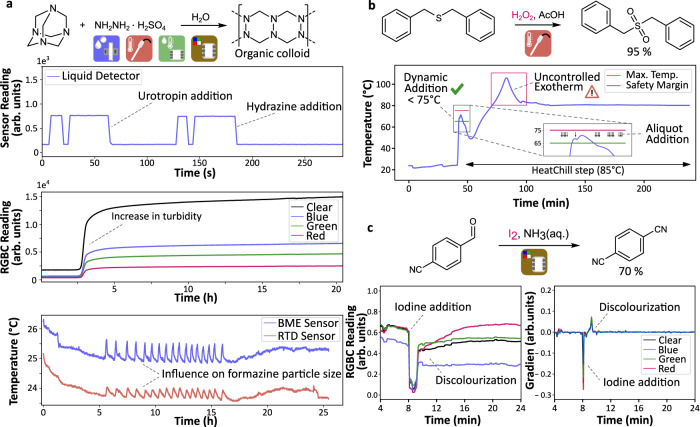
Robotic platforms for chemistry are developing rapidly but most systems are not currently able to adapt to changing circumstances in real-time. We present a dynamically programmable system capable of making, optimizing, and discovering new molecules which utilizes seven sensors that continuously monitor the reaction. By developing a dynamic programming language, we demonstrate the 10-fold scale-up of a highly exothermic oxidation reaction, end point detection, as well as detecting critical hardware failures. We also show how the use of in-line spectroscopy such as HPLC, Raman, and NMR can be used for closed-loop optimization of reactions, exemplified using Van Leusen oxazole synthesis, a four-component Ugi condensation and manganese-catalysed epoxidation reactions, as well as two previously unreported reactions, discovered from a selected chemical space, providing up to 50% yield improvement over 25-50 iterations. Finally, we demonstrate an experimental pipeline to explore a trifluoromethylations reaction space, that discovers new molecules.


Conflict of interest statement

A patent based on this work has been filed by the University of Glasgow, United Kingdom (GB) Patent Application No: 2315721.7. There are no other competing interests.

Figures

Fig. 1
Fig. 1. Overview of the dynamic chemical operations execution.
The procedure, illustrated using χDL syntax, may be executed sequentially one step after another or dynamically, e.g. as highlighted with AddDynamic where a Wait step is inserted if the temperature rises above given threshold. With integrated analysis and corresponding χDL step (Analyze), the procedure could run iterative with dynamic update of its parameters, thus allowing for closed-loop reaction conditions optimization. The Setup step represents the definition of the hardware configuration of the system and the chemical procedure defined digitally in the χDL code. In the Execution step these components are used to operate the physical robotic system to achieve the defined chemical operations, including the collection of analytical data about the execution. In the Optimization step, the data is analysed and algorithms are used to predict parameters for the next round of experiments.
Fig. 2
Fig. 2. The suite of sensors and analytical instruments integrated in the Chemputer stack.
The SensorHub provides a unified interface for a range of low-cost sensors. Sensors were used to monitor colour, pH, ambient conditions (pressure, humidity and temperature), internal temperature (Resistance Temperature Detector (RTD) probe), conductivity and liquid transfers. An Internet Protocol (IP) camera was integrated for video capture and active failure detection. Analytical instruments (Raman, HPLC-Diode Array Detection (DAD), NMR) were integrated for reaction monitoring and optimization.
Fig. 3
Fig. 3. An overview of the framework for chemical discovery and optimization, ChemputationOptimizer, its system architecture and operation.
The initial χDL procedure (proc_v0.xdl) is obtained either via text translation from literature or upon algorithmic reaction discovery. Together with the hardware graph (graph.json) and a configuration file (config.json) are loaded, from which the optimizer framework extracts the parameters to be optimized. If enough resources are available, the optimizer performs the scheduling routine to allocate hardware resources to the corresponding procedure steps for parallel execution, minimizing the total duration. A locking mechanism which ensures error-free execution during runtime and eliminates the risk of unexpected cross-contamination. Upon successful execution, the outcome of the reaction is analysed quantitatively and the results are fed to the optimization algorithm to suggest the next parameter set and update the initial procedure. The updated procedure, together with the results table is saved, using the database. The architecture and implementation details are given in the ESI (Section 1).
Fig. 4
Fig. 4. Reaction monitoring in the automated synthesis execution.
a Passively monitored formazine synthesis, a turbidity reference material, b dynamically executed thioether oxidation and c iodine-mediated nitrile formation with corresponding exemplary data captured within the process. a Example data was captured via passive monitoring during the formazine synthesis: The liquid detector tracked reagent addition, the colour sensor (Red Green Blue Colour (RGBC)) could detect the increase in turbidity as the colloidal suspension formed, and the environmental (from a BME280 combined humidity, pressure and temperature sensor—BME) and internal reaction temperature (RTD) sensors could capture data relevant for reproducibility. b Internal reaction temperature was captured in real time and used to control the addition of the oxidizing agent in the highly exothermic thioether oxidation reaction. The original procedure demanded to keep the internal reaction temperature below 75 °C. After the addition, passive monitoring further revealed an uncontrolled exotherm upon heating the reaction mixture to the temperature (85 °C) specified in the literature procedure. c A colour sensor captured data during the addition of iodine and its subsequent consumption as the reaction proceeds. The gradient was calculated post hoc, clearly showing the iodine addition and consumption as peaks. Source data are provided as a Source data file.
Fig. 5
Fig. 5. Results of the closed-loop reaction optimization.
a Four-component Ugi reaction scheme (top); plot of the parameter space reduced to two dimensions using t-distributed stochastic neighbour embedding algorithm, where colour specifies the target parameter and the shape corresponds to the strategy used for the specific objective (bottom left); example of the 19F NMR spectrum of the reaction mixture (bottom right). b Van Leusen Oxazole synthesis scheme (top); optimization results plot, *: purity is the relative area of the product peak divided by the sum of all peak areas, desirability is calculated as the weighted average between the two objectives (see Supplementary Information, Section 5.5.2); example of the HPLC chromatogram (bottom right). c Manganese-catalysed epoxidation scheme (top); example plot of the reaction monitoring using Raman spectroscopy (bottom left); example Raman spectrum (bottom right). Full description of the optimization parameters and chosen targets is given in the ESI (Section 5.5). d Trifluoromethylation reaction scheme; plot of the parameter space reduced to two dimensions using t-distributed stochastic neighbour embedding algorithm, where colour specifies the target parameter and the shape corresponds to the strategy used for the specific objective (bottom left); examples of the 19F Nuclear Magnetic Resonance (NMR) spectra where highlighted peak corresponds to the CF3 group in the specified product (bottom right). Source data are provided as a Source data file.
Fig. 6
Fig. 6. Optimization examples.
General reaction schemes for the a tosMIC and c phloroglucinol reactions with denoted parameters being optimized during the optimization cycle; corresponding parallel coordinate plots (b) and (d) where each vertical axis represent one of above mentioned parameters altered during each reaction with the last axis denoting the amount of product detected. Starting from the left parameters are connected with a line which represents a single reaction run. The reactions have been divided into three arbitrary groups, coloured in red, green and blue, for ease of interpretation and visualization, with respect to the normalized integration obtained for each reaction (amount of product). The coloured bold line within each group denotes a reaction of highest normalized integration; the orange dashed line denotes initial reaction parameters applied for the first reaction. Change of the integration observed during the optimization process for the e tosMIC and f phloroglucinol reaction with the second campaign denoted by a dashed line. Source data are provided as a Source data file.

References

    1. Trobe M, Burke MD. The molecular industrial revolution: automated synthesis of small molecules. Angew. Chem. Int. Ed. 2018;57:4192–4214. doi: 10.1002/anie.201710482. - DOI - PMC - PubMed
    1. Christensen M, et al. Automation isn’t automatic. Chem. Sci. 2021;12:15473–15490. doi: 10.1039/D1SC04588A. - DOI - PMC - PubMed
    1. Wilbraham L, Mehr SHM, Cronin L. Digitizing chemistry using the chemical processing unit: from synthesis to discovery. Acc. Chem. Res. 2021;54:253–262. doi: 10.1021/acs.accounts.0c00674. - DOI - PubMed
    1. Shi Y, Prieto PL, Zepel T, Grunert S, Hein JE. Automated experimentation powers data science in chemistry. Acc. Chem. Res. 2021;54:546–555. doi: 10.1021/acs.accounts.0c00736. - DOI - PubMed
    1. Stach E, et al. Autonomous experimentation systems for materials development: a community perspective. Matter. 2021;4:2702–2726. doi: 10.1016/j.matt.2021.06.036. - DOI

LinkOut - more resources