. 2024 Mar;9(3):763-775.
doi: 10.1038/s41564-024-01603-2. Epub 2024 Feb 9.

Synthesis of lipid-linked precursors of the bacterial cell wall is governed by a feedback control mechanism in Pseudomonas aeruginosa

Affiliations

Synthesis of lipid-linked precursors of the bacterial cell wall is governed by a feedback control mechanism in Pseudomonas aeruginosa

Lindsey S Marmont et al. Nat Microbiol. 2024 Mar.

Abstract

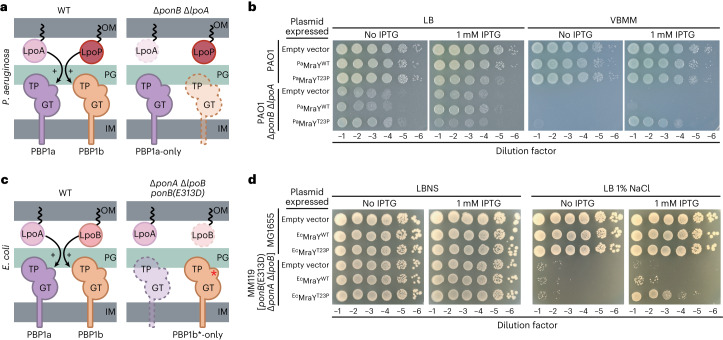
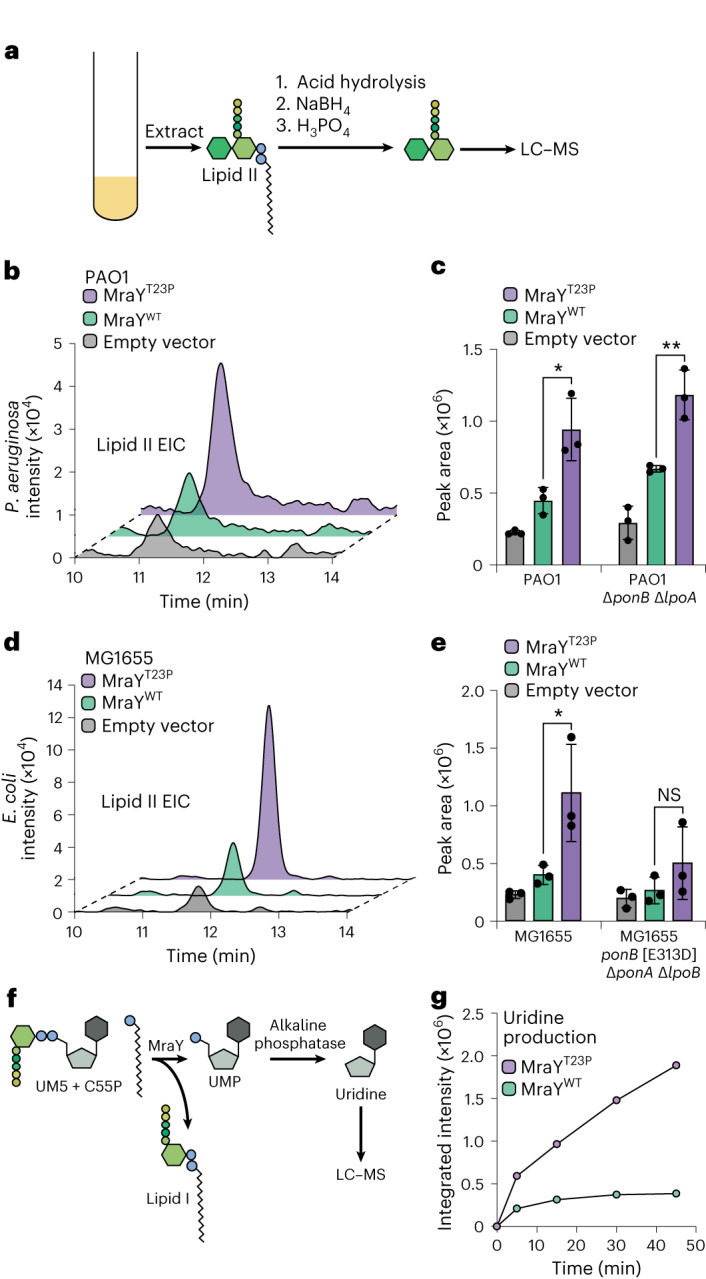
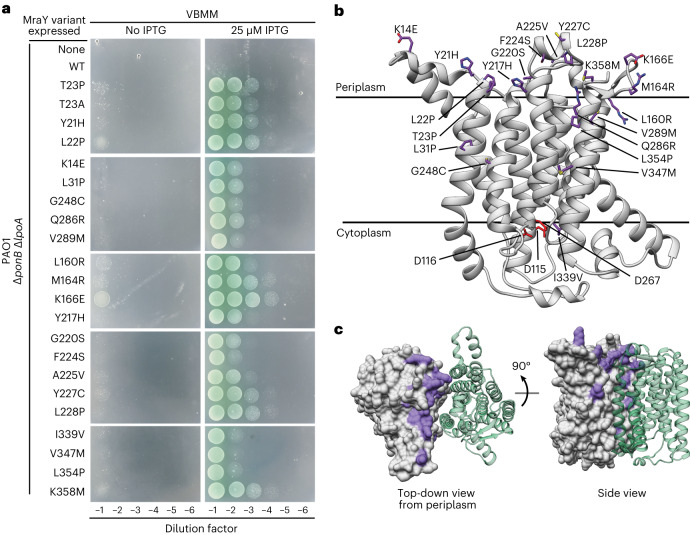
Many bacterial surface glycans such as the peptidoglycan (PG) cell wall are built from monomeric units linked to a polyprenyl lipid carrier. How this limiting carrier is distributed among competing pathways has remained unclear. Here we describe the isolation of hyperactive variants of Pseudomonas aeruginosa MraY, the enzyme that forms the first lipid-linked PG precursor. These variants result in the elevated production of the final PG precursor lipid II in cells and are hyperactive in vitro. The activated MraY variants have substitutions that map to a cavity on the extracellular side of the dimer interface, far from the active site. Our structural and molecular dynamics results suggest that this cavity is a binding site for externalized lipid II. Overall, our results support a model in which excess externalized lipid II allosterically inhibits MraY, providing a feedback mechanism that prevents the sequestration of lipid carrier in the PG biogenesis pathway.


Conflict of interest statement

The authors declare no competing interests.

Figures

Fig. 1
Fig. 1. MraY(T23P) restores growth to strains defective in PG biosynthesis.
a,c, Schematic representation of the aPBPs and their outer membrane lipoprotein activators in Pseudomonas aeruginosa (a) and Escherichia coli (c). b,d, Tenfold serial dilutions of cells of the indicated P. aeruginosa (b) or E. coli (d) strains harbouring expression plasmids producing the indicated MraY variant. Dilutions were plated on the indicated medium with or without IPTG to induce the production of MraY variants as indicated. Asterisks indicate the activated form of E. coli PBP1b. Dashed outlines in a and c represent proteins that are absent in the specified strain. IM, inner membrane; GT, glycosyltransferase; TP, transpeptidase.
Fig. 2
Fig. 2. Cells expressing MraY(T23P) accumulate lipid II.
a, Schematic representation of the method used to isolate and analyse lipid II from bacterial cells. be, Representative extracted ion chromatograms of lipid II (EIC) and quantification of EICs for P. aeruginosa (b,c) or E. coli (d,e) strains expressing the indicated MraY variant. Three independent replicates of the extractions were performed and lipid II levels quantified using the area of the peak from the extracted ion chromatogram using the Agilent software. Dots represent the values obtained for the biological replicates; bars and error bars indicate mean ± s.d. For PAO1: MraYT23P vs MraYWT in PAO1 *P = 0.0219, PAO1 ΔponB ΔlpoA **P = 0.007; for MG1655: MraYT23P vs MraYWT in MG1655 *P = 0.0456, MG1655 ΔponA ΔlpoB ponB[E313D], NS (not significant), (unpaired two-tailed t-test) but the trends for the individual samples were consistent with the other experiments with PaMraYT23P production promoting the highest levels of lipid II and empty vector the least. f, Schematic representation of the MraY enzyme assay. g, Representative time course showing the production of uridine in assays containing purified MraY or MraYT23P as indicated. The assay was repeated at least twice with two independent preparations of protein. NaBH4, sodium borohydride; H3PO4, phosphoric acid. Source data
Fig. 3
Fig. 3. Amino acid substitutions in hyperactive MraY variants localize to the extracytoplasmic surface of the dimer interface.
a, Tenfold serial dilutions of P. aeruginosa ΔponB ΔlpoA cells harbouring expression plasmids producing the indicated MraY variant were plated on VBMM with or without IPTG to induce the MraY variants as indicated. b, Structural model of P. aeruginosa MraY created using AlphaFold in cartoon viewed from the plane of the membrane. Residues altered in hyperactive variants tested in a are shown in stick representation (purple), while those residues previously implicated in catalysis are shown in red. c, Structural model of the MraY dimer created using AlphaFold. Surface representation of one protomer is shown in grey, with the residues altered in hyperactive variants coloured in purple. The other protomer is shown in cartoon representation (green) for simplicity. Left: periplasmic view of the dimer. Right: view from the plane of the membrane.
Fig. 4
Fig. 4. Identification of a potential lipid II binding site in MraY.
a, Periplasmic view of the cryo-EM structure of the EcMraY(T23P) dimer within the YES complex shown in surface representation, with the unmodelled electron density shown (green). b, As in a, but membrane view of the electron density within the dimer interface of the EcMraY dimer with the foreground MraY removed. c, Top view of the MraY dimer in a mixed CG membrane. Two lipid II molecules (highlighted as green and pink spheres) freely enter the MraY cavity during unbiased MD simulations. In 8/9 repeats, 2 or 3 lipid I or II molecules bind the cavity. In the last repeat, one lipid II and one C55P molecule bind. d, Lipid II contacts with MraY residues that interact with lipid II for over 60% of atomistic MD simulations, where the dashed line indicates the 60% cutoff. Dots represent the values obtained for the independent replicates; bars and error bars indicate mean ± s.e. from 5 repeats. Darker green bars represent residues altered in hyperactive variants. e, Lipid II contacts with MraY residues by part of lipid II that is interacting (tail and phosphate, MurNAc, GlcNAc or pentapeptide). Residues shown are the same as those in d. Darker bars represent residues altered in hyperactive variants. f, Average density of lipid II molecules (green) from atomistic MD simulations of MraY (grey) bound to lipid II. Shown as inside view of dimer interface, where only one monomer of MraY is shown and residues altered in hyperactive variants are coloured in purple.
Fig. 5
Fig. 5. Model for feedback regulation of MraY by flipped lipid II.
Shown are schematics summarizing the model for MraY regulation. Left: when PG polymerase activity is high, flipped lipid II is consumed at a rate proportional to its production such that steady-state levels of the precursor remain low and MraY activity is unimpeded. Right: when PG polymerase activity is reduced due to changes in growth conditions or other perturbations, lipid II will be produced faster than it is consumed, resulting in the accumulation of elevated levels of flipped lipid II. Higher levels of the precursor promote its binding to MraY dimers, reducing their activity to bring lipid II supply back in balance with demand by the polymerases. See text for details. UG, UDP-GlcNAc.
Extended Data Fig. 1
Extended Data Fig. 1. Expression of PaMraY(T23P) in P. aeruginosaponBlpoA rescues cell shape defects.
Phase contrast micrographs of P. aeruginosa PAO1 and PAO1 ∆ponBlpoA cells grown in LB with 1 mM IPTG to induce the indicated MraY protein. Scale bar = 10 µm. Representative images of two independent experiments are shown.
Extended Data Fig. 2
Extended Data Fig. 2. Catalytic activity is required for MraY(T23P) to suppress cell wall defects.
Ten-fold serial dilutions of cells of the indicated P. aeruginosa strains harboring expression plasmids producing the indicated MraY variant were plated on media with or without IPTG to induce production of MraY variants as indicated.
Extended Data Fig. 3
Extended Data Fig. 3. Cells produce MraY(WT) and MraY(T23P) to comparable levels.
(a) Ten-fold serial dilutions of P. aeruginosa cells harboring expression plasmids producing the indicated VSVG-tagged MraY were plated on media with or without inducer as indicated. (b) Western blot of cells expressing MraY(WT)-VSVG or MraY(T23P)-VSVG. P. aeruginosa cells expressing the indicated plasmid were grown to mid-log, normalized for optical density, and extracts were prepared for immunoblotting. Protein was detected using α-VSVG antibody. Data is representative of two replicates. Source data
Extended Data Fig. 4
Extended Data Fig. 4. Lipid I levels in cells producing MraY(WT) or MraY(T23P).
(a) Chemical structures of the Lipid II (LII) and Lipid I (LI) hydrolysis products detected by LCMS. Quantification of extracted ion chromatograms of the lipid I hydrolysis product for the indicated P. aeruginosa (b) and E. coli (c) strains. Three independent extractions were performed with lipid I levels quantified using the area of the peak from the extracted ion chromatogram using the Agilent software. Dots represent the values obtained for the biological replicates and the bars indicate the mean. Error bars represent SD. For MraY(T23P) vs MraY(WT) in PAO1 ΔponB ΔlpoA *P = 0.039, in PAO1, MG1655, MG1655 ΔponA ΔlpoB ponB[E313D], not significant (unpaired, two-tailed, t-test). Source data
Extended Data Fig. 5
Extended Data Fig. 5. Expression of PaMraY(T23P) causes a pyocin-dependent growth defect in P. aeruginosa due to a reduction in O-antigen production.
(a) Ten-fold serial dilutions of P. aeruginosa strains harboring expression plasmids producing the indicated MraY variant were plated on LB containing with or without IPTG to induce protein production from the plasmids. (b) Western blots of B-band O-antigen from P. aeruginosa cells expressing the MraY proteins as indicated. Image contains three independent experiments. (C) The B-band LPS from three independent replicates of sample extraction was quantified using densitometry. Dots represent the values obtained for the biological replicates and the bars indicate the mean. Error bars represent SEM, *P = 0.0031 (unpaired, two-tailed, t-test). (d) Ten-fold serial dilutions of P. aeruginosa cells harboring expression plasmids producing the indicated WbpL protein, dilutions were plated on VBMM with or without IPTG to induce the WbpL protein as indicated. Abbreviations: WT, wild-type; VBMM, VogelBonner minimal medium; IPTG, isopropyl-B-D-1-thiogalactopyranoside. Source data
Extended Data Fig. 6
Extended Data Fig. 6. The cavity of MraY is hydrophobic.
Hydrophobic surface representation of the structures of MraY from E. coli (PDB 8G01), A. aeolicus (PDB 4J72), E. boltae (PDB 5JNQ), and the Alphafold2 model of P. aeruginosa MraY, colored according to the scale as shown in the Figure.
Extended Data Fig. 7
Extended Data Fig. 7. MraY residues contacting lipid II in the MD simulations.
Lipid II contacts with MraY residues from atomistic MD simulations. Error bars represent standard error from 5 repeats. Darker green bars represent residues altered in hyperactive variants. Dashed line at x = 0.6 represents cutoff for interactions shown in Fig. 4c.
Extended Data Fig. 8
Extended Data Fig. 8. Flexibility of MraY bound lipid II in the MD simulation.
All states of lipid II from 5 repeats of atomistic simulation overlaid onto the structure of MraY. Colored as in Fig. 4d.
Extended Data Fig. 9
Extended Data Fig. 9. MD analysis identifies potential conformational changes in MraY upon lipid II binding.
(a) Structure of MraY dimer in state when lipid II is bound (not shown). Residues V208 and S226 are indicated and colored purple. (b-d) An overlay of the structure of MraY at the end of simulations with (purple) or without (gray) lipid II present. (b) The structure is shown from the top, lipid II is hidden, and helices with notable differences are indicated. (c, d) MraY with lipid II, boxes indicate where lipid II clashes with the structure from the simulation without lipid II, indicating why the periplasmic helix 221-228 is moved apart when lipid II is bound. (c) is top (periplasmic) view, while (d) is a side view. (e) A boxplot of the average distance between V208 (a residue in the lipid II binding pocket) of each MraY monomer, in simulations with or without lipid II present. The data represented by each box plot is the mean distance from all time points in each of 5 repeats (minima/maxima: 17.2/18.7, no lip2; 21.2/22.0, lip2). Box plot center line represents the median, while the box limits represent the upper and lower quartiles. The whiskers represent the 1.5x interquartile range. (f) A boxplot of the average distance between S226 (a residue in the periplasmic helix above the lipid II binding site) of each MraY monomer, in simulations with or without lipid II present. The data represented by each box plot is the mean distance from all time points in each of 5 repeats (minima/maxima: 12.0/15.8, no lip2; 18.5/21.6, lip2). Box plot center line represents the median, while the box limits represent the upper and lower quartiles. The whiskers represent the 1.5x interquartile range.
Extended Data Fig. 10
Extended Data Fig. 10. Comparison of MraY(WT) and MraY(T23P) structures in the YES complex.
(a) Overlay of densities of MraY(WT) (EMD-29641) (green) and MraY(T23P) (purple) viewed in the plane of the membrane. (b) Enlarged view of the densities around the T23P mutant. Residues are shown in stick representation. Residues 21-23 are labeled for reference. (c) As in B for the wild-type complex. (d) Hydrogen bonding network observed in MraY(T23P) (left, purple) compared to WT (right, green) at the mutagenesis site involving Y21, Y227, and K358. (e) Similar to D, overlay of the two models highlighting the conformational differences of residue Y21.

Update of

References

    1. May KL, Silhavy TJ. Making a membrane on the other side of the wall. Biochim. Biophys. Acta Mol. Cell Biol. Lipids. 2017;1862:1386–1393. doi: 10.1016/j.bbalip.2016.10.004. - DOI - PMC - PubMed
    1. Silhavy TJ, Kahne D, Walker S. The bacterial cell envelope. C. 2010;2:a000414. - PMC - PubMed
    1. Huszczynski SM, Lam JS, Khursigara CM. The role of Pseudomonas aeruginosa lipopolysaccharide in bacterial pathogenesis and physiology. Pathogens. 2019;9:6. doi: 10.3390/pathogens9010006. - DOI - PMC - PubMed
    1. Rohs PDA, Bernhardt TG. Growth and division of the peptidoglycan matrix. Annu. Rev. Microbiol. 2021;75:315–336. doi: 10.1146/annurev-micro-020518-120056. - DOI - PubMed
    1. Piepenbreier H, Diehl A, Fritz G. Minimal exposure of lipid II cycle intermediates triggers cell wall antibiotic resistance. Nat. Commun. 2019;10:2733. doi: 10.1038/s41467-019-10673-4. - DOI - PMC - PubMed

LinkOut - more resources