. 2024 Feb 9;14(1):3331.
doi: 10.1038/s41598-024-53739-0.

Short tandem repeat mutations regulate gene expression in colorectal cancer

Affiliations

Short tandem repeat mutations regulate gene expression in colorectal cancer

Max A Verbiest et al. Sci Rep. .

Abstract

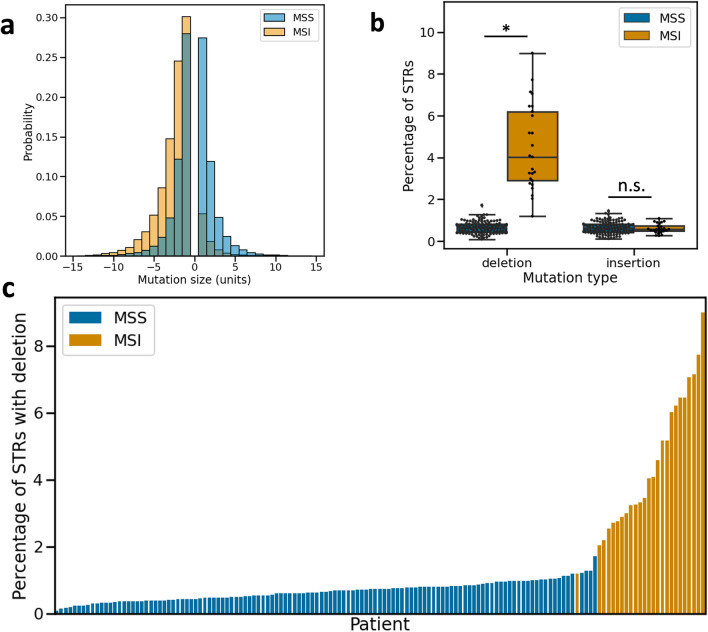
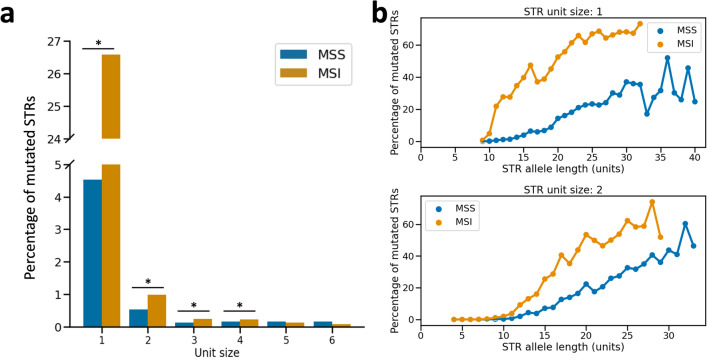
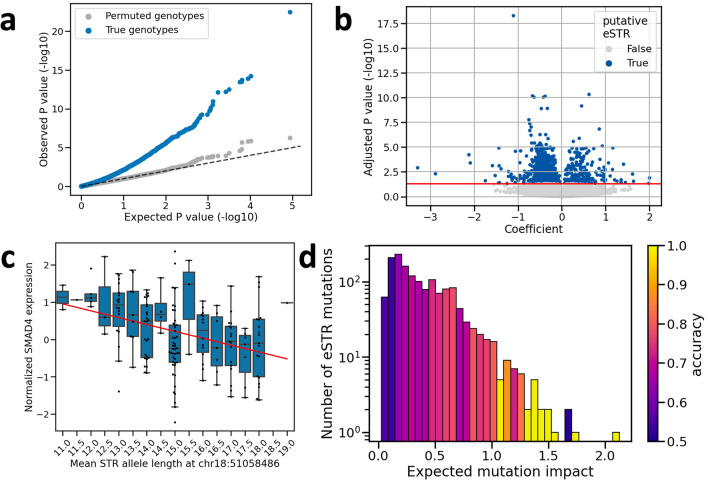
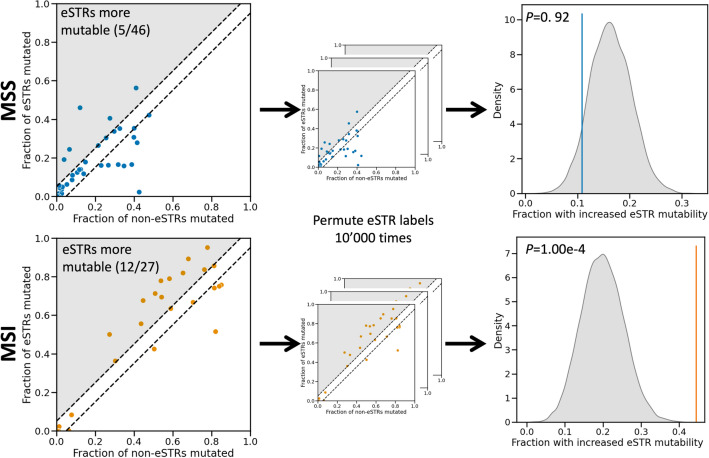
Short tandem repeat (STR) mutations are prevalent in colorectal cancer (CRC), especially in tumours with the microsatellite instability (MSI) phenotype. While STR length variations are known to regulate gene expression under physiological conditions, the functional impact of STR mutations in CRC remains unclear. Here, we integrate STR mutation data with clinical information and gene expression data to study the gene regulatory effects of STR mutations in CRC. We confirm that STR mutability in CRC highly depends on the MSI status, repeat unit size, and repeat length. Furthermore, we present a set of 1244 putative expression STRs (eSTRs) for which the STR length is associated with gene expression levels in CRC tumours. The length of 73 eSTRs is associated with expression levels of cancer-related genes, nine of which are CRC-specific genes. We show that linear models describing eSTR-gene expression relationships allow for predictions of gene expression changes in response to eSTR mutations. Moreover, we found an increased mutability of eSTRs in MSI tumours. Our evidence of gene regulatory roles for eSTRs in CRC highlights a mostly overlooked way through which tumours may modulate their phenotypes. Future extensions of these findings could uncover new STR-based targets in the treatment of cancer.


Conflict of interest statement

The authors declare no competing interests.

Figures

Figure 1
Figure 1
Characteristics of STR mutations in MSS and MSI patients. (a) Distributions of STR mutation step sizes (in units) for MSS and MSI patients, with negative step sizes indicating deletions in tumours and positive step sizes insertions. Step sizes in the range [-15, 15] are shown. The y-axis displays the probability of an STR mutation being a certain step size. Data from MSS (blue) and MSI (orange) tumours are shown separately as overlapping histograms. The histograms for MSS and MSI data each sum to one. (b) Boxplots showing insertion and deletion frequencies at STRs in MSS and MSI tumours. Boxes extend from Q1 to Q3, with a line indicating the median value. Significant differences are indicated by asterisks, non-significant differences by n.s. (c) For every patient for which STR mutations could be called, the percentage of STRs with deletions is shown. Patients are ordered along the x-axis based on STR insertion rate, and bars are coloured by MSI status. MSS microsatellite stable, MSI microsatellite instable.
Figure 2
Figure 2
STR unit size and allele length influence mutability in CRC. (a) STR mutability for the different unit sizes. Mutability is shown separately for MSS and MSI tumours. Note: the y-axis contains an axis break to accommodate the full range of mutability across the different unit sizes. Significant differences in mutability between MSS and MSI tumours are indicated with asterisks. (b) STR mutability as a function of unit size and allele length. For unit sizes one and two, mutation frequencies are shown for STR allele lengths for which a comparison between a healthy and tumour sample could be made in at least 50 patients. Results are plotted separately for MSS and MSI tumours. For other unit sizes, see Supplementary file 1: Fig. S3. MSS microsatellite stable, MSI microsatellite instable.
Figure 3
Figure 3
eSTRs detected in colorectal cancer tumours. (a) Q-Q plot comparing expected versus observed P-values obtained from the eSTR analysis (blue) and P-values obtained under permutation of STR genotypes (grey). Expected P-values were generated under a continuous uniform distribution on the interval [0, 1], representing the null hypothesis of no eSTRs (dashed line). (b) Significance testing of eSTR-gene expression associations. The coefficients and their P-values are plotted for all tested STR-gene pairs. The horizontal red line indicates the significance threshold after controlling the false discovery rate at α=0.05 using the Benjamini-Hochberg procedure. Dots are coloured based on significance of the coefficient (grey=not significant, blue=significant). In total, there were 1259 STR-gene pairs with a significant association. (c) Example of an eSTR. We observed a significant linear relationship between the allele length of a mononucleotide repeat starting at position 51,058,486 on chromosome 18 and the normalised expression of SMAD4. The STR length is shown on the x-axis (mean of two alleles), and the normalised SMAD4 expression on the y-axis. Every dot represents one tumours sample. Boxplots show the distribution of expression values across tumours at each STR genotype. Boxes extend from Q1 to Q3, with a line indicating the median value. The red line represents the linear model relating STR length to normalised expression. (d) Histogram showing the expected mutation impact of eSTR mutations. Bars are coloured based on the accuracy of gene expression change predictions obtained using mutations in each bin. eSTR mutations with high expected impact tended to yield higher prediction accuracy. eSTR expression short tandem repeat.
Figure 4
Figure 4
Comparing the mutability of eSTRs and non-eSTRs in CRC tumours. The top row shows results for MSS patients, the bottom row for MSI patients. In the scatter plots on the left every dot represents a repeat type, which is uniquely characterised by a combination of STR unit size and allele length. The fraction of mutated non-eSTRs is shown on the x-axis, and the fraction of mutated eSTRs on the y-axis. Dots that fall between the dashed lines represent repeat types for which no difference in mutability between eSTRs and non-eSTRs was observed. For repeat types that fall in the shaded region, eSTRs were more mutable than non-eSTRs (their numbers are noted in the top left). To generate a null distribution, eSTR labels were permuted 10,000 times for both MSS and MSI patient mutation data (middle column). For each permutation, the fraction of repeat types for which the eSTRs were more mutable was determined. Kernel density estimates of the resulting distributions are shown in the right column. Vertical coloured stripes represent the observed fraction of repeat types where eSTRs were more mutable. P-values obtained from comparing the observed values to their respective null distributions using permutation tests are shown in the top left. MSS microsatellite stable, MSI microsatellite instable, eSTR expression short tandem repeat.

Similar articles

Cited by

References

    1. Ellegren H. Microsatellites: Simple sequences with complex evolution. Nat. Rev. Genet. 2004;5:435–445. doi: 10.1038/nrg1348. - DOI - PubMed
    1. Sun JX, et al. A direct characterization of human mutation based on microsatellites. Nat. Genet. 2012;44:1161–1165. doi: 10.1038/ng.2398. - DOI - PMC - PubMed
    1. Mitra I, et al. Patterns of de novo tandem repeat mutations and their role in autism. Nature. 2021;589:246–250. doi: 10.1038/s41586-020-03078-7. - DOI - PMC - PubMed
    1. Verbiest M, et al. Mutation and selection processes regulating short tandem repeats give rise to genetic and phenotypic diversity across species. J. Evol. Biol. 2023;36:321–336. doi: 10.1111/jeb.14106. - DOI - PMC - PubMed
    1. Martin-Trujillo A, Garg P, Patel N, Jadhav B, Sharp AJ. Genome-wide evaluation of the effect of short tandem repeat variation on local DNA methylation. Genome Res. 2023;33:184–196. doi: 10.1101/gr.277057.122. - DOI - PMC - PubMed