. 2024 Feb 9;14(1):3365.
doi: 10.1038/s41598-024-51906-x.

Imaging mass cytometry analysis of Becker muscular dystrophy muscle samples reveals different stages of muscle degeneration

Affiliations

Imaging mass cytometry analysis of Becker muscular dystrophy muscle samples reveals different stages of muscle degeneration

Patricia Piñol-Jurado et al. Sci Rep. .

Abstract

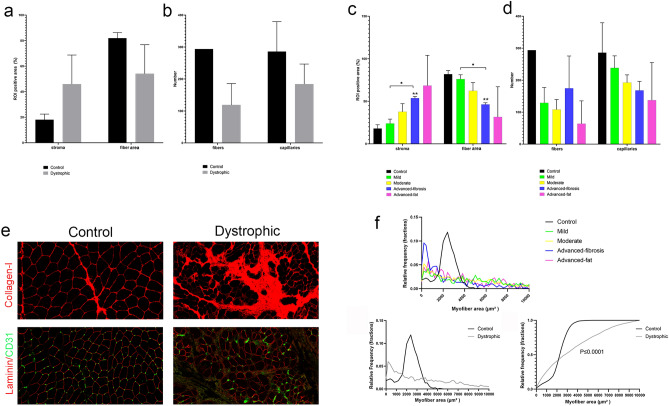
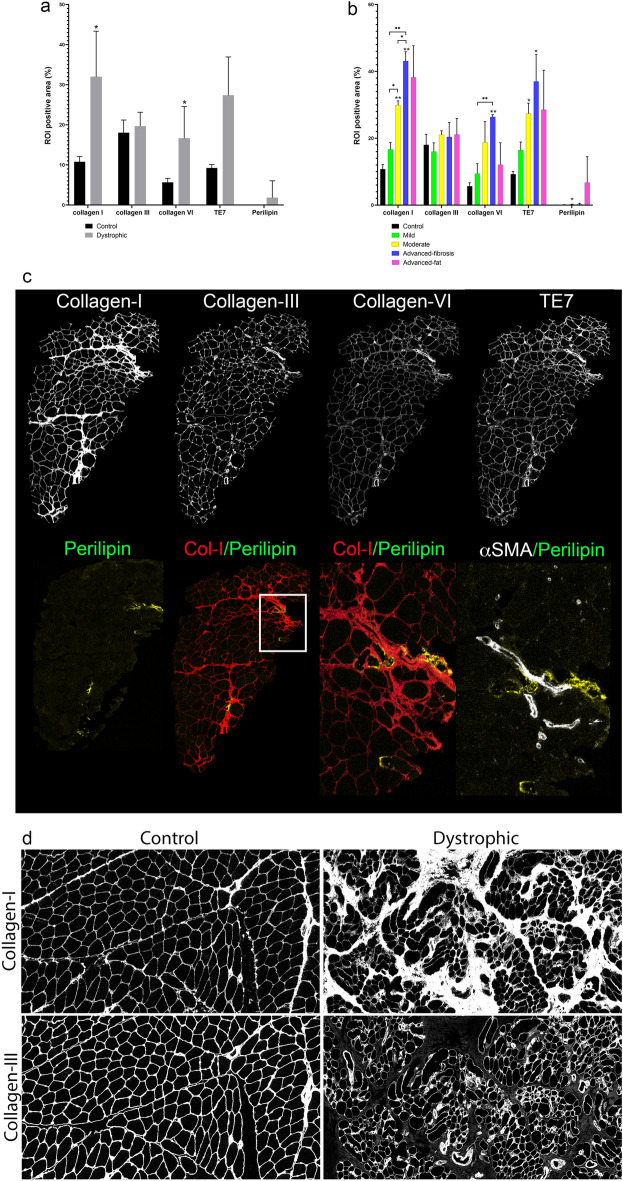
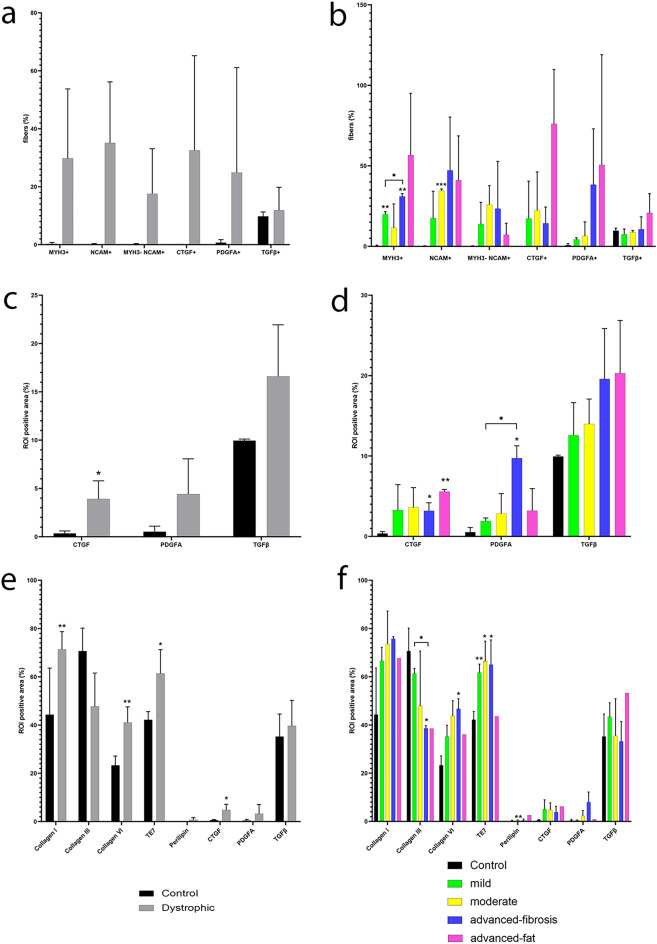
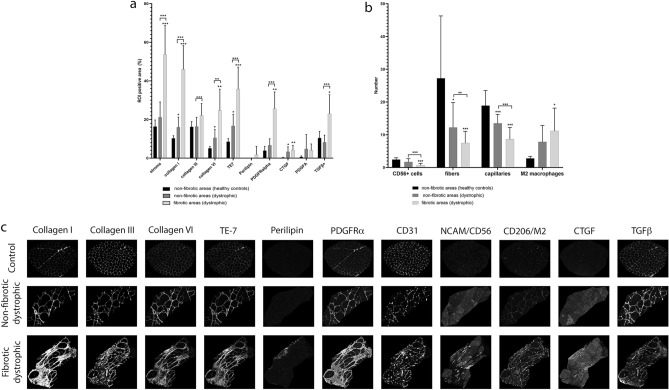
Becker muscular dystrophy (BMD) is characterised by fiber loss and expansion of fibrotic and adipose tissue. Several cells interact locally in what is known as the degenerative niche. We analysed muscle biopsies of controls and BMD patients at early, moderate and advanced stages of progression using Hyperion imaging mass cytometry (IMC) by labelling single sections with 17 markers identifying different components of the muscle. We developed a software for analysing IMC images and studied changes in the muscle composition and spatial correlations between markers across disease progression. We found a strong correlation between collagen-I and the area of stroma, collagen-VI, adipose tissue, and M2-macrophages number. There was a negative correlation between the area of collagen-I and the number of satellite cells (SCs), fibres and blood vessels. The comparison between fibrotic and non-fibrotic areas allowed to study the disease process in detail. We found structural differences among non-fibrotic areas from control and patients, being these latter characterized by increase in CTGF and in M2-macrophages and decrease in fibers and blood vessels. IMC enables to study of changes in tissue structure along disease progression, spatio-temporal correlations and opening the door to better understand new potential pathogenic pathways in human samples.


Conflict of interest statement

The authors declare no competing interests.

Figures

Figure 1
Figure 1
General description of images obtained by IMC and differences between healthy control and dystrophic samples. (a) Mean of the positive area (%) occupied by the stroma and fibers in healthy (n = 2, black bars) and dystrophic patients (n = 8, grey bars). (b) Mean of fiber and capillary number in healthy (n = 2, black bars) and dystrophic patients (n = 8, grey bars). (c) Mean of the positive area (%) occupied by the stroma and fibers according to the level of severity of the disease: healthy controls (n = 2, black bars), mild (n = 2, green bars), moderate (n = 2, yellow bars), advanced-fibrosis (n = 2, blue bars) and advanced-fat conditions (n = 2, pink bars). (d) Mean of fiber and capillary number according to the level of severity of the disease: healthy control (n = 2, black bars), mild (n = 2, green bars), moderate (n = 2, yellow bars), advanced-fibrosis (n = 2, blue bars) and advanced-fat conditions (n = 2, pink bars). (e) IMC images of areas occupied by collagen I (red) on the top in control and dystrophic patients. Long arrow point to collagen-I located between fibers in normal muscle, while there is a increased collagen deposition in dystrophic patients (long arrow). The bottom images show blood vessels (CD31 + cells, green, arrrowheads) between fibers that can be identified thanks to the statining with laminin (red) in control and dystrophic samples. Control and dystrophic sample correspond to samples C-1 and BMD-6 (advanced-fibrosis), respectively. (f) Top: Relative frequency histogram showing the quantification of myofiber cross-sectional areas (CSAs) in the different study groups: healthy control (n = 2, black bars), mild (n = 2, green bars), moderate (n = 2, yellow bars), advanced-fibrosis (n = 2, blue bars) and advanced-fat conditions (n = 2, pink bars). Bottom left: Relative frequency graph showing the quantification of CSAs from each group: healthy group (n = 2, black line) and dystrophic patients group (n = 8, grey line). Bottom right: An empirical cumulative distribution function graph of all myofiber CSAs from the noted groups, with significance determined by a KS test (n = 1572 [healthy control group] and 3978 [dystrophic patients]). Error bars represent ± standard deviation (SD). *p ≤ 0.05, **p ≤ 0.01, ***p ≤ 0.001.
Figure 2
Figure 2
ECM proteins in dystrophic and control muscle samples. (a) Mean of the ROI positive area (%) occupied by collagen I, collagen III, collagen VI, TE7 and perilipin in healthy controls (n = 2, black bars) and dystrophic muscles (n = 8, grey bars). (b) Mean of the ROI positive area (%) occupied by collagen I, collagen III, collagen VI, TE7 and perilipin in healthy controls (n = 2, black bars), mild (n = 2, green bars), moderate (n = 2, yellow bars), advanced-fibrosis (n = 2, blue bars) and advanced-fat conditions (n = 2, pink bars). (c) IMC images showing collagen I, collagen III, collagen VI, TE-7 and perilipin staining in the muscle sample from BMD-2 (mild condition). Yellow arrows points to perilipin accumulation in close localization to collagen-I deposition (red arrow) and to vessels expressing αSMA (white arrow). (d) IMC images of a control (left) and BMD-6 sample (advanced fibrosis-right) showing examples of collagen I and collagen III expression. Yellow arrows show normal accumulation of collagen I and III in the stroma between fibers in controls. Blue arrows point to the abnormal extensive accumulation of collagen-I occupying the stroma of the dystrophic patient, while collagen-III expression remains at a similar level than in control surrounding muscle fibers. Error bars represent ± SD. *p ≤ 0.05, **p ≤ 0.01, ***p ≤ 0.001.
Figure 3
Figure 3
Different cell type found in the muscles of study. (a) Mean of CD56 + cell, macrophage (CD68 +), M2 macrophage (CD206 +) and non-M2 macrophage (CD68 + CD206-) number and ROI positive area (%) occupied by PDGFRalpha (FAP marker) in healthy controls (n = 2, black bars) and dystrophic muscles (n = 8, grey bars). (b) Mean of CD56 + cell, macrophage (CD68 +), M2 macrophage (CD206 +) and non-M2 macrophage (CD68 + CD206-) number and ROI positive area (%) occupied by PDGFRalpha (FAP marker) according to the level of severity of the disease: healthy controls (n = 2, black bars), mild (n = 2, green bars), moderate (n = 2, yellow bars), advanced-fibrosis (n = 2, blue bars) and advanced-fat conditions (n = 2, pink bars). (c) IMC images of C-1 (control) and BMD-6 sample (advanced-fibrosis condition) showing M2 macrophages (CD206 + , blue), capillaries (CD31 + , green), CD56 + cells (white) and laminin (red) at the top of the panel and PDGFR + cells (cyan) at the bottom of the panel. Blue arrows point to macrophages showing a clear increase in their number in the dystrophic sample. Yellow arrows point to capillaries. As shown in figure, macrophages (blue arrows) accumulate close vessels (yellow arrow) in the dystrophic sample. Green arrow points to PDGFR-alpha staining (FAPs) located in the interfiber space and clearly increased in the dystrophic sample. Error bars represent ± SD. *p ≤ 0.05, **p ≤ 0.01, ***p ≤ 0.001.
Figure 4
Figure 4
Markers of regeneration/degeneration and growth factors. (a) Percentage of MYH3 + , CD56 + , MYH3-CD56 + , CTGF + , PDGFA + , and TGFβ + fibers using a threshold of 10% (fiber is positive for at least 10% of its area), 5% in the case of CTGF, in healthy controls (n = 2, black bars) and and dystrophic muscles (n = 8, grey bars). (b) Percentage of MYH3 + , CD56 + , MYH3-CD56 + , CTGF + , PDGFA + , and TGFβ + fibers using the same thresholds as before in healthy controls (n = 2, black bars), mild (n = 2, green bars), moderate (n = 2, yellow bars), advanced-fibrosis (n = 2, blue bars) and advanced-fat conditions (n = 2, pink bars) after fiber segmentation. (c) Mean of the positive area (%) occupied by CTGF, PDGFA and TGFβ in healthy controls (n = 2, black bars) and dystrophic muscles (n = 8, grey bars). (d) Mean of the positive area (%) occupied by CTGF, PDGFA and TGFβ in healthy controls (n = 2, black bars), mild (n = 2, green bars), moderate (n = 2, yellow bars), advanced-fibrosis (n = 2, blue bars) and advanced-fat conditions (n = 2, pink bars). (e) Mean of the ROI positive area (%) occupied by collagen I, collagen III, collagen VI, TE7, perilipin, CTGF, PDGFA and TGFβ in the muscle stroma of healthy controls (n = 2, black bars) and dystrophic muscles (n = 8, grey bars) after segmentation. (f) Mean of the ROI positive area (%) occupied by collagen I, collagen III, collagen VI, TE7, perilipin, CTGF, PDGFA and TGFβ in the muscle stroma of healthy controls (n = 2, black bars), mild (n = 2, green bars), moderate (n = 2, yellow bars), advanced-fibrosis (n = 2, blue bars) and advanced-fat conditions (n = 2, pink bars) after segmentation. Error bars represent ± SD. *p ≤ 0.05, **p ≤ 0.01, ***p ≤ 0.001.
Figure 5
Figure 5
Comparison between fibrotic and non-fibrotic areas of the same or different samples. (a) Mean of the positive area (%) occupied by stroma, collagen I, collagen III, collagen VI, TE7, perilipin, PDGFRalpha, CTGF, PDGFA and TGFβ in non-fibrotic areas from healthy controls (n = 4, black bars), non-fibrotic areas from dystrophic muscles (n = 21, dark grey bars) and fibrotic areas from fibrotic muscles (n = 25, light grey bars). (b) Mean of number of CD56 + cells, fibers, capillaries and M2 macrophages in non-fibrotic areas from healthy controls (black bars), non-fibrotic areas from dystrophic muscles (dark grey bars) and fibrotic areas from fibrotic muscles (light grey bars). (c) IMC images representing fibrotic and non-fibrotic areas showing capillaries, ECM proteins and cells of study. Arrows point to areas where collagen I, collagen VI, TE7, perilipin, PDGFR-alpha, NCAM, CD206, CTGF and TGF-beta is increased. Error bars represent ± SD. *p ≤ 0.05, **p ≤ 0.01, ***p ≤ 0.001.

Similar articles

Cited by

  • Decoding the muscle transcriptome of patients with late-onset Pompe disease reveals markers of disease progression.
    Monceau A, Nath RG, Suárez-Calvet X, Musumeci O, Toscano A, Kierdaszuk B, Kostera-Pruszczyk A, Domínguez-González C, Hernández-Lain A, Paradas C, Rivas E, Papadimas G, Papadopoulos C, Chrysanthou-Piterou M, Gallardo E, Olivé M, Lilleker J, Roberts ME, Marchese D, Lunazzi G, Heyn H, Fernández-Simón E, Villalobos E, Clark J, Katsikis P, Collins C, Mehra P, Laidler Z, Vincent A, Tasca G, Marini-Bettolo C, Guglieri M, Straub V, Raben N, Díaz-Manera J. Monceau A, et al. Brain. 2024 Dec 3;147(12):4213-4226. doi: 10.1093/brain/awae249. Brain. 2024. PMID: 39045638 Free PMC article.
  • Effects of aging on calcium channels in skeletal muscle.
    Dong M, Maturana AD. Dong M, et al. Front Mol Biosci. 2025 Mar 19;12:1558456. doi: 10.3389/fmolb.2025.1558456. eCollection 2025. Front Mol Biosci. 2025. PMID: 40177518 Free PMC article. Review.

References

    1. Hoffman EP, Kunkel LM. Dystrophin abnormalities in Duchenne/Becker muscular dystrophy. Neuron. 1989;2:1019–1029. doi: 10.1016/0896-6273(89)90226-2. - DOI - PubMed
    1. Wallace GQ, McNally EM. Mechanisms of muscle degeneration, regeneration, and repair in the muscular dystrophies. Annu. Rev. Physiol. 2009;71:37–57. doi: 10.1146/annurev.physiol.010908.163216. - DOI - PubMed
    1. Bencze M. Mechanisms of myofibre death in muscular dystrophies: The emergence of the regulated forms of necrosis in myology. Int. J. Mol. Sci. 2022;24(1):362. doi: 10.3390/ijms24010362. - DOI - PMC - PubMed
    1. Cappellari O, Mantuano P, De Luca A. “The social network” and muscular dystrophies: The lesson learnt about the niche environment as a target for therapeutic strategies. Cells. 2020;9(7):1659. doi: 10.3390/cells9071659. - DOI - PMC - PubMed
    1. Chang NC, Rudnicki MA. Satellite cells: The architects of skeletal muscle. Curr. Top. Dev. Biol. 2014;107:161–181. doi: 10.1016/B978-0-12-416022-4.00006-8. - DOI - PubMed