. 2024 Feb 9;15(1):1224.
doi: 10.1038/s41467-024-45627-y.

Amyloid-β aggregates activate peripheral monocytes in mild cognitive impairment

Affiliations

Amyloid-β aggregates activate peripheral monocytes in mild cognitive impairment

Kristian Juul-Madsen et al. Nat Commun. .

Abstract

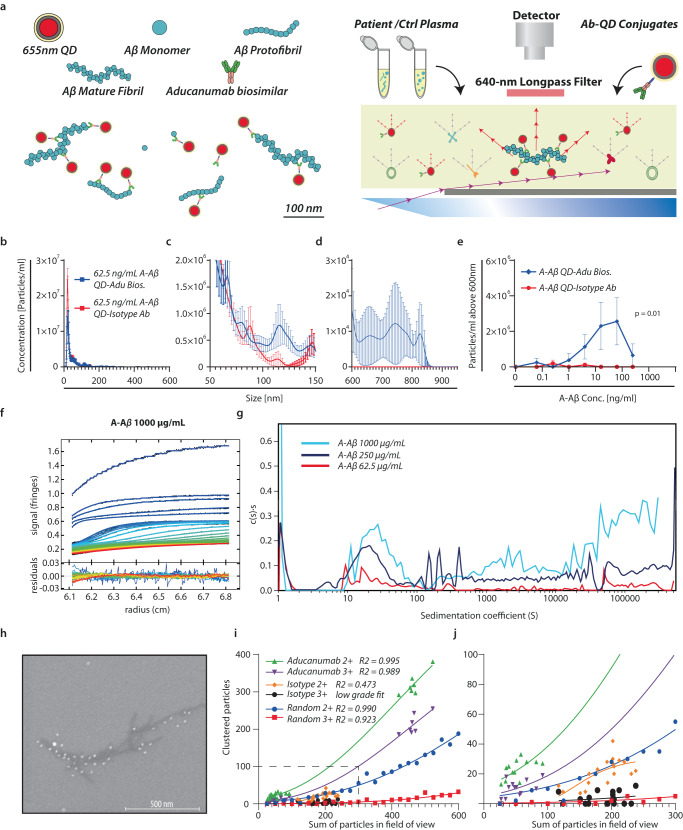
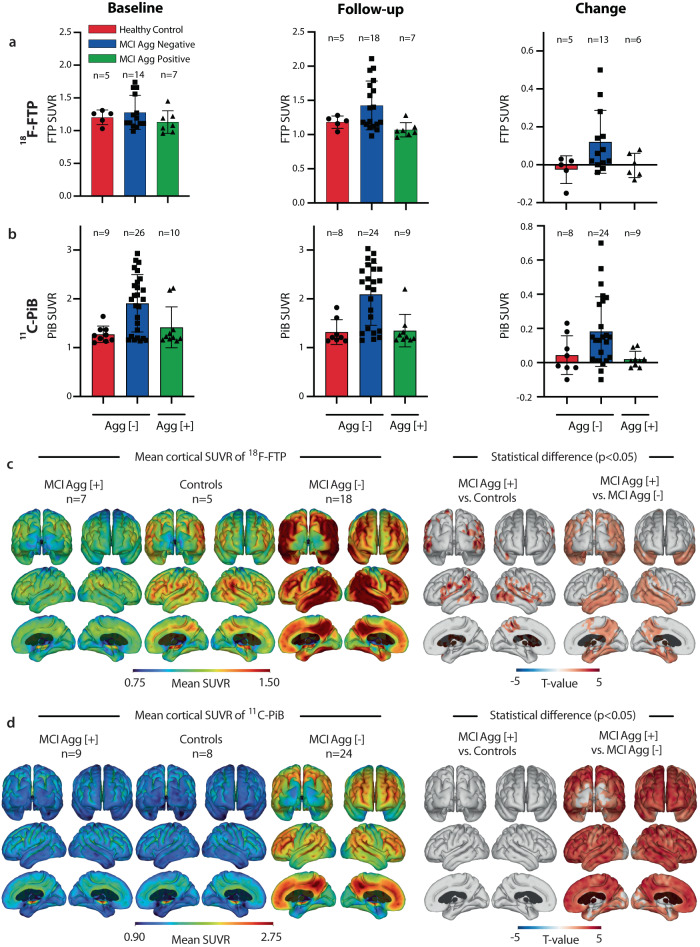
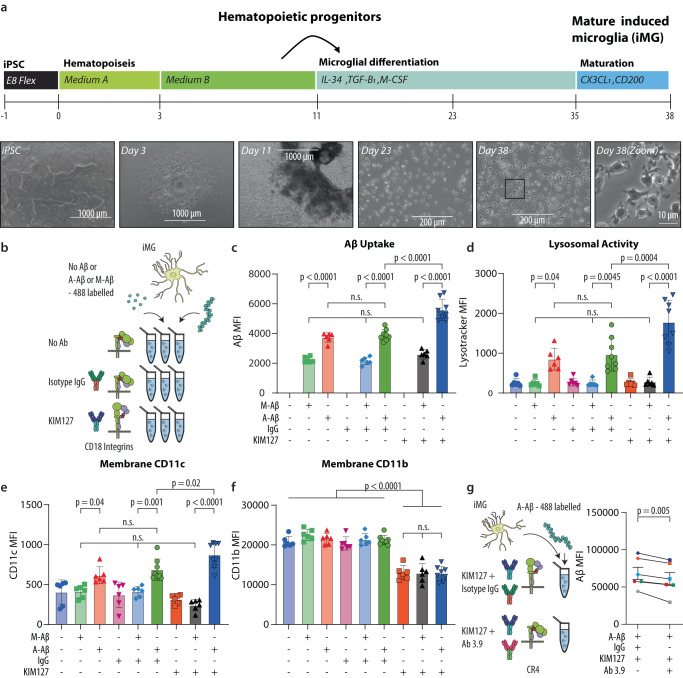
The peripheral immune system is important in neurodegenerative diseases, both in protecting and inflaming the brain, but the underlying mechanisms remain elusive. Alzheimer's Disease is commonly preceded by a prodromal period. Here, we report the presence of large Aβ aggregates in plasma from patients with mild cognitive impairment (n = 38). The aggregates are associated with low level Alzheimer's Disease-like brain pathology as observed by 11C-PiB PET and 18F-FTP PET and lowered CD18-rich monocytes. We characterize complement receptor 4 as a strong binder of amyloids and show Aβ aggregates are preferentially phagocytosed and stimulate lysosomal activity through this receptor in stem cell-derived microglia. KIM127 integrin activation in monocytes promotes size selective phagocytosis of Aβ. Hydrodynamic calculations suggest Aβ aggregates associate with vessel walls of the cortical capillaries. In turn, we hypothesize aggregates may provide an adhesion substrate for recruiting CD18-rich monocytes into the cortex. Our results support a role for complement receptor 4 in regulating amyloid homeostasis.


Conflict of interest statement

The authors declare no competing interests.

Figures

Fig. 1
Fig. 1. Detection of Aβ aggregates using fluorescence detection nanoparticle tracking analysis, sedimentation velocity analytical ultracentrifugation, and scanning electron microscopy.
a QD-based reporter system for detecting aggregated Aβ in complex bioliquid using 20-nm QDs with covalent coupling to aducanumab biosimilar (Adu Bios.) or isotypic control Ab. bd Adu Bios. QD-conjugate specificity towards A-Aβ vs. isotype control Ab QD-conjugate (2 biologically independent experiments with 5 technical replicates; mean ± SEM). FDM-NTA size profiles for 1:10 HC plasma spiked with 62.5 ng/ml A-Aβ in the interval 0–600 (b) nm, 50–150 nm (c) and 600–900 nm (d). In (e), the sum of aggregates >600 in plasma spiked with 0–250 ng/mL of A-Aβ is shown as a function of the A-Aβ concentration (2 biologically independent experiments with 5 technical replicates were analyzed using a two-way ANOVA mixed effects model with p-value indicating column effect; mean ± SEM). f, g Rayleigh interference optical sedimentation boundaries of A-Aβ. Best-fit from the c(s) model at 1000 µg/mL, sedimenting at 3000, 10,000, and 40,000 rpm (~700 × g, ~7800 × g and ~125,000 × g, respectively). Residuals are shown in the lower panel. Each scan is shown in a color temperature indicating the evolution of time (f). SV-AUC of Aβ with the normalized abundance of aggregates, c(s), plotted as a function of the sedimentation coefficient (g). h ∼700-nm Aβ-fibril binding multiple Ab-QD conjugates visualized by SEM. i, j Cluster analysis of experimentally generated surfaces and simulated surfaces with random positioning of particles in an equal size field of view. Data were fitted to a Gompertz growth model using Graphpad Prism for clustering of two or more particles (2+) and three or more particles (3+). Data represent three biologically independent experiments with 6 images from each sample. Source data are provided as a Source Data file.
Fig. 2
Fig. 2. Aβ aggregates in plasma larger than 600 nm from healthy controls (HC), mild cognitive impairment (MCI) patients, or aged PDAPP mice.
NTA size distribution from HC and MCI plasma incubated with Adu bios (MCI; n = 38, HC; n = 17; mean ± SEM). QDs in the size range 0–600 nm (a), 50–150 nm (b), and 600–975 nm (c). d Quantification of Aβ aggregates >600 nm from HC and MCI. Significance was tested in an unpaired two-sided t-test with Welch correction for unequal variances (MCI; n = 38, HC; n = 17; mean ± SEM). e, f Quantification of soluble and insoluble Aβ40 and Aβ42 from the cortex and hippocampus of PDAPP mice. Significance was tested using a two-sided paired t-test (n = 11; 5 male, 6 female; mean ± SEM). g NTA size distribution from PDAPP mice and magnification of 600–975 nm (n = 11; 5 male, 6 female; mean ± SEM). h Quantification of Aβ aggregates >600 nm from PDAPP mice (n = 11; 5 male, 6 female; mean ± SEM). i–p Flow cytometric analysis of monocyte subsets from MCI patient and HC plasma. Percentage of all monocytes (i) classical monocytes (CD14++ CD16) (j), intermediate monocytes (CD14++ CD16+) (k), non-classical monocytes (CD14+ CD16++) (l), and unclassified monocytes (CD14 CD16) (m) of total monocytes. The MCI cohort were stratified into groups of >600 nm aggregate-positive (Agg [+]) and aggregate-negative (Agg [−]) patients. Statistical analyses in I-M were made with Kruskal–Wallis and Dunn’s multiple comparisons test (Controls; n = 17, MCI Agg [−]; n = 28, MCI Agg [+]; n = 10; mean ± SEM). (n, o) Correlation between the concentration of aggregates Agg [+] MCI patients and membrane expression of CD18 (MFI) in intermediate (n) and non-classical monocytes (o). p Correlation between unclassified monocyte expression of activated (KIM127+) CD18 and concentration of aggregates in Agg [+] MCI patients. In (np), Spearman’s correlation coefficient (R2) was calculated together linear regression and a two-sided test of the slope to be non-zero (n = 10; error bars indicate SE). Source data are provided as a Source Data file.
Fig. 3
Fig. 3. Large Aβ Agg [+] MCI patients display lower AD-like brain pathology than large Aβ Agg [-] MCI.
a 18F-FTP PET uptake in each group at baseline, two-year follow-up, and longitudinal change. The mean was calculated in a ROI comprising the entorhinal, amygdala, parahippocampal, fusiform, inferior temporal, and middle temporal cortical regions; mean ± SD. b Mean 11C-PiB PET uptake in each group at baseline, two-year follow-up, and longitudinal change. The mean uptake was calculated in a ROI comprising the prefrontal, orbitofrontal, anterior and posterior cingulate, precuneus, parietal, and temporal cortical regions; mean ± SD. c Mean cortical 18F-FTP PET uptake in each group at two-year follow-up (left panel) and statistical results from a two-sided unpaired t-test between large Aβ Agg [+] MCI patients vs. controls and large Aβ Agg [-] MCI patients, respectively (right panel). d Mean cortical 11C-PiB PET uptake in each group at two-year follow-up (left panel) and statistical results from a two-sided unpaired t-test between large Aβ Agg [+] MCI patients vs. controls and large Aβ Agg [−] MCI patients, respectively (right panel). Positive t-values (red) indicate significantly lower uptake in the large Aβ Agg [+] MCI group. Statistical cortical maps were familywise error rate corrected (α = 0.05) using cluster-extent-based thresholding with a primary cluster-defining threshold of p < 0.05. Source data are provided as a Source Data file.
Fig. 4
Fig. 4. Hydrodynamic focusing and endothelial impact of blood-born particles.
a Simulation of particle behavior in straight vessels with diameters of 4 (black) and 8 (gray) µm. Initially (t = 0 s), all particles are evenly distributed. The plot shows the normalized average distance in the radial direction of all particles as a function of time. According to the applied model, particles redistribute giving rise to inertial focusing. This mechanism is seen as a shift in average distance primarily in smaller vessels and for larger particles. b Trajectories of 900 (black dots) and 75 (blue dots) nm sized particles in a 4-µm in diameter vessel 9 mm long. The small, 75-nm particles shown to the right realize no inertial focusing. The larger, 900-nm particles (black dots) are depicted at time equal to 0, 0.4, 1, and 1.6 s. Immediate inertial focusing of these larger particles, following the trajectory of gray lines, is realized after a few ms as seen in the lower right corner of the plot. The bars in color and greyscale show the particle velocity in the radial direction. The larger particles move inwards at the lower right corner with a velocity of −2 µm/s. c, d Particle behavior in a branched 3D vessel. c Trajectories of 75-nm sized particles at 0.3, 0.4, 1.0, and 1.4 ms after being release at the inlet. The arrows indicate the flow direction of 50 out of 20.000 particles being modelled. The color indicates the kinetic energy of particles in units of yocto (10−24×) Joules. The grayscale shown on the outlets plot the spatial distribution of inertial focused particles. d Particle impact on the endothelial surface detected by the model with calculation of the kinetic energy. Sizes from 40 to 900 nm were investigated and variations in impact pattern and energy levels are clearly demonstrated. Larger particles showed more localized impact zones and a 10,000-fold increase in endothelium impact energy.
Fig. 5
Fig. 5. CR4 binds preferentially aggregated Aβ.
a Stacking of 5 parallel beta sheet strands of an Aβ amyloid generated from the PDB entry #6SHS. b The ligand binding αXI domain of CR4 (PDB #4NEH) was docked onto one Glu-3 side chain from the fibril to coordinate the Mg2+ ion (in blue) in the metal ion-dependent adhesion site of the I domain. The other negative charge of the Glu-3 ladder fitted a mainly positively charged groove in the I domain. c Model of the CR4 ectodomain on a cell surface in contact with a segment of a mature Aβ fibril repeating the orientation of CR4 I domain binding site with a periodicity of ∼43 nm. Adhesion to surfaces coated with Aβ by parental K562 cells (d) or with recombinant CR3 (e) or CR4 (f) expression. Surfaces were treated with Gu·HCl or left untreated n = 5 biologically independent experiments; mean ± SEM. Statistical analyses were made in a two-way ANOVA test with Geisser–Greenhouse correction. g, h Monocyte adhesion to aggregated Aβ. g Adhesion was compared in the presence or absence of CD18 integrin-activating KIM127 Ab. Monocytes from n = 3 donors used in biologically independent experiments; mean ± SEM, were using a two-way ANOVA test with Geisser–Greenhouse correction. h Adhesion of CR3 and CR4 was tested using function-blocking Abs ICRF44 and Ab 3.9 to CR3 and CR4, respectively, with isotypic IgG1 Ab as control. Surfaces were coated with Aβ at 2 µg/mL. Monocytes from n = 8 donors were used in biologically independent experiments and analyzed in repeated-measures one-way-ANOVA with Turkey’s correction for multiple comparison; mean ± SEM. SPR analysis of CR3 (i, j) and CR4 I-domain (k, l) binding to aggregated and monomeric Aβ coated at a density of 100 fmol Aβ42/mm2. All sensorgrams were fitted using EVILFIT. The ensemble of 1:1 interactions was distributed according to equilibrium dissociation constant (KD) and dissociation rate (koff) with the abundance in arbitrary resonance units (RU) shown in colors. The total sum of binding (∫∫dkoffdKD) and root-mean-square deviation (rmsd) between the experimental data and the model, both in RU, are indicated for each analysis. All results are representative of three biologically independent experiments. Source data are provided as a Source Data file.
Fig. 6
Fig. 6. KIM127 integrin activation in monocytes promotes size-selective phagocytosis of Aβ.
a Schematic of experiments with monocyte phagocytosis of Hilyte-labeled aggregated or monomeric Aβ, either in the presence or absence of control IgG, CD18 activating KIM127 Ab and/or CR4 function blocking Ab 3.9. b Aβ uptake influenced by Aβ aggregation, KIM127 activation, and CR4 function blocking. c Schematic of experiments with monocyte phagocytosis of QD-labeled aggregated or monomeric Aβ, either in the presence or absence of CD18 activating KIM127 Ab and subsequent size-distribution analysis using NTA. dh Size distribution in supernatant after phagocytosis of M- or A-Aβ. Distribution of particles between 0–200 nm, with or without KIM127 activation (d). Normalized cumulative size distribution (e) with a magnification of the interval reaching 80–100% of particles (f). Summary of results for all donors showing total particles detected in supernatants after phagocytosis (g). Fraction of particles above 50 nm left in supernatant after phagocytosis (h). In (b) monocytes from n = 8 donors in biologically independent experiments were analyzed with repeated-measure one-way ANOVA with Holm–Sídák’s correction for multiple comparisons; mean ± SEM. dh, monocytes from n = 13 donors in biologically independent experiments were analyzed in a one-sided Kolmogorov–Smirnov test (e) or in a repeated-measure one-way ANOVA with Dunnett’s correction for multiple comparisons; mean ± SEM. Source data are provided as a Source Data file.
Fig. 7
Fig. 7. KIM127 integrin activation in iPSC-derived microglia promotes CR4-dependent, size-selective phagocytosis of Aβ and enhances CR4 membrane expression.
a Schematic outline of the iPSC-to-microglia (iMG) differentiation protocol and phase-contrast images of iPSCs, HPs, and iMG at different stages of the microglia differentiation protocol. Scale bar represents 1000 µm (iPSC, Day 3, and Day 11) and 200 µm (Day 23 and Day 38). b Schematic of experiments with iPSC-derived microglia phagocytosis using HiLyte™ 488-labeled Aβ42 and KIM127 activation. c Aβ uptake influenced by Aβ aggregation and KIM127 activation. d Lysosomal activity influenced by Aβ aggregation and KIM127 activation. CR4 (e) or CR3 (f) surface expression as influenced by Aβ aggregation and KIM127 activation. g Functional knock-out of CR4 using the function-blocking Ab 3.9 and subsequent microglia ability to phagocytose A-Aβ. In c-f, cells iPSC-derived microglial cultures were tested in biologically independent experiments and statistically analyzed using repeated-measure one-way-ANOVA with Turkey’s correction for multiple comparisons (n = 8 for A (+) IgG (+) and A (+) KIM127 (+). All other conditions n = 6; mean ± SD). In (g), cells from n = 6 cultures were tested in biologically independent experiments and statistically analyzed using a two-sided paired t-test; mean ± SD. Source data are provided as a Source Data file.
Fig. 8
Fig. 8. The presence of >600 nm Aβ aggregates in plasma results in Aβ deposition in the cerebral microvasculature, supports monocyte adhesion, and low levels of AD-like pathology in MCI patients.
a HCs have no large Aβ aggregates in plasma and, as a result, no recruitment of CD18-rich, non-classical monocyte subsets to the cerebral vasculature. b MCI large Agg. [+] patients present a deposition of the large Aβ aggregates in cerebral capillaries and post-capillary venules, supporting CR4-mediated adhesion of the CD18-rich, non-classical monocytes. The low brain pathology, as recorded in the PET scans, supports a model where extravasated monocytes adds to the microglial clearing of pathologic Aβ aggregates in the cerebral cortex. c Large Agg [−] MCI patients lack monocyte depletion from blood, reducing extravasation of these cells. As a result, amyloid aggregates build up in the cortex to form large PET-detectable plaques.

References

    1. Heneka MT, et al. Neuroinflammation in Alzheimer’s disease. Lancet Neurol. 2015;14:388–405. doi: 10.1016/S1474-4422(15)70016-5. - DOI - PMC - PubMed
    1. Bettcher BM, Tansey MG, Dorothee G, Heneka MT. Peripheral and central immune system crosstalk in Alzheimer disease—a research prospectus. Nat. Rev. Neurol. 2021;17:689–701. doi: 10.1038/s41582-021-00549-x. - DOI - PMC - PubMed
    1. Cummings J, et al. Lecanemab: appropriate use recommendations. J. Prev. Alzheimers Dis. 2023;10:362–377. - PMC - PubMed
    1. Petersen RC. Mild cognitive impairment as a diagnostic entity. J. Intern. Med. 2004;256:183–194. doi: 10.1111/j.1365-2796.2004.01388.x. - DOI - PubMed
    1. Parbo P, et al. Brain inflammation accompanies amyloid in the majority of mild cognitive impairment cases due to Alzheimer’s disease. Brain. 2017;140:2002–2011. doi: 10.1093/brain/awx120. - DOI - PubMed